

Key Points
SCD subjects show stronger and faster vasoconstriction to thermal stimuli, indicating autonomic hypersensitivity of their microvasculature.
Cumulative vasoconstriction with repeated thermal stimuli progressively decreases perfusion and delays microvascular red cell transit.

Abstract
Persons with sickle cell disease (SCD) exhibit subjective hypersensitivity to cold and heat perception in experimental settings, and triggers such as cold exposure are known to precipitate vaso-occlusive crises by still unclear mechanisms. Decreased microvascular blood flow (MBF) increases the likelihood of vaso-occlusion by increasing entrapment of sickled red blood cells in the microvasculature. Because those with SCD have dysautonomia, we anticipated that thermal exposure would induce autonomic hypersensitivity of their microvasculature with an increased propensity toward vasoconstriction. We exposed 17 patients with SCD and 16 control participants to a sequence of predetermined threshold temperatures for cold and heat detection and cold and heat pain via a thermode placed on the right hand. MBF was measured on the contralateral hand by photoplethysmography, and cardiac autonomic balance was assessed by determining heart rate variability. Thermal stimuli at both detection and pain thresholds caused a significant decrease in MBF in the contralateral hand within seconds of stimulus application, with patients with SCD showing significantly stronger vasoconstriction (P = .019). Furthermore, patients with SCD showed a greater progressive decrease in blood flow than did the controls, with poor recovery between episodes of thermal stimulation (P = .042). They had faster vasoconstriction than the controls (P = .033), especially with cold detection stimulus. Individuals with higher anxiety also experienced more rapid vasoconstriction (P = .007). Augmented vasoconstriction responses and progressive decreases in perfusion with repeated thermal stimulation in SCD are indicative of autonomic hypersensitivity in the microvasculature. These effects are likely to increase red cell entrapment in response to clinical triggers such as cold or stress, which have been associated with vaso-occlusive crises in SCD.
Introduction
Sickle cell disease (SCD) is a genetic disorder characterized by the production of an abnormal hemoglobin (Hb S), which polymerizes upon deoxygenation. This phenomenon leads to the transformation of flexible red blood cells (RBCs) into rigid sickle-shaped cells that obstruct microvascular blood flow (MBF), causing ischemia and pain.1,2 Sudden onset of acute pain, known as a vaso-occlusive crisis (VOC), is the major contributor to SCD morbidity. The frequency and severity of a VOC vary significantly among patients, with only a small percentage of all at-risk SCD patients accounting for most of the hospital admissions for a VOC.3 Although genetic factors such as coinheritance of α-thalassemia and persistence of fetal hemoglobin are well-established disease modifiers, these genetic differences do not fully explain why some individuals have a much higher frequency of VOCs.4-6 The triggers for a VOC also vary widely among patients with SCD; however, cold exposure, mental stress, and pain are common offenders reported by patients. Nevertheless, the mechanism responsible for the transition from steady state to acute VOC is not known.
The accepted theoretical disease construct suggests that vaso-occlusion occurs when the time taken for RBCs to transition from flexible to rigid is shorter than the time it takes for them to transit through the microvasculature into larger diameter vessels, causing rigid RBCs to become lodged in the microvasculature and vaso-occlusion to occur.7,8 Various factors, such as nitric oxide depletion, endothelial activation, and adhesion of RBCs, white cells, and platelets to the vascular endothelium,9,10 act in concert to impair microvascular flow and set the stage for vaso-occlusion at steady state. However, the temporal relation of cold exposure or mental stress to onset of symptoms suggests that the event that finally leads to clinically perceptible vaso-occlusion occurs fairly quickly. In our recent studies, patients with SCD and control individuals showed significant global vasoconstriction in response to experimental mental stress and heat pain,11,12 and SCD patients had significant autonomic hyperresponsiveness,13 making it very likely that neural-mediated vasoconstriction further decreases perfusion beyond steady state, to bring about VOC in response to triggers such as stress, pain, and cold exposure.
Based on thermal perception assays, persons with SCD seem to have altered sensitivity to cold and heat perception,14,15 and environmental cold exposure is known to trigger a VOC.16-23 In order to understand the mechanisms that may trigger vaso-occlusion in SCD, we measured peripheral vasoconstriction responses to sequential heat and cold stimulation, as well as the cardiac autonomic balance responses in patients with SCD and in control individuals. We found that the threshold temperatures for heat and cold detection and pain were the same for patients and controls, but that the vasoconstriction responses were much greater and occurred much faster in patients with SCD than in controls. Furthermore, in contrast to previous work in which a single painful thermal stimulus was used, there was significant summation of vasoconstriction with each subsequent stimulus when subjects were exposed to a series of hot or cold stimuli. The studies presented here demonstrate significant neural-mediated vascular hyperreactivity in SCD that is likely to contribute significantly to regional hypoperfusion, entrapment of RBCs, and microvascular occlusion.
Materials and methods
Participant recruitment
Patients with SCD, aged ≥13 years, were recruited from the Hemoglobinopathy Center at Children’s Hospital Los Angeles (CHLA) from November 2016 through November 2017. They had the Hb SS, Sβ0, or Sβ+ genotype and had not experienced a pain crisis or been hospitalized for at least 2 weeks before the study. Age- and race-matched control participants were recruited from siblings, friends, and relatives of the patients. Participants were excluded if they were taking short-acting opiates at the time of the study or if they had chronic pain or any neurologic disorders affecting sensation, including neuropathic pain. Informed consent was obtained in accordance with the protocol approved by the Institutional Review Board at CHLA and conformed to the standards set by the Declaration of Helsinki for human studies.
Prestudy procedures
All studies were performed during the morning by the same investigator using standard procedures in a quiet, climate-controlled setting.12,24 Participants were encouraged to refrain from caffeine the day before the study, to avoid its autonomic influence. On the day of the study, a focused history, physical examination, and blood draw for complete blood counts and hemoglobin electrophoresis were performed. Patients were also asked to complete standardized questionnaires to assess their anxiety levels: the State Trait Anxiety Inventory (STAI) Form Y-1, which measures current state of anxiety; the STAI Form Y-2, which identifies anxiety as a general trait in individuals25,26 ; and the Pain Anxiety Symptoms Scale (PASS), which evaluates pain-related anxiety.27,28
Determination of thermal detection and thermal pain thresholds
We used standard Quantitative Sensory Testing (QST) methods12,24,29-32 to determine for each subject the temperature at which the thermal stimulus was felt (thermal detection) and the temperature that was perceived as painful (thermal pain). Consistent with other key studies on thermal sensitivity in SCD,14,15 the thermal detection thresholds were determined before the thermal pain thresholds, to avoid the bias of previous pain testing on detection thresholds.33 This made it impossible to randomize the order of stimuli; thus, the tests were always performed in the following order: (1) cold detection; (2) heat detection; (3) heat pain; and (4) cold pain.
Participants were seated upright in a comfortable recliner and a Medoc Thermal Neurosensory Analyzer (TSA-II) thermode, which can be programmed to deliver pulses of thermal stimuli between 0°C and 50°C, was applied to the right thenar eminence. Thermal detection thresholds were determined by increasing and decreasing the thermode temperature at a fixed rate from a baseline temperature of 32°C until the person responded with the word “cold” or “heat” upon perceiving the respective sensation. Similarly, thermal pain thresholds were determined by increasing and decreasing the thermode temperature until the person responded with the word “pain” when first feeling discomfort from the thermal stimulus. Once the participant responded, the temperature was rapidly reset to baseline. An average of 3 measurements for each threshold was used to determine the specific cold and heat threshold temperatures for each subject12,24,34
Physiological measurements
Once the thermal thresholds were determined, the physiologic sensors were placed on the participant for continuous measurements of perfusion during the thermal stimulus protocol. MBF was measured with an infrared plethysmograph (PPG; Nonin, Plymouth, MN) sensor placed on the left thumb, always contralateral to the hand of stimulus application. The amplitude of the PPG signal derived from its raw waveform reflects changes in the peripheral vascular bed controlled by the sympathetic nervous system, with low amplitude reflecting vasoconstriction.12,24,34-36 Electrocardiogram (ECG), continuous blood pressure (Nexfin; Bmeye, Amsterdam, The Netherlands) and respiratory wave forms (thoracic and abdominal bands; zRip DuraBelt; Philips) were also recorded. The standard deviation of the cardiac beat-to-beat interval (R-R interval [RRI]) derived from the ECG reflects total heart rate variability (HRV), a measure of cardiac autonomic balance.37 As described in our previous studies,12,13,24 signals from all devices, including thermode temperature, were recorded concurrently and continuously at subsecond sampling rates with the Biopac-Acqknowledge data-acquisition system.12,24,34
Thermal stimulus protocol
Participants were asked to rest comfortably, and baseline physiological recordings were obtained for 5 minutes, after which they received 1-time standardized verbal instructions about upcoming thermal stimuli. At 3 minutes after the verbal instructions, 4 pulses of each of the threshold temperatures were applied in the order mentioned in “Physiological measurements”; each set of 4 pulses was referred to as a cycle. Each thermal pulse within the cycle was separated by 1 minute, and each cycle was separated by 4 minutes (Figure 1). The entire stimulus protocol lasted ∼45 minutes. Interactions between investigator and participant were minimal during the protocol, once the initial verbal instructions was given. All recorded data were exported to a browser specially designed in MatLab for processing and analysis.12,24,34
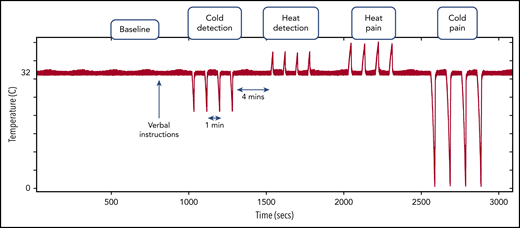
Thermal stimulus protocol showing the timing and order of the different thermal stimuli after a baseline recording period. Red signal with the pulses represents the thermode temperature, showing the pattern of thermal stimuli. During the verbal instructions, the participant was informed of upcoming thermal stimuli, but there was minimal interaction thereafter.
Thermal stimulus protocol showing the timing and order of the different thermal stimuli after a baseline recording period. Red signal with the pulses represents the thermode temperature, showing the pattern of thermal stimuli. During the verbal instructions, the participant was informed of upcoming thermal stimuli, but there was minimal interaction thereafter.
Quantification of the MBF response
Mean MBF during the baseline and thermal stimulus cycles was derived from the PPG amplitude. The magnitude of vasoconstriction was assessed by calculating the percentage decrease in mean MBF from baseline, with a greater percentage decrease indicating stronger vasoconstriction.12,24,34 To determine if the thermal stimulus pattern within each cycle produced a corresponding pattern of vasoconstriction, the thermode temperature signal (Figure 1) was cross-correlated with the corresponding blood flow signal34 (supplemental Figure 1, available on the Blood Web site). The cross-correlation algorithm determines the point of maximum correlation between the thermode signal and the corresponding PPG amplitude signal in a 30-second window, before and after the thermal stimulation. The Spearman’s rank correlation coefficient and associated permutation P-value indicate the magnitude and statistical significance of the cross-correlation. Thus, a significant P-value indicates that the thermal stimulus pattern causes a synchronized nonrandom vasoconstriction pattern. The cross-correlation algorithm also determines the time to vasoconstriction (in seconds), which is the time interval between stimulus application and vasoconstriction response.12,34
Quantification of the HRV response
HRV was derived from the standard deviation of the RRI during baseline and thermal stimulus cycles. Stationary power spectral analysis of the RRI was used to break down the HRV into its sympathetic and parasympathetic components. The low-frequency power (LFP) of HRV (range, 0.04-0.15 Hz) reflects a combination of cardiac sympathetic and parasympathetic activities, whereas the high-frequency power (HFP; range, 0.15-0.4 Hz) reflects parasympathetic activity, and the low-to-high ratio (LHR; LFP/HFP) reflects the sympathovagal balance.37,38
Statistical analysis
Statistical calculations were made with JMP, version 13 (SAS Institute Inc., Cary, NC), and STATA/IC, version 14.1 (StataCorp LP, College Station, TX). Group differences were tested with the Student t test or Wilcoxon nonparametric test for continuous variables and Pearson’s χ2 test for dichotomous variables. The percentage of change in MBF from baseline and the time to vasoconstriction were used individually to assess the vasoconstriction response. Type of thermal stimulus, age, sex, diagnosis, hemoglobin, and PASS and STAI Y1 and Y2 scores were the independent variables. If the independent variables had a P < .2 in univariate analysis, they were included in the multivariate repeated-measures analysis of variance (ANOVA) model. A stepwise estimation method was used to arrive at the final multivariate model, with a significance level at P < .05. Skewed continuous variables were transformed by the method that most closely approximated normality. Repeated-measures ANOVA was used to compare the HRV and its components between the baseline and thermal stimulus cycles.
Results
Participant characteristics
The participants’ baseline characteristics are summarized in Table 1. A total of 17 patients with SCD and 16 control participants completed the study with analyzable data. Of the 17 patients with SCD, 11 were receiving hydroxyurea, reflective of the Center’s standard practice of initiating hydroxyurea in patients with Hb SS or Sβ0 at an early age, irrespective of disease severity; 5 were receiving frequent transfusions, most commonly initiated for elevated transcranial Doppler velocities; and 1 was receiving neither. The patients with different genotypes were grouped together for analysis. Control participants included 5 with sickle cell trait (HbAS) and 11 normal (HbAA). There was no significant difference between the SCD and control groups in age, sex, and ethnicity (Table 1). The SCD group had significantly higher PASS scores, reflecting higher pain-related anxiety. The STAI Y1 and Y2 scores, which indicate anxiety state at the time of the experiment and general anxiety trait, respectively, were not significantly different between the 2 groups. The median threshold temperatures for thermal detection and thermal pain were also comparable between the 2 groups (Table 1).
Subject characteristics
| SCD group | Control group | P | |
|---|---|---|---|
| n = 17 | n = 16 | ||
| Diagnosis, n (%) | |||
| SCD-SS | 14 (82) | — | |
| SCD-S β0 Thal | 2 (12) | — | |
| SCD-S β+ Thal | 1 (6) | — | |
| Sickle cell trait | — | 5 (31) | |
| HbAA | — | 11 (69) | |
| Mean age, y (SD) | 21.6 (6.9) | 22 (8.1) | .89* |
| Sex, n (%) | .62† | ||
| Male | 11 (65) | 9 (56) | |
| Female | 6 (35) | 7 (44) | |
| Race/ethnicity, n (%) | .94† | ||
| African American | 15 (88) | 14 (88) | |
| Hispanic | 2 (12) | 2 (12) | |
| Mean Hb, g/dL, (SD) | 9.1 (1.5) | 13.1 (1.2) | <.0001* |
| STAI anxiety score, median (IQR) | |||
| Y1 (now) | 23 (20-31.5) | 25 (22.2-30.2) | .5‡ |
| Y2 (in general) | 28 (24-36.5) | 29 (25-35.2) | .9‡ |
| PASS, median (IQR) | 50 (29.5-59.5) | 19.5 (9.5-37.5) | .013‡ |
| Median threshold temperature, °C (IQR) | |||
| Cold detection | 22 (15.7-27.2) | 21.3 (18.1-24.5) | .74‡ |
| Heat detection | 39.6 (36.8-43.9) | 40.7 (37.3-43.8) | .81‡ |
| Heat pain | 49.1 (46.7- 50) | 48.7 (45.3-50) | .64‡ |
| Cold pain | 5.6 (0.3-11.8) | 7.5 (1.5-14.7) | .48‡ |
Significant P-values are in bold.
Student t test.
χ2 test.
Wilcoxon rank sum test.
Patients with SCD have a stronger and faster vasoconstriction response to thermal stimuli
There was a significant decrease in mean MBF from baseline in response to heat and cold exposures, both at detection and pain threshold temperatures across all 33 subjects (ANOVA; P < .0001; Figure 2), implying significant vasoconstriction with thermal stimulation. The type of thermal stimulus, diagnosis, sex, and PASS scores were the strongest predictors of the percentage of change in MBF by univariate analysis. In the final multivariate model, the percentage of decrease in MBF from baseline was greater in patients with SCD across all thermal stimulus cycles (P = .019; Figure 3; Table 2), indicating significantly stronger vasoconstriction than in the controls. Interestingly, patients with SCD and the control participants with greater pain anxiety (higher PASS scores) had a lesser decrease in MBF from baseline after thermal stimulation (multivariate P = .026; supplemental Figure 2). This result is partly explained by the significantly lower MBF at baseline among some of the participants with higher pain anxiety, who already had vasoconstriction and were unable to undergo further vasoconstriction with thermal stimulation. Notably, when SCD and control subjects were analyzed together, there was a cumulative increase in vasoconstriction with each successive thermal stimulus cycle (Figures 2 and 3), because the baseline blood flow did not recover before the next stimulation.
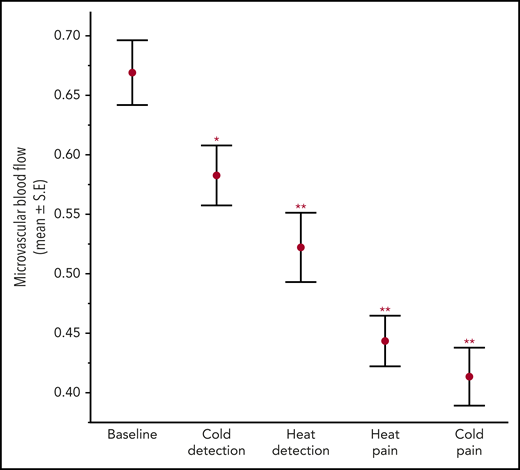
Microvascular blood flow during baseline and thermal stimulation cycles in all subjects. There was a significant decrease in MBF from baseline with thermal stimulation. Mean ± SEM. Repeated-measures ANOVA from baseline MBF. *P = .027; **P < .0001.
Microvascular blood flow during baseline and thermal stimulation cycles in all subjects. There was a significant decrease in MBF from baseline with thermal stimulation. Mean ± SEM. Repeated-measures ANOVA from baseline MBF. *P = .027; **P < .0001.
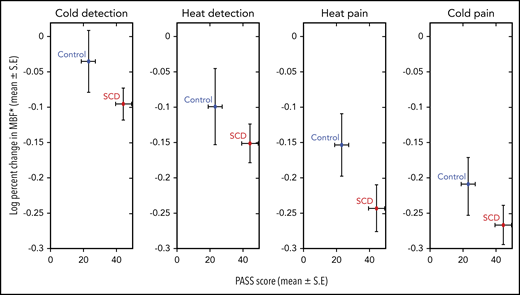
Log-transformed percentage of change in mean MBF with thermal stimulation in patients with SCD and controls. For all thermal stimuli, patients with SCD showed a significantly greater decrease in MBF (multivariate repeated-measures ANOVA, P = .019), as depicted on the y-axis. Patients with SCD had significantly higher PASS scores than controls (P = .013) as depicted on the x-axis. By multivariate analysis, the PASS score was a significant predictor of MBF response (P = .026). *Log10 (x + 1) transformed data.
Log-transformed percentage of change in mean MBF with thermal stimulation in patients with SCD and controls. For all thermal stimuli, patients with SCD showed a significantly greater decrease in MBF (multivariate repeated-measures ANOVA, P = .019), as depicted on the y-axis. Patients with SCD had significantly higher PASS scores than controls (P = .013) as depicted on the x-axis. By multivariate analysis, the PASS score was a significant predictor of MBF response (P = .026). *Log10 (x + 1) transformed data.
Univariate and multivariate analyses for predictors of percentage change in MBF from baseline and time to vasoconstriction
| Independent predictors | Univariate P | Multivariate model P |
|---|---|---|
| Percentage of change in MBF from baseline | ||
| Type of thermal stimulus | <.0001 | <.0001 |
| Diagnosis (SCD/control) | .02 | .019 |
| Age | .18 | — |
| Sex | .13 | — |
| Hb | .12 | — |
| STAI-Y1 score | .9 | — |
| STAI-Y2 score | .72 | — |
| PASS score | .06 | .026 |
| Time to vasoconstriction | ||
| Type of thermal stimulus | .07 | — |
| Diagnosis (SCD/control) | .02 | .033 |
| Age | .85 | — |
| Sex | .1 | — |
| Hb | .006 | — |
| STAI-Y1 score | .002 | .007 |
| STAI-Y2 score | .24 | — |
| PASS score | .72 | — |
The parameters found to be significant by univariate analysis (P < .2; in bold) were used as covariates in the multivariate repeated-measures ANOVA. A stepwise estimation was used to arrive at the final multivariate model shown, with significance level P < .05 (in bold).
Unlike the mean MBF analysis, cross-correlation analysis was not affected by the continually dropping baseline flow and detected changes in flow specific to the thermal stimulus cycles. This analysis showed that cold pain pulses caused vasoconstriction in 67% of the subjects (Spearman’s correlation; P < .05), whereas painful heat pulses caused significantly correlated vasoconstriction in 56% of the subjects. Pulses at cold- and heat-detection temperatures caused significantly correlated vasoconstriction in 36% and 18% of the subjects, respectively. Although cold pain and detection caused vasoconstriction responses in a higher proportion of participants than heat pain and detection, the difference was not statistically significant. However, thermal pain thresholds caused cross-correlated responses in a significantly higher proportion of subjects than thermal detection thresholds (χ2 test; P < .0001).
The time from thermal exposure to vasoconstriction was comparable between the 4 thermal threshold stimuli but was significantly shorter in patients with SCD than in controls, indicating that those with SCD had a quicker vasoconstriction response (multivariate; P = .033; Figure 4; Table 2). Time to vasoconstriction was shorter in patients with SCD than in controls with cold detection, whereas it was the same for both groups with heat detection. In fact, the response time was the shortest for cold detection in patients with SCD. Individuals with higher anxiety state scores (STAI Y1) had a shorter time to vasoconstriction (multivariate; P = .007).
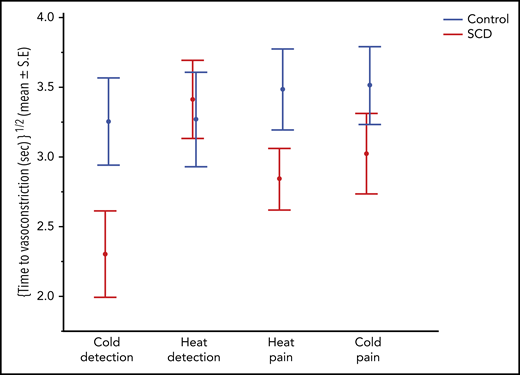
Time to vasoconstriction with thermal stimulation in patients with SCD and controls. By multivariate repeated-measures analysis, patients with SCD showed significantly faster vasoconstriction responses (P = .033) to thermal stimulation as depicted in the y-axis.
Time to vasoconstriction with thermal stimulation in patients with SCD and controls. By multivariate repeated-measures analysis, patients with SCD showed significantly faster vasoconstriction responses (P = .033) to thermal stimulation as depicted in the y-axis.
Individual variability in vasoconstrictive tone during thermal stimulation
It is clear that there was a cumulative decrease in blood flow with each successive stimulus, with blood flow seemingly decreasing more in patients with SCD than in the control participants (Figures 2 and 3). Closer inspection of the vasoconstriction patterns from individuals (Figure 5A) revealed that episodes of vasoconstriction after each thermal stimulus pulse were observed in both groups but with significant variability in blood flow recovery between stimuli. Subject 1 (the representative control) recovered blood flow rapidly and completely after each stimulus pulse. On the contrary, in subject 2 (the representative SCD patient), the peaks of flow became progressively lower and the duration of vasoconstriction progressively longer during the 45 minutes of recording. Random vasoconstriction also occurred during the baseline and prethermal stimulus periods (Figure 5A), and subject 2 clearly had larger constrictions and longer times at maximum constriction before recovery. Both the increased vasoconstrictive tone during baseline and the progressive vasoconstriction noted with thermal stimuli suggest that vascular reactivity was intrinsically greater in subject 2.
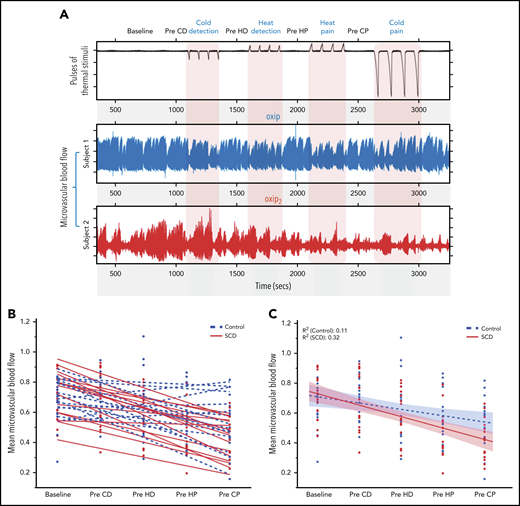
Individual variability in vasoconstrictive tone with thermal stimulation. (A) Top signal represents thermode temperature; next 2 signals depict microvascular blood flow in the finger of 2 representative subjects. Subject 1 shows vasoconstriction during each cycle of 4 thermal pulses, with good recovery of blood flow to baseline between cycles (Pre-CD, Pre-HD, Pre-HP, and Pre-CP). Subject 2 shows vasoconstriction during each cycle of thermal pulses, with poor recovery of blood flow between stimuli and progressive decrease in flow. (B) Linear slopes depicting microvascular blood flow between thermal stimuli (Pre-CD, Pre-HD, Pre-HP, and Pre-CP) for controls and patients with SCD subjects. The patients (red) showed poor recovery with a progressive decrease in blood flow between thermal stimuli compared with controls (blue) who mostly showed good recovery of the blood flow to baseline between thermal stimuli. (C) The mean recovery slope for SCD and control individuals (Student t test of mean slope values, P = .042). CD, cold detection; CP, cold pain; HD, heat detection; HP, heat pain.
Individual variability in vasoconstrictive tone with thermal stimulation. (A) Top signal represents thermode temperature; next 2 signals depict microvascular blood flow in the finger of 2 representative subjects. Subject 1 shows vasoconstriction during each cycle of 4 thermal pulses, with good recovery of blood flow to baseline between cycles (Pre-CD, Pre-HD, Pre-HP, and Pre-CP). Subject 2 shows vasoconstriction during each cycle of thermal pulses, with poor recovery of blood flow between stimuli and progressive decrease in flow. (B) Linear slopes depicting microvascular blood flow between thermal stimuli (Pre-CD, Pre-HD, Pre-HP, and Pre-CP) for controls and patients with SCD subjects. The patients (red) showed poor recovery with a progressive decrease in blood flow between thermal stimuli compared with controls (blue) who mostly showed good recovery of the blood flow to baseline between thermal stimuli. (C) The mean recovery slope for SCD and control individuals (Student t test of mean slope values, P = .042). CD, cold detection; CP, cold pain; HD, heat detection; HP, heat pain.
Figure 5B summarizes the change in mean prestimulus blood flow throughout the study for each participant. Most patients with SCD (solid lines) showed progressive vasoconstriction, whereas most of the healthy controls (dashed lines) had blood flow recovery between stimuli and thus had lower rates of progressive vasoconstriction (linear slope t test; P = .042; Figure 5C). When these data were analyzed using a random-effects linear model of MBF, there was strong evidence of vasoconstriction with all thermal stimuli (P < .0001). There was also a strong effect on blood flow of sequential stimulus repetition over time (P < .0001). The cumulative decrease in prestimulus blood flow with each subsequent thermal stimulus cycle was higher in patients with SCD (P = .049), indicating a higher vasoconstrictive tone in SCD.
Thermal pain significantly increases cardiac sympathetic activity and alters cardiac autonomic balance
Pain induced by heat and cold resulted in a significant increase in cardiac autonomic nervous system activity from baseline. The sympathetic plus parasympathetic activity indicated by log LHP and sympathovagal balance indicated by log LHR both increased (Figure 6). There was no significant difference in parasympathetic activity between baseline and thermal pain stimulus cycles. The increase in sympathovagal balance without significant changes in parasympathetic activity suggests an overall increase in cardiac sympathetic activity with thermal pain stimulation. Patients with SCD showed a significantly lower HRV at baseline and across all thermal stimulus cycles, as measured by the standard deviation of the RRI (41.2 vs 50 ms; Wilcoxon; P = .007). However, there were no significant differences in the measures of sympathovagal balance and parasympathetic activity between patients with SCD and control participants.
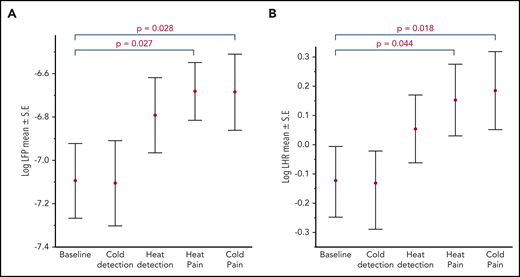
Heart rate variability responses to thermal stimulation in all participants. A significant increase in log LFP (sympathetic+parasympathetic component) (A) and in log LHR (sympathovagal balance) (B) with painful stimuli compared with baseline.
Heart rate variability responses to thermal stimulation in all participants. A significant increase in log LFP (sympathetic+parasympathetic component) (A) and in log LHR (sympathovagal balance) (B) with painful stimuli compared with baseline.
Discussion
The pathophysiology of vaso-occlusion in SCD is complex, encompassing endothelial dysfunction, inflammation, hemolysis, and hypercoagulability, all of which play a role in the disease process9 and occur chronically during the steady state. These factors operate mainly in the postcapillary venules to prolong RBC microvascular transit time. Hemolysis occurs continually in SCD, as does vaso-occlusion in the tissues. Although continual regional vaso-occlusion contributes to organ damage over time, it is not of sufficient magnitude to cause clinically perceptible acute pain. During steady state, the RBC transit time in most vascular beds is shorter than the delay time to Hb S polymerization, and the RBCs can escape into larger vessels before they become rigid.7,8 The mechanism that triggers transformation from steady state to VOC within a matter of minutes to hours is still poorly understood. The data presented herein suggest that the decrease in perfusion from repeated exposure to cold or painful events can make the transit time longer than the delay time to polymerization. The relative rapidity and connection to neural events such as cold, pain, and anxiety make vasoconstriction a likely candidate as a triggering mechanism for vaso-occlusion.
The progressive vasoconstriction with repetitive thermal stimuli seen during our experimental protocol emulates the clinical situation in that the triggers for VOC typically involve exposure to repeated stimuli such as cold, stress, or pain over an extended time. Figure 5B clearly shows that blood flow did not return to baseline during the 4 minutes between stimulus cycles in most patients with SCD, inducing a cumulative decrease in blood flow. This finding suggests that patients with SCD who have a progressive decrease in perfusion would be much more at risk of having RBC entrapment in the microcirculation by prolonged microvascular transit times. The trend toward nonrecovery of blood flow in patients with SCD was consistent with the increased sensitivity of the microvasculature to vasoconstriction and suggests that intrinsic differences in neural-mediated vascular reactivity among patients with SCD may contribute to the otherwise unexplained variability in VOC frequency.
We were not able to isolate a difference in the magnitude of vasoconstriction induced by heat from that induced by cold, because the order of the stimuli could not be randomized.33 The cross-correlation analysis, which evaluates the pattern of vasoconstriction within each thermal stimulus cycle, showed that a higher percentage of participants responded with synchronized vasoconstriction to cold detection and cold pain stimuli than to heat, but the difference between cold and heat responses were not statistically significant. However, the shorter time to response to cold in patients with SCD (Figure 4) is consistent with their hypersensitivity to cold seen during perception-based thermal studies.14,15 These immediate vasoconstriction responses to short thermal pulses applied to a small area of the skin on the contralateral arm are not equivalent to the global changes in peripheral perfusion occurring when an individual is exposed to a cold environment over a longer time. Indeed, such extended exposure to a cold environment has been associated with VOC16-23 and has given rise to the concept that the ability of a patient with SCD to sense cold is enhanced. In fact, environmental cold exposure most likely evokes a generalized decrease in perfusion, and additional vasoconstriction from autonomic stimuli such as pain or stress further lowers perfusion, thereby predisposing to vaso-occlusion. Interestingly, we found that the thresholds to perceive heat or cold temperatures or thermal pain were not significantly different between the SCD and control groups, even though the degree of autonomic vasoconstriction response to thermal stimuli was greater in those with SCD (Figures 3, 4, and 5C).
The fact that these perfusion changes are happening within seconds of stimulation in the hand opposite the stimulus hand shows that the vasoconstriction responses are primarily neural mediated, although vascular sensitivity and local nitric oxide concentration may modulate the magnitude of the constriction. The relation between time to response and state trait anxiety scores (STAI Y1; P < .01) also seems consistent with an autonomic mechanism that is influenced centrally. Although the effect size for STAI Y1 was small in the multivariate analysis, it was significant, suggesting that treatments directed at relieving anxiety may help reduce vascular reactivity. Baseline HRV was lower in SCD, as reported by others,39-43 but there were no differences between controls and patients with SCD in the direct measures of cardiac autonomic activity in response to thermal stimuli. Cardiac autonomic activity and peripheral vascular autonomic reactivity are related to each other via complex neural mechanisms, but are not equivalent. The augmented peripheral vascular autonomic responses to thermal stimuli in SCD without the corresponding differences in the cardiac autonomic indices is reflective of this fact.
These data show that increased autonomic activity leading to augmented vasoconstriction is a characteristic of SCD. As none of the patients had a history of severe chronic pain, and only 4 had more than 2 VOCs in the preceding year, we cannot conclude that the vascular reactivity is because of previous episodes of pain. Anemia was not a significant factor in the multivariate analysis, and when we excluded the 5 patients receiving repeated transfusions, the results of the data analyses were the same (supplemental Tables 1 and 2), which argues against anemia as a cause of the autonomic hyperactivity. Interestingly, a marked increase in neural impulses has been seen in direct recordings from the spinal cord of sickle cell mice exposed to painful stimuli,44 and autonomic dysfunction is observed in persons with SCD as well as sickle cell trait,45-47 again consistent with an association between having Hb S and autonomic dysfunction. Nevertheless, the mechanism of enhanced autonomic activity remains unclear.
In summary, the data in this study show a global neural-mediated decrease in microvascular perfusion with thermal stimulation. Patients with SCD had much stronger peripheral vasoconstriction and evidence of cardiac autonomic imbalance. Decreased microvascular blood flow has significant implications for vaso-occlusion in SCD, increasing the likelihood that Hb S polymerization will occur while the RBCs are still in the capillaries as opposed to the large postcapillary venules, thus increasing the risk of vaso-occlusion.7,8 These findings suggest that in SCD, autonomic vascular dysfunction plays a significant role in triggering and maintaining VOC. Moreover, individuals with higher anxiety also had a faster vasoconstriction, suggestive of a mechanism by which anxiety and mental stress may increase VOC severity in SCD and contribute to phenotype variability. Microvascular perfusion and vascular autonomic reactivity in SCD can thus serve as potential targets for prevention and treatment of pain in SCD.
For original data, please e-mail the corresponding author.
The online version of this article contains a data supplement.
The publication costs of this article were defrayed in part by page charge payment. Therefore, and solely to indicate this fact, this article is hereby marked “advertisement” in accordance with 18 USC section 1734.
Acknowledgments
The authors acknowledge the late Mammen Puliyel for his role in the initial design of the experiment. The authors thank Martine Torres for critical reading of the manuscript and editorial assistance.
This work was supported by National Institutes of Health, National Heart, Lung, and Blood Institute grant U01 HL117718 and National Institute of Biomedical Imaging and Bioengineering grant P41 EB001978, and the Larry and Helen Hoag foundation.
Authorship
Contribution: S.V. designed and performed the experiments, analyzed and interpreted the data and wrote the paper; P.S. performed data analyses and wrote the paper; M.K. designed the experiments; W.T., P.C., J.S., and C.C.D. performed data analysis and interpretation; R.K., J.D., J.C.W., and L.Z. designed the experiments and contributed to data interpretation; R.S. performed the statistical analyses; M.C.K.K. designed the experiments and analyzed and interpreted the data; T.D.C. conceived and designed the experiments, analyzed and interpreted the data, and wrote the paper; and all authors reviewed and revised the manuscript.
Conflict-of-interest disclosure: The authors declare no competing financial interests.
Correspondence: Thomas D. Coates, 4650 Sunset Blvd, MS 54, Los Angeles, CA 90027; e-mail: tcoates@chla.usc.edu.

This feature is available to Subscribers Only
Sign In or Create an Account Close Modal