

Key Points
Germline DHFR variants are associated with higher levels of short-chain methotrexate polyglutamates.
Germline FPGS variants are associated with impaired accumulation of long-chain methotrexate polyglutamates and increased relapse risk.

Abstract
Methotrexate (MTX) during maintenance therapy is essential for curing acute lymphoblastic leukemia (ALL), but dosing strategies aiming at adequate treatment intensity are challenged by interindividual differences in drug disposition. To evaluate genetic factors associated with MTX metabolism, we performed a genome-wide association study in 447 ALL cases from the Nordic Society for Pediatric Haematology and Oncology ALL2008 study, validating results in an independent set of 196 patients. The intergenic single-nucleotide polymorphism rs1382539, located in a regulatory element of DHFR, was associated with increased levels of short-chain MTX polyglutamates (P = 1.1 × 10⁻⁸) related to suppression of enhancer activity, whereas rs35789560 in FPGS (p.R466C, P = 5.6 × 10⁻⁹) was associated with decreased levels of long-chain MTX polyglutamates through reduced catalytic activity. Furthermore, the FPGS variant was linked with increased relapse risk (P = .044). These findings show a genetic basis for interpatient variability in MTX response and could be used to improve future dosing algorithms.
Introduction
Methotrexate (MTX) is a folate analogue widely used as an anticancer and immunosuppressive agent in a variety of clinical settings.1-6 Contemporary maintenance therapy for acute lymphoblastic leukemia (ALL) with weekly MTX and daily 6-mercaptopurine (MP) is critical for achieving long-term complete remission.7-12 MP dose adjustments based on genetic variation in TPMT and NUDT15 during ALL maintenance therapy are examples of genetically guided, individualized cancer therapy.13 However, there are still large interindividual differences in drug response, and MTX and MP doses must be continually adjusted by monitoring the white blood cell (WBC) count to optimize treatment efficacy and avoid severe myelosuppression.14-16 However, many factors remain to be identified, and challenges have to be met in the current WBC count–based MTX dose adjustment. For example, because both MTX and MP can cause bone marrow suppression and the normal WBC count varies among patients, the count itself does not sufficiently inform treatment intensity, and there are no instructions on how each of the 2 drugs contributes to the combined effect. Furthermore, there is no international consensus as to which hematopoietic parameters (eg, WBC count or absolute neutrophil count [ANC]) should be tracked longitudinally during maintenance therapy. The optimal reduction in cell count also remains undetermined.14-19 These factors impede the establishment of a gold standard for MTX and MP dosing adjustment across frontline ALL protocols, and the development of an optimized dosing algorithm is likely to further reduce the relapse rate in patients with ALL.
After entering the cytoplasm, MTX undergoes polyglutamation by folylpolyglutamate synthetase (FPGS), with a glutamate chain length of 1 (MTXpg1, maternal drug) to 6 (MTXpg6).1 Polyglutamation increases intracellular retention of MTX and the affinity for target enzymes in both the folate pathway (eg, dihydrofolate reductase [DHFR] and thymidylate synthase [TYMS]) and the de novo purine synthesis pathway (eg, phosphoribosyl pyrophosphate aminotransferase). These effects result in decreased protein production, impaired DNA formation and repair, and enhancement of the incorporation of metabolites of coadministered MP into DNA, all of which eventually lead to apoptosis.1,20 Therefore, the intracellular level of MTX polyglutamates is a major pharmacologic determinant of both the antileukemic efficacy and the cytotoxicity of this drug,21-23 yet there is a paucity of studies to explain the interindividual variability in MTX disposition during maintenance therapy. Also, we recently showed that erythrocyte MTX polyglutamate levels during maintenance therapy affect the antileukemic efficacy of coadministered MP.24 Hence, we performed a genome-wide association study (GWAS) to discover common genetic variants associated with phenotypic variations in MTX polyglutamate levels during maintenance therapy in the Nordic Society for Pediatric Haematology and Oncology (NOPHO) ALL2008 study, and we investigated the impact of these variants on long-term prognosis.
Methods
Patients and maintenance therapy
This study included 610 children (age, <18 years) and 33 adults (age, 18-45 years) of European ancestry, diagnosed with B-cell precursor or T-cell ALL from 2008 through 2016. All patients were treated in the standard risk (SR; n = 336) or intermediate risk (IR; n = 307) arms of the NOPHO ALL2008 protocol in the Nordic and Baltic countries.25,26 Patients were divided into a discovery cohort consisting of 447 patients diagnosed from 2008 through 2014 and a replication cohort of 196 patients diagnosed from 2008 through 2016. The separation into discovery and replication cohorts was based on when samples were received for analysis from the treating centers. Samples received before October 2016 were genotyped and included in the discovery cohort. Samples collected subsequently were all included in the replication cohort, and, because of some delay in sample and data collection from the treating centers, some patients with earlier diagnoses were included in the replication cohort. Furthermore, to increase statistical power and generalizability of findings, given that children and young adults are both treated on the ALL2008 protocol, we included adult patients in the replication cohort.
All analyzed blood samples were collected during the second phase of maintenance therapy (MT2), which began at protocol week 58 for SR patients and at week 66 for IR patients.24 During MT2, patients received weekly oral MTX, starting at 20 mg/m2 per week, along with daily oral MP, starting at 75, 50, or 5 mg/m2, for patients with wild-type (WT), heterozygous, or deficient TPMT, respectively. MTX and MP doses were continually adjusted to achieve a target WBC count of 1.5-3.0 × 10⁹/L. IR patients received intrathecal (IT) MTX every 8 weeks during MT2, whereas SR patients received no IT therapy; otherwise, the 2 study arms received identical therapy. We included both SR and IR patients, to increase the statistical power and to increase the generalizability of findings. During MT2, peripheral blood samples were routinely collected and sent to University Hospital Rigshospitalet, Copenhagen, for longitudinal MTX metabolite measurements and single nucleotide polymorphism (SNP) profiling.
For this study, patients were selected by the availability of germline DNA and MTX/MP metabolite data. The study was approved by the respective national and institutional review boards, and informed consent was obtained from parents, guardians, or patients, as appropriate.
Quantification and normalization of erythrocyte MTX polyglutamates and leukocyte DNA-TGN
Six different species of erythrocyte MTX polyglutamates (ie, MTXpg1-6) and WBC DNA-thioguanine (DNA-TGN) were quantified by ultrahigh-performance liquid chromatography-tandem mass spectrometry, as described previously.27 MTX polyglutamates or DNA-TGN were normalized with their respective isotope internal standards and hemoglobin or input DNA amount (reported as nanomoles per millimole hemoglobin or femtomole TGN/per microgram DNA, respectively).
Sampling points for MTXpg quantification were scheduled 2 days after oral MTX administration, but some of the samples showed an excessive level of MTXpg1 (native form of the drug), indicating a shorter interval between drug intake and blood sampling. To avoid the interference caused by recent drug intake, we excluded samples with excessive levels of MTXpg1, defined as those in which the sum of MTXpg1-6 exceeded 2.7 × MTXpg2-6 + 2.5, since we have shown that MTX short-chain measurements in samples above this threshold are excessively affected by recently administered MTXpg1.28 For each metabolite, we calculated time-weighted means (prefix wm), weighting each measurement by the time between the previous and the adjacent measurements and allowing for a maximum weight of 7 days (ie, MTXpg measurements were regarded as representing the MTXpg level in the period from 3 days before until 3 days after blood sampling, unless other MTXpg measurements were available within that interval24,28 ). Because each of the wmMTXpg fractions were distributed differently (supplemental Figure 1, available on the Blood Web site), we applied rank normalization to allow for uniform statistical modeling, despite different distributions.
SNP profiling, quality control, and ancestry
DNA from patients in the discovery and replication cohorts was extracted from nucleated cells in peripheral blood and subsequently subjected to SNP profiling by using the Illumina Infinium Omni2.5exome-8-BeadChip.
Genotyping data were filtered by individual and genotype missingness (>0.02), minor allele frequency (<0.01), and Hardy-Weinberg deviation (P < 5.0 × 10⁻⁶). Genetic ancestry was determined by clustering analysis with HapMap reference samples, and individuals >15 standard deviations from the European cluster mean were excluded.29 Linkage disequilibrium of each SNP in the Haploreg dataset was analyzed (https://pubs.broadinstitute.org/mammals/haploreg/haploreg_v1.php).
MTX polyglutamate GWASs
wmMTXpg2 and wmMTXpg4 among the 6 types of MTX polyglutamates were prioritized for further GWASs, based on our previous study on erythrocyte MTX polyglutamate profiling.28 GWASs were then performed to evaluate the correlation between the 2 MTX polyglutamates (ie, wmMTXpg2 and wmMTXpg4) and genotypes at 1 495 495 SNPs in the discovery cohort (n = 447) after quality control. A linear regression was applied with adjustment for sex, risk group, and genetic ancestry, as determined by principal components analyses. GWASs were performed in PLINK 1.90.30
Association of GWAS-identified SNPs with levels of MTX metabolites and prognosis
Candidate variants that reached genome-wide significance (defined as P < 5 × 10⁻⁸) in the discovery GWAS were evaluated for their association with levels of MTX polyglutamates within the replication cohort by applying linear regression and adjusting for sex and risk group (statistical significance was defined as P < .05). In survival analyses, we included an additional 508 patients treated according to the same protocol in the SR and IR arms and genotyped on the same chip, but who were excluded from pharmacological studies because of missing measurements of metabolites. Cumulative incidence of relapse was treated as a time-dependent variable, and its association with the status of GWAS-identified SNPs was evaluated with Gray’s test. Patients were followed from the beginning of MT2 and until the first event or 17 March 2019, whichever came first. For 1 discovered SNP in FPGS that exhibited significant association with relapse risk, we subsequently explored whether the association was affected by DNA-TGN levels. To do this, we included the SNP in our previously published Cox proportional hazards model for risk of relapse, with adjustment for DNA-TGN levels as a time-dependent covariate along with age, sex, and WBC count at diagnosis in a partially overlapping cohort of 918 patients.24 Statistical analyses were performed with R (version 3.3.2; http://www.r-project.org/), unless stated otherwise.
DHFR enhancer activity
To functionally characterize a GWAS-identified SNP (rs1382539 in DHFR), we amplified a 347-bp region encompassing the SNP (ie, Chr5, 79 952 321-79 951 974), using CloneAmp HiFi PCR Premix (Clontech; supplemental Table 1), and then cloned it into the pGL4.23-mini/P vector, including a minimal SV40 promoter upstream of firefly luciferase. The DHFR variant was introduced by site-directed mutagenesis, by using the QuikChange Lightning Site-Directed Mutagenesis Kit (Agilent). The 293T cells were transiently cotransfected with the pGL4.23 reporter construct and pGL-TK Renilla luciferase construct by using Lipofectamine 2000 (Invitrogen). Firefly luciferase activity was measured 24 hours after transfection by the Dual Luciferase Assay Kit (Promega). Results were normalized to Renilla luciferase activity. These experiments were repeated 3 times, and each sample was assayed in triplicate.
Recombinant protein production, purification, and FPGS activity
FPGS cDNA was cloned into the pFastBac expression vector (Thermo Fisher Scientific), and the p.R466C mutation was introduced by using the QuikChange Lightning Site-Directed Mutagenesis Kit (Agilent). Virus particles with the FPGS WT or p.R466C plasmid were transduced into Sf9 insect cells, and pure FPGS proteins were extracted.31 Purified FPGS protein (1.25, 2.5, or 5 ng) was incubated with 0.4 μM of each of the MTX polyglutamate species (ie, MTXpg1-MTXpg6), and 60 μM ATP was added in the reaction buffer (20 mM [pH 8.8] Tris, 20 mM MgCl2, 20 mM KCl, 10 mM NaHCO3, 100 mM 2-mercaptoethanol, 0.5 mg/mL bovine serum albumin, and 5 mM glutamic acid) at 37°C for 10 minutes. Amounts of phosphate representing FPGS activity were quantified by using the Phosphate Sensor Kit (Thermo Fisher Scientific; supplemental Figure 2). Experiments were performed in duplicate.
Results
Patients and distribution of metabolites
A total of 643 children and adults enrolled in the NOPHO ALL2008 protocol in the SR and IR arms were included in the MTX pharmacology study, and 5585 peripheral blood samples (median; 6 samples per patient [range, 1-47]) were collected and quantified during maintenance therapy. Results were not revealed to the treating physician. Distributions of MTX-related metabolites are shown supplemental Figure 1. Patients in the discovery and replication cohorts did not differ markedly in baseline and disease characteristics, except by age, because adults were included in the replication cohort (supplemental Table 2).
Identification and replication of genomic loci associated with MTX polyglutamates
MTX is enzymatically converted to polyglutamate species, which increases intracellular retention and cytotoxic effects. Given that the 6 types of MTX polyglutamates are classified as either short chain (ie, MTXpg1 and MTXpg2) or long chain (ie, MTXpg4-MTXpg6), we selected MTXpg2 and MTXpg4 as representatives of each class for GWAS for the following reasons.28 First, quantification of MTXpg1 can be disturbed by residual plasma MTX, whereas MTXpg2 measurements more accurately reflect its pure metabolite levels. Second, levels of the long-chain metabolites correlate strongly with each other, with MTXpg4 being the most strongly associated with the sum of MTXpg3-6.28 Accordingly, we performed GWASs with MTXpg2 and MTXpg4 as phenotypes of interest.
We first analyzed the association between 1 495 495 SNPs and levels of wmMTXpg2 in 447 patients in the discovery cohort, with adjustment for sex, risk group, and genetic ancestry. We found 6 variants with genome-wide significance at the DHFR locus. The top SNP was rs1382539 (g.3647C>T; P = 1.1 × 10⁻⁸; Figure 1A; supplemental Figure 3A), and it was in strong linkage disequilibrium with 5 other significant SNPs in nearby regions (r2 > 0.8: rs1478834, rs863215, rs1650666, rs1677703, and rs1222809; supplemental Figure 4; supplemental Table 3). In the discovery cohort, there was a significant increase in metabolite levels by genotype at rs1382539, from WT (GG, median, 0.994 [interquartile range (IQR) 0.796-1.229] nmol/mmol Hb) to homozygotes (AA, 1.277 [1.096-1.630] nmol/mmol Hb), with heterozygotes (GA, 1.202 [1.009-1.512] nmol/mmol Hb) exhibiting an intermediate level of wmMTXpg2 (P = 1.1 × 10⁻⁸; Figure 1B). This association was also found in 196 patients in the replication cohort. Median levels of the metabolite were 0.972 (IQR, 0.769-1.195) nmol/mmol Hb, 1.128 (0.935-1.453) nmol/mmol Hb, and 1.265 (1.055-2.075) nmol/mmol Hb in WT, heterozygous, and homozygous individuals, respectively (P = 1.2 × 10⁻⁵. Figure 1B). wmMTXpg2 levels were somewhat lower in the SR patients than in the IR patients (means −0.11 and 0.16, respectively, P = 6.7 × 10⁻⁴), with no interaction between risk group and DHFR rs1382539 genotype (P = .96; supplemental Figure 5).
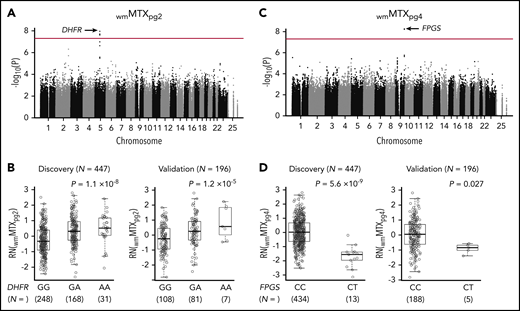
GWASs identified DHFR and FPGS variants associated with MTX polyglutamates. (A) A total of 1 495 495 SNPs were tested for associations with wmMTXpg2 in 447 patients with ALL enrolled in the NOPHO ALL2008 protocol. The association P value is plotted on the y-axis against the respective chromosomal positions of each SNP on the x-axis. The red line indicates genome-wide significance (P = 5 × 10⁻⁸). DHFR loci are shown by the black arrow. (B) An allele at rs1382539 in DHFR was associated with increased levels of wmMTXpg2 in the discovery and validation cohorts. (C) Another GWAS was performed with wmMTXpg4 as the phenotype of interest, and FPGS loci (black arrow) reached genome-wide significance. (D) In the discovery cohort, wmMTXpg4 levels were significantly lower in patients who had the CT genotype at rs35789560 in FPGS than in those with the WT (CC) genotype. This trend was also confirmed in the validation cohort. (B,D) P values were estimated by linear regression, with adjustment for sex and risk group. Each box includes data between the 25th and 75th percentiles, with the horizontal line indicating the median. RN, rank normalized.
GWASs identified DHFR and FPGS variants associated with MTX polyglutamates. (A) A total of 1 495 495 SNPs were tested for associations with wmMTXpg2 in 447 patients with ALL enrolled in the NOPHO ALL2008 protocol. The association P value is plotted on the y-axis against the respective chromosomal positions of each SNP on the x-axis. The red line indicates genome-wide significance (P = 5 × 10⁻⁸). DHFR loci are shown by the black arrow. (B) An allele at rs1382539 in DHFR was associated with increased levels of wmMTXpg2 in the discovery and validation cohorts. (C) Another GWAS was performed with wmMTXpg4 as the phenotype of interest, and FPGS loci (black arrow) reached genome-wide significance. (D) In the discovery cohort, wmMTXpg4 levels were significantly lower in patients who had the CT genotype at rs35789560 in FPGS than in those with the WT (CC) genotype. This trend was also confirmed in the validation cohort. (B,D) P values were estimated by linear regression, with adjustment for sex and risk group. Each box includes data between the 25th and 75th percentiles, with the horizontal line indicating the median. RN, rank normalized.
Our second GWAS, which focused on the metabolite wmMTXpg4, discovered a genome-wide significant missense variant at rs35789560 in FPGS (c. 1396C>T; P = 5.6 × 10⁻⁹; Figure 1C; supplemental Figures 3B and 6; supplemental Table 4). This variant affects the Arg466 residue and causes an Arg→Cys change (p.R466C). In the discovery cohort, levels of wmMTXpg4 in patients carrying the CT genotype at rs35789560 were substantially lower than in those with the WT genotype (median 0.952 [IQR, 0.7067-1.114] nmol/mmol Hb vs 1.084 [0.898-1.346] nmol/mmol Hb; P = 5.6 × 10⁻⁹; Figure 1D), which was also confirmed in the replication cohort (P = .027; Figure 1D). Patients with a CT genotype at rs35789560 had significantly lower levels of all other MTXpg subsets, except MTXpg1 (supplemental Figure 7), and a decreased ratio of wmMTXpg6/wmMTXpg2 than did WT patients (supplemental Figure 8). wmMTXpg4 levels were higher in SR patients than in IR patients (means, 0.23 vs −0.27, respectively; P = 3.6 × 10⁻¹⁰) with no interaction between risk group and FPGS rs35789560 genotype (P = .78; supplemental Figure 9). Minor allele frequencies of each top hit in DHFR and FPGS in our cohorts were 25.3% and 1.4%, respectively. A survey of a publically available database for germline variants (gnomAD; n = 141 456) revealed a distribution pattern consistent with that of our cohorts, but allele frequencies of these 2 SNPs varied substantially by ancestry (supplemental Table 5).
Functional characterization of GWAS-identified polymorphisms
We next examined the functional consequences of GWAS-identified DHFR and FPGS variants. Because rs1382539 is located within a regulatory element of the DHFR locus (supplemental Figure 10), we characterized enhancer activity of the WT and variant (Figure 2A). Direct measurement of luciferase intensity in 293T cells showed that the variant had significantly lower enhancer activity than did WT DHFR (57% reduction; P < .05), suggesting that the intergenic rs1392539 variant in DHFR can affect MTX metabolism by robust suppression of enhancer activity.
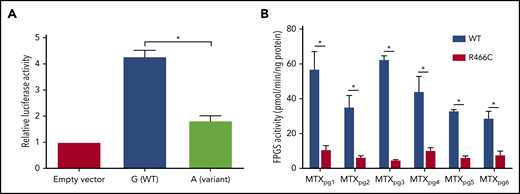
Functional characterization of DHFR and FPGS. (A) The luciferase reporter assay confirmed that enhancer activity of DHFR was negatively influenced by the nucleotide substitution from G (WT) to A (rs1382539) in 293T cells. Bars represent means from 3 triplicate experiments, and T bars indicate standard deviations. (B) WT or variant FPGS R466C protein (5 ng/reaction) was studied by the polyglutamation assay, using the Phosphate Sensor Kit with MTXpg1-6 as a substrate. The error bar shows the mean ± standard deviation. *P < .05 (Student t test).
Functional characterization of DHFR and FPGS. (A) The luciferase reporter assay confirmed that enhancer activity of DHFR was negatively influenced by the nucleotide substitution from G (WT) to A (rs1382539) in 293T cells. Bars represent means from 3 triplicate experiments, and T bars indicate standard deviations. (B) WT or variant FPGS R466C protein (5 ng/reaction) was studied by the polyglutamation assay, using the Phosphate Sensor Kit with MTXpg1-6 as a substrate. The error bar shows the mean ± standard deviation. *P < .05 (Student t test).
Because rs35789560 in FPGS encodes a missense variant (p.R466C), we characterized FPGS activity for WT and variant proteins against each of the MTX polyglutamate species (Figure 2B). Both WT and variant FPGS exhibited catalytic activity against all 6 metabolites, but the p.R466C protein showed significantly lower enzymatic activity across all substrates (P < .05). WT activity was 57.3 ± 9.8, 35.5 ± 6.4, 62.8 ± 1.8, 44.5 ± 8.4, 33.3 ± 0.4, and 29.2 ± 3.6 pmol/min per nanogram protein, and R466C protein was 11.1 ± 2.0, 6.7 ± 0.6, 5.1 ± 0.02, 10.6 ± 1.3, 6.6 ± 0.6, and 8.1 ± 1.9 pmol/min per nanogram protein for MTXpg1, MTXpg2, MTXpg3, MTXpg4, MTXpg5, and MTXpg6, respectively. Similar differences in FPGS activity between WT and variant proteins were seen at an even lower protein concentration (1.25 and 2.5 ng/reaction, respectively; supplemental Figure 11). These results indicate that damaging effects of the missense variant of rs35789560 in FPGS are not restricted to MTXpg4, as identified by the discovery GWAS, but extend to the entire MTX species. Thus, this polymorphism is likely to globally impair intracellular accumulation of long-chain MTXpg metabolites.
Association of GWAS-identified SNPs with relapse risk
Because levels of MTX polyglutamates are linked directly with antileukemic efficacy, we next sought to evaluate whether DHFR- and FPGS-mediated MTX disposition during MT2 is associated with long-term prognosis in patients with ALL.
After a median follow-up of 4.6 years from the start of MT2 in 1129 patients for whom genotype and survival data were available, we identified 76 events, including 70 relapses at a median of 1.9 years from the beginning of MT2 and 6 secondary malignancies at a median of 0.99 years from the beginning of MT2. For patients with rs35789560 in FPGS, the 6-year cumulative incidence of relapse was 15.8% in heterozygotes compared with 7.0% in homozygotes (P = .044; Figure 3). When analyzed with relapse-specific Cox regression, the FPGS rs35789560 genotype was also shown to be significantly associated with relapse risk in univariate analyses (P = .047; supplemental Table 6). In a multivariate model with adjustment for sex, risk group, and immunophenotype, FPGS rs35789560 had a similar effect, but with a P value slightly above the significance threshold (P = .068; supplemental Table 6). The 6-year probability of event-free survival in the CC genotype group was 92.3% compared with 84.2% in the CT group (P = .076; supplemental Figure 12). There was no difference in overall survival between the CC and CT FPGS rs35789560 genotype groups (98% and 97%, respectively, P = .78; supplemental Figure 13). In an analysis of the subset of patients with the FPGS rs35789560 WT genotype and available metabolite data (n = 562; 29 relapses), patients with low levels of wmMTXpg4 (defined as <−1.0) did not have a significantly increased cumulative incidence of relapse vs higher levels (7.8% vs 5.3%; P = .58; supplemental Figure 14). Of the 918 patients included in our previously published Cox model of relapse risk, with adjustment for DNA-TGN levels, age, sex, and WBC count at diagnosis,24 genotype data were available for 757. When these data were incorporated into this model, the FPGS rs35789560 genotype remained significantly associated with relapse risk (relapse-specific hazard ratio for the CT genotype, 3.1 [95% confidence interval, 1.2-8.0; P = .017]; supplemental Table 7). In contrast, the cumulative incidence of relapse based on rs1478834 in DHFR was 6.5%, 9.4%, and 3.9% for the GG, GA, and AA genotypes, respectively, and was not statistically significant by Gray’s test (P = .18).
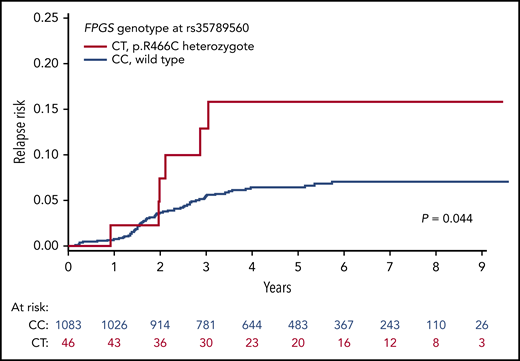
rs35789560 in FPGS is associated with elevated cumulative incidence of relapse. The cumulative incidence of relapse was higher in patients carrying the CT genotype (red) at rs35789560 in FPGS than in those with the CC genotype (blue). P value was calculated by Gray’s test.
rs35789560 in FPGS is associated with elevated cumulative incidence of relapse. The cumulative incidence of relapse was higher in patients carrying the CT genotype (red) at rs35789560 in FPGS than in those with the CC genotype (blue). P value was calculated by Gray’s test.
Discussion
In this study, we used a systematic approach to evaluate germline SNPs for their association with MTX metabolite profiles during maintenance therapy in patients with ALL. We found that SNPs in DHFR (eg, rs1382539) and FPGS (eg, rs35789560) had different effects on the formation of intracellular active metabolites of MTX. There was a positive correlation between the number of copies of the A allele at the DHFR SNP rs1382539 and MTXpg2 levels, suggesting a gene dose effect. Furthermore, MTXpg4 levels in patients heterozygous for FPGS SNP rs35789560 were significantly lower than those with the WT genotype.
In the present study, as in most contemporary ALL treatment protocols, adjustment of MTX and MP doses was guided by WBC count and ANC, which serve as proxy markers of the joint effects of the 2 drugs.14 Although the doses of MTX and MP were usually adjusted together, this coadjustment did not separately capture the individual efficacy of each drug. In fact, because patients with the variant allele of rs35789560 SNP in FPGS were exposed to lower levels of active MTX metabolites (ie, long-chain MTX polyglutamates) and, more important, had an increased risk of relapse compared with WT patients, we hypothesize that these patients were suboptimally treated and would likely benefit from increased MTX doses relative to MP doses, to improve the long-term prognosis in those with the FPGS variant. These findings indicate that direct measurements of drug metabolites in this study would enable further individualization of maintenance therapy. More recently, many studies have reported that the MP dose should be tailored on the basis of the individual genetic make-up of TPMT and NUDT15. In these pharmacogenetics-driven approaches, the MP dose is adjusted to normalize patients’ exposure to its active metabolites (ie, TGN nucleotide and DNA-TGN, respectively), to reduce its toxicity without impairing antileukemic efficacy.13,32-35 Similarly, our findings highlight the potential of integrating FPGS variants into the conventional MTX dosing strategy to improve treatment outcome in patients with ALL. The MTX dose may be individualized in patients carrying the T allele in FPGS, so that their exposure to MTXpg4 would be equivalent to those who have the WT genotype, as proved in MP dosing algorithms for patients with TPMT and NUDT15 variants.
However, there are several limitations that should be addressed for clinical implementation of this approach in future treatment protocols. First, our prognosis analysis included a limited number of relapse events in variant cases (15.2%; 7 of 46). More clinical validation studies or FPGS-related leukemia-bearing murine models comparing the long-term prognosis of patients treated with the conventional dosing method with those treated by using the metabolite/genotype-informed dosing algorithm are warranted to confirm the negative impact of this variant on long-term prognosis. Even after the confirmation of the potential effectiveness of the new approach, the exact dose, based on FPGS genotype, will remain unclear. We also found that IR patients had higher levels of MTXpg2, but lower levels of MTXpg4, compared with SR patients, potentially explained by the slight difference in treatment regimen in IR and SR patients (ie, the presence of every-8-week IT MTX in the former or the absence of IT therapy in the latter). Therefore, studies investigating the dynamics of MTXpg metabolism integrating systemic genetic determinants with the comprehensive knowledge of nongenetic factors in the different FPGS genotype groups are necessary to design optimal dosing regimens. Finally, although MTX dose was not significantly associated with risk of relapse in a previous study17 and MTX-mediated toxicity in the current report was continuously monitored to stay in the target range of WBC count after the protocol recommendation, our efficacy-oriented findings should be discussed in future studies along with the information of WBC measurements, MTX dose adjustments, MTX-related toxicities, and prophylactic treatment with sulfamethoxazole and trimethoprim (potentially inducing less tolerance to MTX36 ) during maintenance therapy.
The second SNP with a genome-wide significance (rs1382539) is immediately upstream in the DHFR gene and is also located within the first intron of the MSH3 gene. This GWAS-identified SNP is reported to be an expression quantitative trait locus for both genes in the publicly available GTEx dataset (P values and normalized effect sizes are 5.4 × 10−100 and −0.67 and 5.3 × 10⁻³¹ and −0.39 for DHFR or MSH3, respectively, with whole blood as an example). Although these results suggest potential regulatory effects of the SNP on both DHFR and MSH3, the former is most likely the causal gene underlying the association signal at this locus because of its known role in folate and MTX metabolisms.1 The enzyme DHFR is key in folate metabolism and is consequently responsible for de novo purine synthesis and DNA precursor synthesis. DHFR is strongly inhibited by MTX polyglutamates, which results in perturbation of DNA formation and protein synthesis and, eventually, cell apoptosis. Several studies have reported that SNPs linked with higher DHFR expression are associated with worse overall survival in ALL, partly because of the increased competitive inhibition of DHFR against MTXpg and of decreased intracellular accumulation of active MTX metabolites.37-39 In contrast, the novel SNP (rs1382539) in DHFR, which had the strongest signal in our GWAS, is the first to be reported to be associated with elevated levels of the active MTX metabolite MTXpg2, compared with the WT G allele.
However, it is important to discuss why the DHFR genotype did not affect event-free survival, despite its association with MTXpg2 levels. First, short-chain MTX polyglutamates are less potent than long-chain ones,40,41 and the difference in MTXpg2 levels observed across DHFR genotypes may not be quantitatively adequate to affect the relapse rate of ALL in patients in our cohort. Second, the A allele in DHFR at rs1382539 correlated positively with MTXpg2 levels and could thus theoretically confer a better prognosis than the WT genotype. However, the overall relapse rate in NOPHO ALL2008 was only 7%, and potential benefits from the elevation of MTXpg2 levels along with the DHFR variant may be too small to further improve event-free survival. That said, additional studies with larger samples size are warranted to further assess the association of differences in active MTX metabolites by DHFR genotypes with long-term prognosis.
In summary, our comprehensive genome-wide analyses of the genetic basis of MTX metabolism in ALL during maintenance therapy revealed significant effects of genetic DHFR and FPGS variants on interpatient variability in MTX response and calls for a randomized clinical trial to determine whether genotype-based individualized MTX therapy can improve cure rates.
For access to the original data, please contact the corresponding author.
The online version of this article contains a data supplement.
The publication costs of this article were defrayed in part by page charge payment. Therefore, and solely to indicate this fact, this article is hereby marked “advertisement” in accordance with 18 USC section 1734.
Acknowledgments
The authors thank all Nordic and Baltic Paediatric Oncology Centers for providing clinical data and blood samples for metabolite profiling and genotyping.
This work was supported by The Danish Cancer Society (K.S.), The Danish Childhood Cancer Foundation (K.S. and R.G.), The Swedish Childhood Cancer Foundation (K.S. and R.G.), The Nordic Cancer Union, The Otto Christensen Foundation, University Hospital Rigshospitalet, The Novo Nordic Foundation (all K.S.), the National Institutes of Health, National Institute of General Medical Sciences (grants R01GM118578 and P50GM115279), and Alex’s Lemonade Stand Foundation (T.M.)
Authorship
Contribution: M.T. and T.M. drafted the manuscript; M.T. compiled patient, pharmacologic and genetic data and handled bioinformatics analyses with M.G., S.N.N., R.L.N., B.O.W., and R.G.; M.T. and K.G. handled the statistical analyses; T.M., C.J., H.Z., and J.J.Y. conducted and supervised the functional characterization studies; J.A., L.L.H., Ó.G.J., J.K., B.L., U.O., P.Q.-P., K.P., G.V., and K.S. developed the NOPHO study protocol and coordinated the national blood sample and data collection for each country; J.N. supervised all pharmacological analyses; K.S. initiated and supervised the study, was the principal investigator for the study and the NOPHO ALL2008 protocol, and had responsibility for the final submission for publication; and all authors approved the final manuscript.
Conflict-of-interest disclosure: The authors declare no competing financial interests.
Correspondence: Kjeld Schmiegelow, Department of Pediatrics and Adolescent Medicine, University Hospital Rigshospitalet, Blegdamsvej 9, 2100 Copenhagen, Denmark; e-mail: kschmiegelow@rh.dk.

This feature is available to Subscribers Only
Sign In or Create an Account Close Modal