

Key Points
Calr deficiency induces reduction of erythropoiesis in the bone marrow and extramedullary hematopoiesis in the spleen.
CALR haploinsufficiency restores the self-renewal capacity of HSCs damaged by CALR del52 and is required for the development of MPN.

Abstract
Mutations in JAK2, myeloproliferative leukemia virus (MPL), or calreticulin (CALR) occur in hematopoietic stem cells (HSCs) and are detected in more than 80% of patients with myeloproliferative neoplasms (MPNs). They are thought to play a driver role in MPN pathogenesis via autosomal activation of the JAK-STAT signaling cascade. Mutant CALR binds to MPL, activates downstream MPL signaling cascades, and induces essential thrombocythemia in mice. However, embryonic lethality of Calr-deficient mice precludes determination of a role for CALR in hematopoiesis. To clarify the role of CALR in normal hematopoiesis and MPN pathogenesis, we generated hematopoietic cell-specific Calr-deficient mice. CALR deficiency had little effect on the leukocyte count, hemoglobin levels, or platelet count in peripheral blood. However, Calr-deficient mice showed some hematopoietic properties of MPN, including decreased erythropoiesis and increased myeloid progenitor cells in the bone marrow and extramedullary hematopoiesis in the spleen. Transplantation experiments revealed that Calr haploinsufficiency promoted the self-renewal capacity of HSCs. We generated CALRdel52 mutant transgenic mice with Calr haploinsufficiency as a model that mimics human MPN patients and found that Calr haploinsufficiency restored the self-renewal capacity of HSCs damaged by CALR mutations. Only recipient mice transplanted with Lineage−Sca1+c-kit+ cells harboring both CALR mutation and Calr haploinsufficiency developed MPN in competitive conditions, showing that CALR haploinsufficiency was necessary for the onset of CALR-mutated MPNs.
Introduction
Myeloproliferative neoplasms (MPNs) are chronic hematological malignancies that arise in hematopoietic stem cells (HSCs) and are characterized by autonomous growth of 1 or more lineages of hematopoietic cells.1 Polycythemia vera, essential thrombocythemia (ET), and primary myelofibrosis (PMF) are the 3 major diseases categorized as MPNs. The V617F mutation in JAK2 is detected in the most polycythemia vera patients and approximately half of patients with ET or PMF.2-6 Mutations in the myeloproliferative leukemia virus (MPL) or calreticulin (CALR) genes are detected in 5% to 10% and 25% to 30% of patients with ET or PMF, respectively.7-10 Many types of CALR mutations have been reported. The most frequent is deletion 52 (CALRdel52), followed by insertion 5.9-11 All types of CALR mutations occur in exon 9 and cause a frameshift that results in newly synthesized C-terminal peptides. Mutant CALR binds to MPL and activates downstream MPL signaling cascades.12,13 CALR mutant mice develop ET, which is characterized by an increased number of platelets in peripheral blood (PB) and megakaryocytes in bone marrow (BM).12,14-17
Deficiency in JAK2 or MPL drastically abrogates hematopoiesis, and mutations in these genes are thought to play a driver role in MPN.3,5,8-10,18 Erythropoiesis is defective in embryonic liver from Jak2-deficient mice, and severe thrombocytopenia is observed in Mpl-deficient mice.19-21 In contrast, CALR function in hematopoiesis remains unknown. Calr-deficient mice are embryonic lethal because of a defect in the cardiovascular wall,22 precluding determination of an effect on hematopoiesis. We attempted to clarify the role of CALR function both in normal hematopoiesis and in MPN pathogenesis using hematopoietic system-specific Calr-deficient mice.
Methods
Mouse models
Mice carrying a floxed allele that targets exons 4 to 7 of Calr (Calrf/+ mice) (RBRC02234) and Calr heterozygous knockout mice (Calr+/− mice; RBRC02233) were provided by Masahito Ikawa (Osaka University, Japan) via the RIKEN Bioresource Center (Ibaraki, Japan).23 Mx1-cre transgenic mice (nbio227) were derived from the MGC Foundation (Munich, Germany) via the National Institute of Biomedical Innovation (Osaka, Japan).24 CALRdel52 transgenic mice were generated earlier.16 B6-CD45.1 mice were purchased from Sankyo Laboratory Service (Tsukuba, Japan). Deletion of floxed alleles was induced by intraperitoneal injection of 400 μg polyinosinic-polycytidylic acid (Sigma-Aldrich, St. Louis, MO) 6 times every other day in 4-week-old mice. Mice were analyzed at 4 to 6 months of age, and an equal number of male and female mice were used. All procedures were approved by the Local University of Miyazaki Ethics Committee.
Transplantation assays
For competitive repopulation assays, test cells [1 × 10⁶ unpurified BM cells (BMs) or sorted 1 × 10³ lineage−Sca1+c-kit+ cells (LSKs)] (B6-CD45.2) and 1 × 10⁶ unpurified wild-type (WT) BM competitor cells (B6-CD45.1/45.2 or B6-CD45.1) were transplanted into 8-week-old B6-CD45.1 recipients irradiated with a dose of 9 Gy. For serial transplantation, at 16 weeks after the first transplantation, BMs from primary transplant recipients were transplanted into irradiated secondary WT recipients (B6-CD45.1, 1 × 10⁶ cells per mouse). The mice that were not used for serial transplantation continued to be observed.
Histologic examinations
Tissue samples were fixed in paraformaldehyde, paraffin-embedded, and sectioned for hematoxylin and eosin staining according to standard protocols. The number of megakaryocytes in the BM was counted per 10 high-power fields by a pathologist who was blinded to the genotype of the mice.
Gene expression profiling
LSKs (2 × 10⁴ per mouse) were isolated from BM of mouse recipients of Mx1-cre;Calr+/+ (n = 4), Mx1-cre;Calrf/− (n = 4), WT (n = 3), Calr+/− (n = 3), CALRdel52;Calr+/+ (n = 4), or CALRdel52;Calr+/− (n = 4) cells. Total RNA was extracted using Isogen (Nippon Gene), and cDNA was synthesized using the SMARTer Pico PCR cDNA Synthesis Kit (Clontech). Double-stranded cDNA was fragmented, and cDNA libraries were generated using the KAPA HyperPlus Library Preparation Kit (KAPA Biosystems) and FastGene Adaptor Kit (FastGene). Sequencing was performed using NextSeq500 (Illumina) with a single-read sequencing length of 76 bp. Kallisto (version 0.43.1) was used for read counts and calculation of transcripts per million. EdgeR was used for statistical analysis. Heatmap.2 was used for hierarchical clustering with the heatmap.
Statistical analysis
Results are presented as the mean ± standard error of the mean (SEM). To assess the statistical significance of differences between 2 groups, a 2-tailed Student t test was used. To assess the difference among 3 groups, 1-way analysis of variance (ANOVA) followed by the Tukey-Kramer test was used. For comparison of hematologic values over time, ANOVA with repeated measures was used. Statistical analysis of differences in survival was performed with the log-rank test.
Results
CALR deficiency induces extramedullary hematopoiesis
We first crossed Mx1-cre transgenic mice with Calr+/− mice and generated Mx1-cre;Calr+/− mice. Next, we crossed Mx1-cre;Calr+/− mice with mice carrying a floxed allele targeting exons 4 to 7 of Calr (Calrf/+ mice) and obtained mice with 3 genotypes; Mx1-cre;Calr+/+, Mx1-cre;Calr+/−, and Mx1-cre;Calrf/−. Neither Calr mRNA nor CALR protein was detected in BMs from Mx1-cre;Calrf/− mice (supplemental Figure 1, available on the Blood Web site). No differences were found in the PB leukocyte count, hemoglobin levels, or platelet count between Mx1-cre;Calrf/− and Mx1-cre;Calr+/+ mice (Figure 1A). The proportions of myeloid lineage, B cells, and T cells in PB among the 3 groups were almost equal (Figure 1B). The cellularity and the megakaryocyte number in BM were comparable between Mx1-cre;Calrf/− and Mx1-cre;Calr+/+ mice (data not shown). Megakaryocytes were fully mature in both groups, and no morphological difference was seen between them (Figure 1C).
![Hematopoietic phenotype of Calr-deficient mice. (A) Average complete blood cell counts (n = 30 in each group). (B) Hematopoietic compartment of PB assessed with flow cytometry. At 16 weeks of age, the proportion of myeloid cells (Mac1+ or Gr1+), B cells (B220+), and T cells (CD3+) was comparable among the 3 groups. (C) Histology of BM. Mouse BM was stained with hematoxylin and eosin at 6 months of age. (D) Macroscopic findings of a femur and a BM cell pellet taken from a mouse of each genotype. (E) Proportions of myeloid cells (Mac1 or Gr1), T cells (CD3+), B cells (B220+), erythroid cells (CD71+ and Ter119+), and megakaryocytes (CD41+) in BM. In BM cells from Mx1-cre;Calrf/− mice (n = 13), erythroid cells decreased significantly to less than half compared with BM cells from Mx1-cre;Calr+/+ mice (n = 8) or Mx1-cre;Calr+/− mice (n = 9) (top). No significant difference was found in the other fractions. Proportions of HSCs and progenitors in BM (bottom). Compared with Mx1-cre;Calr+/+ mice, Mx1-cre;Calrf/− mice showed increased frequencies of MPPs and GMPs. No differences were found in the frequencies of any progenitors (LT-HSCs, short-term-HSCs, LSK cells, common myeloid progenitors, erythromegakaryocyte progenitors ([MEPs]MEP), and megakaryocyte progenitors [MKPs]), between Mx1-cre;Calr+/− mice and Mx1-cre;Calr+/+ mice. (F) Number of hematopoietic colonies from BM cells. BM cells (2 × 10⁴) were used for burst-forming unit-erythroids (BFU-Es), CFU-GM, and CFU-granulocyte, erythrocyte, monocyte, and megakaryocyte (CFU-GEMM) colonies. BM (1 × 10⁵) cells were used for CFU-E colonies. The number of CFU-GM was significantly higher in Mx1-cre;Calrf/− mice (n = 12) than in Mx1-cre;Calr+/+ mice (n = 9). The number of CFU-E was significantly lower in Mx1-cre;Calrf/− mice than in Mx1-cre;Calr+/+ mice and Mx1-cre;Calr+/− mice (n = 10). All data are presented as the means ± SEM. To assess statistical significance among groups, 1-way ANOVA followed by the Tukey-Kramer test was used. (G) MPO mRNA and protein expression. (left) Real-time PCR analysis of Mpo (left; n = 3 in each group). Mac1+/Gr1+ bone marrow (BM) cells were analyzed for levels of MPO expression with flow cytometry (right). One representative experiment of 3 is shown. *P < .05; **P < .01; n.s., not significant.](https://ash.silverchair-cdn.com/ash/content_public/journal/blood/136/1/10.1182_blood.2019003358/4/m_bloodbld2019003358f1.png?Expires=1769108512&Signature=Wt3bCoQp5HoVech9tuY0l8TLRtQ49DdNVCoo9ejBoa4Tr4fNpF3VXMckuFh7Fxxbj7cEIGhpp1INyxhymUsEmx0wRvcuaX0gUi-LzVyCY9igWjXLG2raSxwnU27s-QQU60F7LFePQnL1N2Z45PrkMbCmkBRbs37IAHCWMVgYxw73i9qLUL6m9hcHfjgVwDK08oHmtJLdv8wv0bT3V0FXWtCOUlcLunUkuxQWdtvM092mYqWGO-zTGj35BqITfm4euGmXszFa7FdzURf5h9wP-ElD6hJxbTlXYowlao4HCZncLCDKutikJFpRhIhNVdl7aMN77zKz8FxJpDfmIaXc~g__&Key-Pair-Id=APKAIE5G5CRDK6RD3PGA)
Hematopoietic phenotype of Calr-deficient mice. (A) Average complete blood cell counts (n = 30 in each group). (B) Hematopoietic compartment of PB assessed with flow cytometry. At 16 weeks of age, the proportion of myeloid cells (Mac1+ or Gr1+), B cells (B220+), and T cells (CD3+) was comparable among the 3 groups. (C) Histology of BM. Mouse BM was stained with hematoxylin and eosin at 6 months of age. (D) Macroscopic findings of a femur and a BM cell pellet taken from a mouse of each genotype. (E) Proportions of myeloid cells (Mac1 or Gr1), T cells (CD3+), B cells (B220+), erythroid cells (CD71+ and Ter119+), and megakaryocytes (CD41+) in BM. In BM cells from Mx1-cre;Calrf/− mice (n = 13), erythroid cells decreased significantly to less than half compared with BM cells from Mx1-cre;Calr+/+ mice (n = 8) or Mx1-cre;Calr+/− mice (n = 9) (top). No significant difference was found in the other fractions. Proportions of HSCs and progenitors in BM (bottom). Compared with Mx1-cre;Calr+/+ mice, Mx1-cre;Calrf/− mice showed increased frequencies of MPPs and GMPs. No differences were found in the frequencies of any progenitors (LT-HSCs, short-term-HSCs, LSK cells, common myeloid progenitors, erythromegakaryocyte progenitors ([MEPs]MEP), and megakaryocyte progenitors [MKPs]), between Mx1-cre;Calr+/− mice and Mx1-cre;Calr+/+ mice. (F) Number of hematopoietic colonies from BM cells. BM cells (2 × 10⁴) were used for burst-forming unit-erythroids (BFU-Es), CFU-GM, and CFU-granulocyte, erythrocyte, monocyte, and megakaryocyte (CFU-GEMM) colonies. BM (1 × 10⁵) cells were used for CFU-E colonies. The number of CFU-GM was significantly higher in Mx1-cre;Calrf/− mice (n = 12) than in Mx1-cre;Calr+/+ mice (n = 9). The number of CFU-E was significantly lower in Mx1-cre;Calrf/− mice than in Mx1-cre;Calr+/+ mice and Mx1-cre;Calr+/− mice (n = 10). All data are presented as the means ± SEM. To assess statistical significance among groups, 1-way ANOVA followed by the Tukey-Kramer test was used. (G) MPO mRNA and protein expression. (left) Real-time PCR analysis of Mpo (left; n = 3 in each group). Mac1+/Gr1+ bone marrow (BM) cells were analyzed for levels of MPO expression with flow cytometry (right). One representative experiment of 3 is shown. *P < .05; **P < .01; n.s., not significant.
Hematopoietic phenotype of Calr-deficient mice. (A) Average complete blood cell counts (n = 30 in each group). (B) Hematopoietic compartment of PB assessed with flow cytometry. At 16 weeks of age, the proportion of myeloid cells (Mac1+ or Gr1+), B cells (B220+), and T cells (CD3+) was comparable among the 3 groups. (C) Histology of BM. Mouse BM was stained with hematoxylin and eosin at 6 months of age. (D) Macroscopic findings of a femur and a BM cell pellet taken from a mouse of each genotype. (E) Proportions of myeloid cells (Mac1 or Gr1), T cells (CD3+), B cells (B220+), erythroid cells (CD71+ and Ter119+), and megakaryocytes (CD41+) in BM. In BM cells from Mx1-cre;Calrf/− mice (n = 13), erythroid cells decreased significantly to less than half compared with BM cells from Mx1-cre;Calr+/+ mice (n = 8) or Mx1-cre;Calr+/− mice (n = 9) (top). No significant difference was found in the other fractions. Proportions of HSCs and progenitors in BM (bottom). Compared with Mx1-cre;Calr+/+ mice, Mx1-cre;Calrf/− mice showed increased frequencies of MPPs and GMPs. No differences were found in the frequencies of any progenitors (LT-HSCs, short-term-HSCs, LSK cells, common myeloid progenitors, erythromegakaryocyte progenitors ([MEPs]MEP), and megakaryocyte progenitors [MKPs]), between Mx1-cre;Calr+/− mice and Mx1-cre;Calr+/+ mice. (F) Number of hematopoietic colonies from BM cells. BM cells (2 × 10⁴) were used for burst-forming unit-erythroids (BFU-Es), CFU-GM, and CFU-granulocyte, erythrocyte, monocyte, and megakaryocyte (CFU-GEMM) colonies. BM (1 × 10⁵) cells were used for CFU-E colonies. The number of CFU-GM was significantly higher in Mx1-cre;Calrf/− mice (n = 12) than in Mx1-cre;Calr+/+ mice (n = 9). The number of CFU-E was significantly lower in Mx1-cre;Calrf/− mice than in Mx1-cre;Calr+/+ mice and Mx1-cre;Calr+/− mice (n = 10). All data are presented as the means ± SEM. To assess statistical significance among groups, 1-way ANOVA followed by the Tukey-Kramer test was used. (G) MPO mRNA and protein expression. (left) Real-time PCR analysis of Mpo (left; n = 3 in each group). Mac1+/Gr1+ bone marrow (BM) cells were analyzed for levels of MPO expression with flow cytometry (right). One representative experiment of 3 is shown. *P < .05; **P < .01; n.s., not significant.
The femur and the BM cell pellet from Mx1-cre;Calrf/− mice appeared anemic (Figure 1D). Consistently, the proportion of CD71+ and Ter119+ erythroid cells and the number of colony-forming unit erythroids (CFU-Es) were lower in Mx1-cre;Calrf/− BMs compared with the other 2 genotypes of BMs (Figure 1E-F). On the other hand, no difference was found in other mature cells in BM, such as Mac1+ or Gr1+ myeloid cells, CD3+ T cells, B220+ B cells, or CD41+ megakaryocytes. As for HSCs and progenitors, Mx1-cre;Calrf/− mice exhibited a higher proportion of multipotent progenitors (MPPs) and granulocyte-macrophage progenitors (GMPs) compared with the other 2 genotypes of mice (Figure 1E). Accordingly, CFU granulocyte-macrophages (CFU-GMs) also increased in Mx1-cre;Calrf/− mice in the colony assay of BMs (Figure 1F). We found no difference in other progenitor compartments, including long- and short-term HSCs among the 3 groups.
Mutant CALR proteins may have lost some of the functions of the WT CALR protein. Homozygous CALR mutations in MF patients have been reported to result in acquired myeloperoxidase (MPO) deficiency.25 We compared the expression of MPO in BM Mac1+/Gr1+ cells of the 3 aforementioned genotypes of mice. As shown in Figure 1G, the expression levels of Mpo mRNA were greater in Mac1+/Gr1+ cells of Mx1-cre;Calrf/− mice compared with Mx1-cre;Calr+/+ mice; however, MPO protein was absent in Mx1-cre;Calrf/− cells.
In contrast to the minor effect of CALR deficiency on BM and PB cells, CALR deficiency led to splenomegaly and EMH in the spleen. The spleen weight in Mx1-cre;Calrf/− mice was approximately twofold heavier than that in Mx1-cre;Calr+/+ mice (Figure 2A). In spleens from Mx1-cre;Calrf/− mice, the border between the white and red pulp was obscured (Figure 2B). Megakaryocytes and maturing myeloid cells had markedly infiltrated the red pulp. In spleens from Mx1-cre;Calrf/− mice, Mac1+ or Gr1+ mature myeloid cells, CD71+/Ter119+ erythroid cells, and CD41+ megakaryocytes increased significantly compared with those from the other 2 genotypes of mice (Figure 2C). HSCs and most types of myeloid progenitors increased in the spleen. The colony assay also revealed an increased number of progenitor cells in the spleen from Mx1-cre;Calrf/− mice (Figure 2D). Hematopoiesis in the spleen may compensate for the reduced erythropoiesis in the BM, as no anemia was seen in Calr-deficient mice.
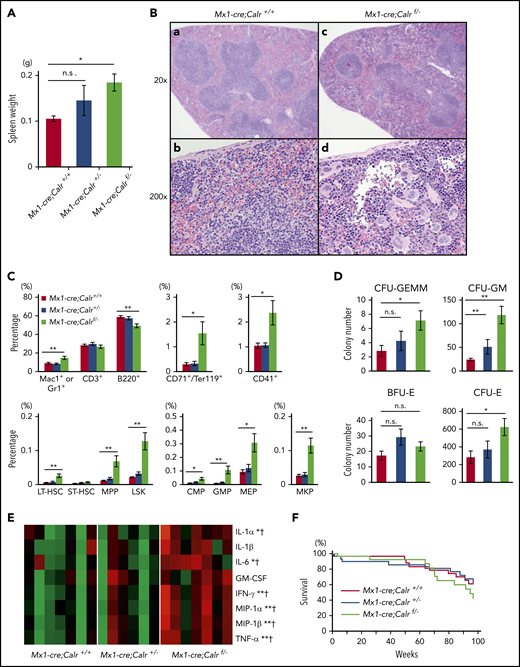
Extramedullary hematopoiesis in the spleen of Calr-deficient mice. (A) Spleen weight of 4- to 6-month-old mice. Mx1-cre;Calrf/− mice (n = 13) exhibited splenomegaly compared with Mx1-cre;Calr+/+ mice (n = 9). On the other hand, no difference was found between Mx1-cre;Calr+/− mice (n = 10) and Mx1-cre;Calr+/+ mice. (B) Histology of the spleen. The spleen was stained with hematoxylin and eosin at 6 months of age. (Ba,c) The margin of white pulp is obscured in Mx1-cre;Calrf/− mice compared with Mx1-cre;Calr+/+ mice (original magnification ×20). (Bb,d) Infiltration of myeloid cells such as megakaryocytes, erythroblasts, and granulocytes is clearly observed in the spleen of Mx1-cre;Calrf/− mice (original magnification ×200). These findings were not apparent in the spleen of Mx1-cre;Calr+/− mice (not shown). (C) Proportions of myeloid cells (Mac1+ or Gr1+), T cells (CD3+), B cells (B220+), erythroid cells (CD71+ and Ter119+), and megakaryocytes (CD41+) in the spleen (top). In spleens of Mx1-cre;Calrf/− mice (n = 13), B cells were decreased, whereas erythroblasts, megakaryocytes, and granulocytes were increased compared with Mx1-cre;Calr+/+ mice (n = 8). No difference was found between Mx1-cre;Calr+/− mice (n = 9) and Mx1-cre;Calr+/+ mice. Proportions of HSCs and progenitors in the spleen (bottom). Compared with Mx1-cre;Calr+/+ mice, Mx1-cre;Calrf/− mice showed increased frequencies of LT-HSC, MPPs, LSK cells, common myeloid progenitors, GMPs, erythromegakaryocyte progenitors, and megakaryocyte progenitors (MKPs). No differences were found in the frequencies of any progenitors between Mx1-cre;Calr+/+ mice and Mx1-cre;Calr+/− mice. (D) Number of hematopoietic colonies per 105 spleen cells. The proportions of CFU-GEMMs, CFU-GMs, and CFU-Es were higher in Mx1-cre;Calrf/− mice (n = 12) than in Mx1-cre;Calr+/+ mice (n = 9). In the spleen of Mx1-cre;Calr+/− mice (n = 10), only CFU-GMs were mildly increased. (E) Heat maps comparing cytokines levels in plasma from Mx1-cre;Calr+/+ (n = 7), Mx1-cre;Calr+/− (n = 6), and Mx1-cre;Calrf/− (n = 7) mice. The levels are shown by the color gradient from green (low levels) to red (high levels). *P < .05; **P < .01 vs Mx1-cre Calr+/+; †P < .05 vs Mx1-cre Calr+/−. (F) Kaplan-Meier plot of Mx1-cre;Calr+/+, Mx1-cre;Calr+/−, and Mx1-cre;Calrf/− mice (n = 30 in each group). All data are presented as the means ± SEM. To assess statistical significance among groups, 1-way ANOVA followed by the Tukey–Kramer test was used. *P < .05; **P < .01 (A,C,D); n.s., not significant.
Extramedullary hematopoiesis in the spleen of Calr-deficient mice. (A) Spleen weight of 4- to 6-month-old mice. Mx1-cre;Calrf/− mice (n = 13) exhibited splenomegaly compared with Mx1-cre;Calr+/+ mice (n = 9). On the other hand, no difference was found between Mx1-cre;Calr+/− mice (n = 10) and Mx1-cre;Calr+/+ mice. (B) Histology of the spleen. The spleen was stained with hematoxylin and eosin at 6 months of age. (Ba,c) The margin of white pulp is obscured in Mx1-cre;Calrf/− mice compared with Mx1-cre;Calr+/+ mice (original magnification ×20). (Bb,d) Infiltration of myeloid cells such as megakaryocytes, erythroblasts, and granulocytes is clearly observed in the spleen of Mx1-cre;Calrf/− mice (original magnification ×200). These findings were not apparent in the spleen of Mx1-cre;Calr+/− mice (not shown). (C) Proportions of myeloid cells (Mac1+ or Gr1+), T cells (CD3+), B cells (B220+), erythroid cells (CD71+ and Ter119+), and megakaryocytes (CD41+) in the spleen (top). In spleens of Mx1-cre;Calrf/− mice (n = 13), B cells were decreased, whereas erythroblasts, megakaryocytes, and granulocytes were increased compared with Mx1-cre;Calr+/+ mice (n = 8). No difference was found between Mx1-cre;Calr+/− mice (n = 9) and Mx1-cre;Calr+/+ mice. Proportions of HSCs and progenitors in the spleen (bottom). Compared with Mx1-cre;Calr+/+ mice, Mx1-cre;Calrf/− mice showed increased frequencies of LT-HSC, MPPs, LSK cells, common myeloid progenitors, GMPs, erythromegakaryocyte progenitors, and megakaryocyte progenitors (MKPs). No differences were found in the frequencies of any progenitors between Mx1-cre;Calr+/+ mice and Mx1-cre;Calr+/− mice. (D) Number of hematopoietic colonies per 105 spleen cells. The proportions of CFU-GEMMs, CFU-GMs, and CFU-Es were higher in Mx1-cre;Calrf/− mice (n = 12) than in Mx1-cre;Calr+/+ mice (n = 9). In the spleen of Mx1-cre;Calr+/− mice (n = 10), only CFU-GMs were mildly increased. (E) Heat maps comparing cytokines levels in plasma from Mx1-cre;Calr+/+ (n = 7), Mx1-cre;Calr+/− (n = 6), and Mx1-cre;Calrf/− (n = 7) mice. The levels are shown by the color gradient from green (low levels) to red (high levels). *P < .05; **P < .01 vs Mx1-cre Calr+/+; †P < .05 vs Mx1-cre Calr+/−. (F) Kaplan-Meier plot of Mx1-cre;Calr+/+, Mx1-cre;Calr+/−, and Mx1-cre;Calrf/− mice (n = 30 in each group). All data are presented as the means ± SEM. To assess statistical significance among groups, 1-way ANOVA followed by the Tukey–Kramer test was used. *P < .05; **P < .01 (A,C,D); n.s., not significant.
Plasma concentrations of interleukin (IL)-1α and -6, interferon-γ (IFN-γ), macrophage inflammatory protein-1α and -1β, and tumor necrosis factor-α (TNF-α) were significantly higher in Mx1-cre;Calrf/− mice than in Mx-1cre;Calr+/+ and Mx-1cre;Calr+/− mice (Figure 2E; supplemental Table 1). No onset of leukemia was observed in Calr-deficient mice, and no difference in survival was seen among the 3 groups after observation for ∼2 years (Figure 2F).
Calr haploinsufficiency augments the self-renewal activity of HSCs
To investigate the functional consequences of CALR on extramedullary hematopoiesis (HSCs), we performed a competitive serial repopulating assay. BMs from Mx1-cre;Calr+/+, Mx1-cre;Calr+/−, or Mx1-cre;Calrf/− (CD45.2) mice were transplanted into lethally irradiated recipients (B6-CD45.1), together with an equal amount of WT BMs (B6-CD45.1/CD45.2), and then serially transplanted (Figure 3A). The frequency of LSKs in BM was comparable among the 3 types of mice (Figure 1E). However, the transplanted Mx1-cre;Calr+/− and Mx1-cre;Calrf/− BMs exhibited higher PB chimerism in the first recipients 16 weeks after transplantation (Figure 3B). A much greater contribution of chimerism in the second recipients was observed for Mx1-cre;Calr+/− cells, whereas chimerism in the second recipients was comparable in BM of Mx1-cre;Calr+/+ and Mx1-cre;Calrf/− mice. We performed the same kind of assay using 4 × 10³ LSKs as the test cells and followed the chimerism over time (Figure 3B right; Figure 3C). The result at 16 weeks after transplantation was completely the same as that using whole BMs. A time course analysis showed that chimerism of Mx1-cre;Calrf/− cells in the first recipient was higher than Mx1-cre;Calr+/+ cells early after transplantation; however, chimerism gradually decreased after 32 weeks. Furthermore, the chimerism of Mx1-cre;Calrf/− cells in the second recipient was comparable to that of Mx1-cre;Calr+/+ cells (Figure 3C). The chimerism of Mx1-cre;Calr+/− cells remained higher than Mx1-cre;Calr+/+ cells in both the first and second recipient mice.
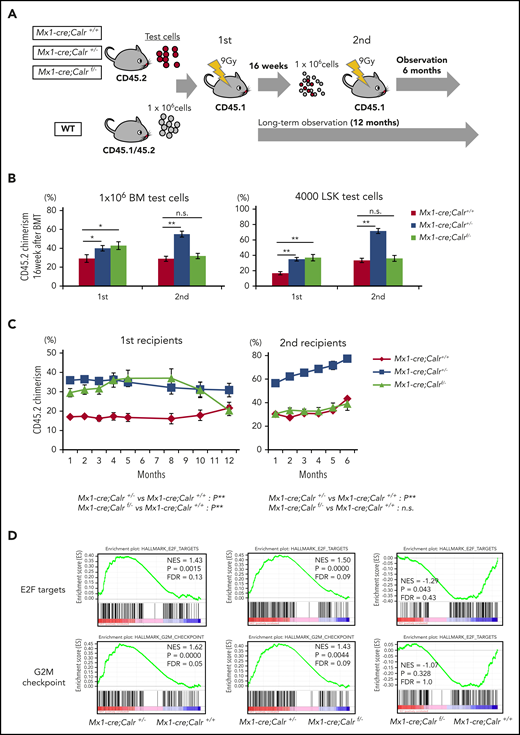
Calr haploinsufficiency confers hematopoietic stem cells with a clonal advantage over WT cells. (A) Schematic depiction of the competitive and serial repopulation assay. Test cells (1 × 10⁶ unpurified BM cells or 1 × 10³ sorted LSK cells) (B6-CD45.2) and 1 × 10⁶ unpurified wild-type (WT) BM competitor cells (B6-CD45.1/45.2) were transplanted into lethally irradiated recipients (B6-CD45.1; n = 14 in each group), and then 1 × 10⁶ BM cells (harvested from 2 of those recipients) were transplanted into a second set of lethally irradiated WT recipients (B6-CD45.1; n = 14 in each group). Observation was continued for 12 months of mice not used for cell transplantation. Donor chimerism was calculated as CD45.2/(CD45.2 + CD45.1/45.2). (B) The percent chimerism of donor-derived CD45.2 cells in PB at 16 weeks after the first and second transplantations is shown. (C) The percent chimerism of donor cells was recorded for 12 months in primary recipients (n = 12 in each group) and for 6 months in secondary recipients (n = 14 in each group). (D) Results of GSEA analysis for Mx1-cre;Calr+/+, Mx1-cre;Calr+/−, and Mx1-cre;Calrf/− LSK cells isolated from recipient mice at 12 weeks after BM transplantation. In hallmark gene sets, E2F target genes and G2M checkpoint genes were significantly enriched in Mx1-cre;Calr+/− LSK cells compared with Mx1-cre;Calr+/+ and Mx1-cre;Calrf/− LSK cells. All data are presented as the means ± SEM. To assess statistical significance among groups, 1-way ANOVA followed by the Tukey–Kramer test was used (B). For comparison of chimerism over time, ANOVA with repeated measures was used (C). *P < .05; **P < .01; n.s., not significant.
Calr haploinsufficiency confers hematopoietic stem cells with a clonal advantage over WT cells. (A) Schematic depiction of the competitive and serial repopulation assay. Test cells (1 × 10⁶ unpurified BM cells or 1 × 10³ sorted LSK cells) (B6-CD45.2) and 1 × 10⁶ unpurified wild-type (WT) BM competitor cells (B6-CD45.1/45.2) were transplanted into lethally irradiated recipients (B6-CD45.1; n = 14 in each group), and then 1 × 10⁶ BM cells (harvested from 2 of those recipients) were transplanted into a second set of lethally irradiated WT recipients (B6-CD45.1; n = 14 in each group). Observation was continued for 12 months of mice not used for cell transplantation. Donor chimerism was calculated as CD45.2/(CD45.2 + CD45.1/45.2). (B) The percent chimerism of donor-derived CD45.2 cells in PB at 16 weeks after the first and second transplantations is shown. (C) The percent chimerism of donor cells was recorded for 12 months in primary recipients (n = 12 in each group) and for 6 months in secondary recipients (n = 14 in each group). (D) Results of GSEA analysis for Mx1-cre;Calr+/+, Mx1-cre;Calr+/−, and Mx1-cre;Calrf/− LSK cells isolated from recipient mice at 12 weeks after BM transplantation. In hallmark gene sets, E2F target genes and G2M checkpoint genes were significantly enriched in Mx1-cre;Calr+/− LSK cells compared with Mx1-cre;Calr+/+ and Mx1-cre;Calrf/− LSK cells. All data are presented as the means ± SEM. To assess statistical significance among groups, 1-way ANOVA followed by the Tukey–Kramer test was used (B). For comparison of chimerism over time, ANOVA with repeated measures was used (C). *P < .05; **P < .01; n.s., not significant.
To understand the increased self-renewal capacity of Mx1-cre;Calr+/− cells, we performed gene expression profiling of LSKs (Figure 3D). In gene set enrichment analysis (GSEA) using hallmark gene sets, E2F target genes were significantly enriched in Mx1-cre;Calr+/− LSKs compared with both Mx1-cre;Calr+/+ and Mx1-cre;Calrf/− LSKs. On the other hand, there was no difference in enrichment of E2F target genes between Mx1-cre;Calrf/− and Mx1-cre;Calr+/+ LSKs.
Calr haploinsufficiency is essential for the development of CALR-mutated MPNs
As we previously reported,16 in competitive transplantation assays, mice receiving transplants of 1 × 10⁶CALRdel52;Calr+/+ BM test cells together with 1 × 10⁶ WT BM competitor cells exhibited higher PB chimerism compared with mice receiving 1 × 10⁶ WT BM test cells as a control (supplemental Figure 2A). As CALRdel52;Calr+/+ BMs contain approximately twice as many LSKs as WT BMs, we performed the same competitive transplantation assays using 4 × 10³ LSK cells as test cells. The chimerism in recipient mice transplanted with CALRdel52;Calr+/+ LSKs was significantly lower than that with WT LSK cells (supplemental Figure 2B). These results may indicate that HSCs with the CALR mutation have lower self-renewal activity and that gain-of-function of CALR may not be sufficient for the initiation and development of MPN. Some other events may be essential for the development of MPNs. In MPN patients, unlike transgenic mice, CALR mutations occur in 1 allele, resulting in a half reduction in CALR. Considering the results of our experiments together, we hypothesized that CALR haploinsufficiency plays some role in the HSC function of CALR-mutated MPNs.
To analyze the effect of Calr haploinsufficiency on hematopoiesis in CALRdel52;Calr+/+ mice, we crossed CALRdel52;Calr+/+ mice and Calr+/− mice and obtained CALRdel52;Calr+/− mice, which have 1 CALRdel52 transgene and 1 WT Calr allele. We compared hematopoiesis in 3 groups of mice: WT, CALRdel52;Calr+/+, and CALRdel52;Calr+/−. The CALRdel52;Calr+/− mice exhibited thrombocytosis and showed an increased proportion of HSCs in BM, similar to CALRdel52;Calr+/+ mice (Figure 4A-B). Neither genotype of mice showed splenomegaly. The survival was comparable among the 3 groups of mice (Figure 4C-D).
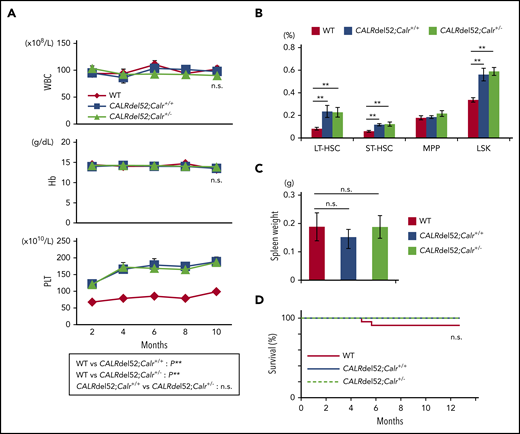
Calr haploinsufficiency does not affect disease severity in CALRdel52;Calr+/+ mice. (A) Average complete blood cell counts (n = 21 in each group). Both CALRdel52;Calr+/+ mice and CALRdel52;Calr+/− mice developed thrombocytosis, and the degree of the increase was equivalent. (B) Proportions of HSCs and progenitors in BM. Compared with WT mice, increases in HSCs and hematopoietic progenitor cells were observed in both groups of mice, and the degree of the increase was equivalent. (C) Spleen weight of 4- to 6-month-old mice (n = 11-12 in each group). No difference was found in the spleen weight among the 3 groups of mice. (D) Kaplan-Meier plot of WT, CALRdel52;Calr+/+, and CALRdel52;Calr+/− mice (n = 21 in each group). All data are presented as means ± SEM. Statistical analyses of survival were performed with the log-rank test. To assess statistical significance among groups, 1-way ANOVA followed by the Tukey–Kramer test was used. *P < .05; **P < .01; n.s., not significant.
Calr haploinsufficiency does not affect disease severity in CALRdel52;Calr+/+ mice. (A) Average complete blood cell counts (n = 21 in each group). Both CALRdel52;Calr+/+ mice and CALRdel52;Calr+/− mice developed thrombocytosis, and the degree of the increase was equivalent. (B) Proportions of HSCs and progenitors in BM. Compared with WT mice, increases in HSCs and hematopoietic progenitor cells were observed in both groups of mice, and the degree of the increase was equivalent. (C) Spleen weight of 4- to 6-month-old mice (n = 11-12 in each group). No difference was found in the spleen weight among the 3 groups of mice. (D) Kaplan-Meier plot of WT, CALRdel52;Calr+/+, and CALRdel52;Calr+/− mice (n = 21 in each group). All data are presented as means ± SEM. Statistical analyses of survival were performed with the log-rank test. To assess statistical significance among groups, 1-way ANOVA followed by the Tukey–Kramer test was used. *P < .05; **P < .01; n.s., not significant.
We transplanted LSKs from the 3 genotypes of mice into lethally irradiated recipients (Figure 5A). CALRdel52;Calr+/+ cells showed a decreased repopulating capacity compared with WT cells during 10 months of observation (Figure 5B). On the other hand, CALRdel52;Calr+/− cells expanded clones significantly faster than WT cells up to 3 months after transplantation. However, although WT cells continued to expand, CALRdel52;Calr+/− cell clonal expansion plateaued after 3 months, and we found no difference in the chimerism of both groups from 5 to 10 months after transplantation. These data demonstrate that concurrent CALR haploinsufficiency, which occurred simultaneously because of the CALR mutation, restored the self-renewal defect induced by the CALR mutation and had the potential for providing a growth advantage over WT cells, although this potential is very short-term and not persistent. We examined whether these recipient mice developed MPNs. As shown in Figure 5C-D, the number of megakaryocytes in BM was not significantly increased in recipients transplanted with CALRdel52;Calr+/+ LSKs compared with those transplanted with WT LSKs, and these mice did not develop MPNs. In contrast, in recipients of CALRdel52;Calr+/− LSKs, the number of megakaryocytes in BM was doubled compared with mice that received WT LSKs, and thrombocytosis was observed. These data indicate that the CALR mutation is not sufficient, and Calr haploinsufficiency is required for the development of MPNs in competitive conditions.
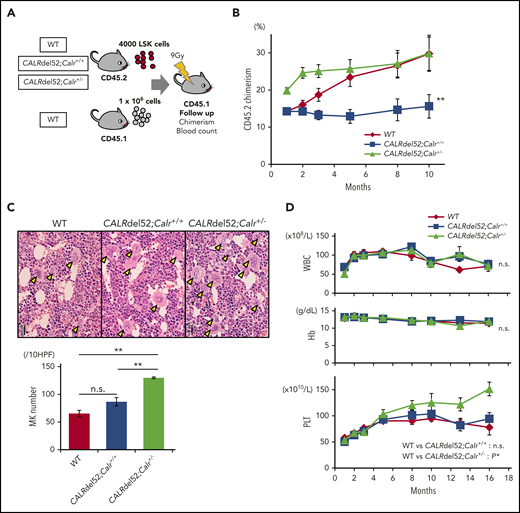
Calr haploinsufficiency restores the functions of hematopoietic stem cells impaired by the CALRdel52 mutation. (A) Competitive repopulation assay. LSK cells (1 × 10³ cells) sorted from WT mice, CALRdel52;Calr+/+ mice, and CALRdel52;Calr+/− mice (B6-CD45.2) together with 1 × 10⁶ WT unpurified BM competitor cells (B6-CD45.1) were transplanted into lethally irradiated recipients (B6-CD45.1). Donor chimerism was calculated as CD45.2/(CD45.1 + CD45.2). (B) The percentage of chimerism of donor cells was recorded for 10 months (n = 14 in each group). (C) BM histopathology and megakaryocyte number. Megakaryocytes in BM were significantly increased in CALRdel52;Calr+/− mice (n = 5) compared with WT (n = 4) and CALRdel52;Calr+/+ (n = 5) mice (bars represent 20 μm). (D) Average complete blood cell counts (n = 14 in each group). (A-B) For comparison of hematologic values over time, ANOVA with repeated measures was used. (C) One-way ANOVA followed by the Tukey-Kramer test was used to assess the number of megakaryocytes among groups. *P < .05; **P < .01; n.s., not significant.
Calr haploinsufficiency restores the functions of hematopoietic stem cells impaired by the CALRdel52 mutation. (A) Competitive repopulation assay. LSK cells (1 × 10³ cells) sorted from WT mice, CALRdel52;Calr+/+ mice, and CALRdel52;Calr+/− mice (B6-CD45.2) together with 1 × 10⁶ WT unpurified BM competitor cells (B6-CD45.1) were transplanted into lethally irradiated recipients (B6-CD45.1). Donor chimerism was calculated as CD45.2/(CD45.1 + CD45.2). (B) The percentage of chimerism of donor cells was recorded for 10 months (n = 14 in each group). (C) BM histopathology and megakaryocyte number. Megakaryocytes in BM were significantly increased in CALRdel52;Calr+/− mice (n = 5) compared with WT (n = 4) and CALRdel52;Calr+/+ (n = 5) mice (bars represent 20 μm). (D) Average complete blood cell counts (n = 14 in each group). (A-B) For comparison of hematologic values over time, ANOVA with repeated measures was used. (C) One-way ANOVA followed by the Tukey-Kramer test was used to assess the number of megakaryocytes among groups. *P < .05; **P < .01; n.s., not significant.
Gene expression changes because of CALRdel52 mutation and Calr haploinsufficiency
To understand the basis for the different HSC phenotypes in CALRdel52;Calr+/+ and CALRdel52;Calr+/− mice, we performed gene expression profiling of LSKs derived from WT, Calr+/−, CALRdel52;Calr+/+, and CALRdel52;Calr+/− mice (Figure 6A). Unsupervised hierarchical clustering of the global gene expression signatures revealed 2 main branches in the gene expression hierarchy. WT and Calr+/− samples clustered closely along 1 branch, and CALRdel52;Calr+/+ and CALRdel52;Calr+/− samples composed the other (Figure 6B), indicating that CALRdel52 expression had greater effects on the global gene expression pattern than Calr haploinsufficiency in CALRdel52;Calr+/− LSKs. Consistent with this finding, of the 89 genes significantly upregulated in any of the 3 genotypes of LSKs relative to control WT LSKs, 12 genes (13%) were shared between CALRdel52;Calr+/+ and CALRdel52;Calr+/− LSKs (Figure 6C). In contrast, few genes were commonly upregulated between CALRdel52;Calr+/− and Calr+/− LSKs. As for the 64 significantly downregulated genes, only 2 were shared between CALRdel52;Calr+/+ and CALRdel52;Calr+/− LSKs.
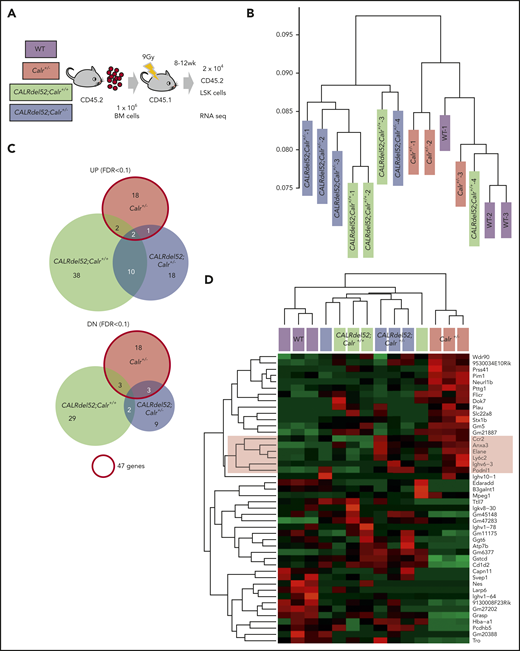
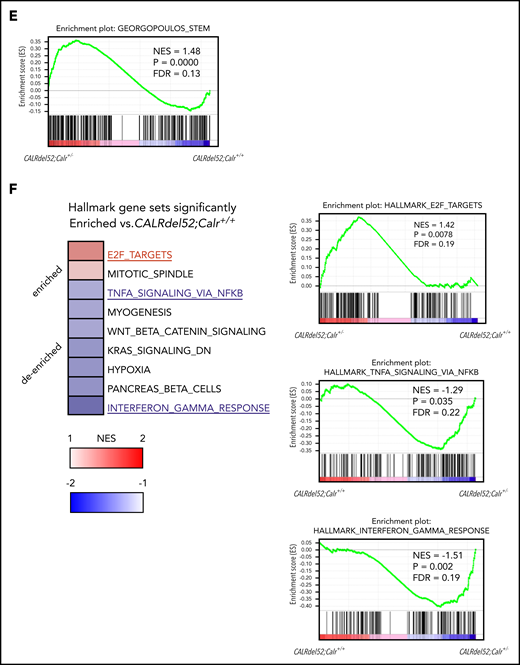
Gene expression changes due to Calr haploinsufficiency and the CALRdel52 mutant. (A) Cell collection conditions in RNAseq experiments. Unpurified BM cells (1 × 10⁶; B6-CD45.2) were transplanted into lethally irradiated recipients (B6-CD45.1; n = 9-12 in each group). At 8 to 12 weeks after transplantation, 2 × 10⁴ CD45.2+ LSK cells were sorted from BM cells pooled from 3 recipient mice and used as a sample for RNAseq analysis. We prepared a total of 14 samples: 3 WT, 3 Calr+/−, 4 CALRdel52;Calr+/+, and 4 CALRdel52;Calr+/−. (B) Unsupervised hierarchical clustering of the global gene expression signatures. (C) Venn diagram depicting differentially expressed genes in LSK cells from Calr+/−, CALRdel52;Calr+/+, and CALRdel52;Calr+/− mice relative to WT controls (false discovery rate <0.1). Forty-seven genes were differentially expressed (23 upregulated and 24 downregulated) in Calr+/− mice. (D) Hierarchical clustering of expression profiles of these 14 samples according to the 47 genes differentially expressed in Calr+/− mice. Genes (rows) and genotypes (columns) with dendrograms are shown. Dendrograms were constructed using Pearson correlation. This analysis distinguished the 4 genotypes relatively clearly. The second cluster of genes was upregulated in Calr+/− mice and CALRdel52;Calr+/− mice and was clearly downregulated in WT and CALRdel52;Calr+/+ mice (colored with red). (E) Result of GSEA analysis showing enrichment of the stem cell signature29 in CALRdel52;Calr+/− LSK cells compared with CALRdel52;Calr+/+ LSK cells. (F) GSEA results using hallmark gene sets for CALRdel52;Calr+/− and CALRdel52;Calr+/+ LSK cells. Heatmap shows the normalized enrichment score (NES) of significantly altered gene sets in CALRdel52;Calr+/− cells compared with CALRdel52;Calr+/+ cells (false discovery rate q value <0.25 or normalized P value <.05). Positive ES (red) indicates that the gene set was enriched in CALRdel52;Calr+/− LSK cells, and negative ES (blue) indicates that the gene set was de-enriched in CALRdel52;Calr+/− LSK cells. Result of GSEA analysis gene sets highlighted in blue or red are shown
Gene expression changes due to Calr haploinsufficiency and the CALRdel52 mutant. (A) Cell collection conditions in RNAseq experiments. Unpurified BM cells (1 × 10⁶; B6-CD45.2) were transplanted into lethally irradiated recipients (B6-CD45.1; n = 9-12 in each group). At 8 to 12 weeks after transplantation, 2 × 10⁴ CD45.2+ LSK cells were sorted from BM cells pooled from 3 recipient mice and used as a sample for RNAseq analysis. We prepared a total of 14 samples: 3 WT, 3 Calr+/−, 4 CALRdel52;Calr+/+, and 4 CALRdel52;Calr+/−. (B) Unsupervised hierarchical clustering of the global gene expression signatures. (C) Venn diagram depicting differentially expressed genes in LSK cells from Calr+/−, CALRdel52;Calr+/+, and CALRdel52;Calr+/− mice relative to WT controls (false discovery rate <0.1). Forty-seven genes were differentially expressed (23 upregulated and 24 downregulated) in Calr+/− mice. (D) Hierarchical clustering of expression profiles of these 14 samples according to the 47 genes differentially expressed in Calr+/− mice. Genes (rows) and genotypes (columns) with dendrograms are shown. Dendrograms were constructed using Pearson correlation. This analysis distinguished the 4 genotypes relatively clearly. The second cluster of genes was upregulated in Calr+/− mice and CALRdel52;Calr+/− mice and was clearly downregulated in WT and CALRdel52;Calr+/+ mice (colored with red). (E) Result of GSEA analysis showing enrichment of the stem cell signature29 in CALRdel52;Calr+/− LSK cells compared with CALRdel52;Calr+/+ LSK cells. (F) GSEA results using hallmark gene sets for CALRdel52;Calr+/− and CALRdel52;Calr+/+ LSK cells. Heatmap shows the normalized enrichment score (NES) of significantly altered gene sets in CALRdel52;Calr+/− cells compared with CALRdel52;Calr+/+ cells (false discovery rate q value <0.25 or normalized P value <.05). Positive ES (red) indicates that the gene set was enriched in CALRdel52;Calr+/− LSK cells, and negative ES (blue) indicates that the gene set was de-enriched in CALRdel52;Calr+/− LSK cells. Result of GSEA analysis gene sets highlighted in blue or red are shown
Among the genes affected by Calr haploinsufficiency, we looked for genes with the same expression tendency between Calr+/− and CALRdel52;Calr+/− LSKs. We performed hierarchical clustering of expression profiles of these 14 data sets according to the 46 genes significantly upregulated or downregulated in Calr+/− LSKs relative to control WT LSKs. As shown in Figure 6D, this analysis distinguished the 4 genotypes (columns) relatively clearly by differential gene expression patterns (rows). Genes in the second cluster shown in red were upregulated both in Calr+/− LSKs and CALRdel52;Calr+/− LSKs and were downregulated in WT and CALRdel52;Calr+/+ LSKs. These genes may be responsible for differences in the HSC phenotype between CALRdel52;Calr+/+ mice and CALRdel52;Calr+/− mice.
To investigate how the gene expression profile of CALRdel52;Calr+/+ cells is modified by Calr haploinsufficiency, GSEA was performed to compare CALRdel52;Calr+/+ and CALRdel52;Calr+/− LSKs. The stem cell signature gene set containing self-renewing genes was significantly enriched in CALRdel52;Calr+/− LSKs (Figure 6E).26 Significant changes in hallmark gene sets are shown in Figure 6F. E2F target genes and mitotic spindle genes associated with cell cycle progression were enriched in CALRdel52;Calr+/− LSKs. We found no difference in STAT5A signaling genes (supplemental Figure 3A), but TNF-α and IFN-γ signaling genes were negatively enriched in CALRdel52;Calr+/− LSKs compared with CALRdel52;Calr+/+ LSKs (Figure 6F). As these 2 inflammatory pathways were strongly upregulated in CALRdel52;Calr+/+ LSKs compared with WT LSKs (supplemental Figure 3B), these results indicate that enhanced inflammatory signaling was reduced in CALRdel52;Calr+/− cells.
Discussion
Calr deficiency had little effect on blood cell counts, but induced a reduction in erythropoiesis in BM and EMH and splenomegaly in the spleen. Salati et al27 reported that CALR silencing causes a decrease in both erythroid and megakaryocyte differentiation of human HSCs/progenitor cells in vitro. The effect of CALR deficiency on erythroid differentiation was similar between their result and ours, but the effect on megakaryocyte differentiation was different. As systemic inflammation occurred in Mx1-cre;Calrf/− mice, increases in cytokines such as IL-1α and -6 may affect megakaryocyte differentiation in vivo.28-30 Systemic inflammation may also cause splenomegaly in Mx1-cre;Calrf/− mice.31,32
The reduction in erythropoiesis in BM and EMH in the spleen are the hematopoietic properties of MPN progression. CALRdel52;Calr+/+ mice and CALRdel52 heterozygous knockin (KI) mice develop ET, but do not exhibit splenomegaly or EMH in the spleen.16,17 In contrast, CALRdel52 homozygous KI mice show severe thrombocytosis, reduced erythropoiesis in BM, splenomegaly and EMH in the spleen, and the development of MF.17 Homozygosity for the CALR mutation means the absence of CALR. Thus, reduced erythropoiesis in BM and EMH in the spleen, which is observed in homozygous CALRdel52 KI mice, may be caused or accelerated by CALR deficiency, as in Calr-deficient mice. The additional features in homozygous KI mice such as severe thrombocytosis and the development of MF may be related to strong activation of JAK-STAT signaling induced by both mutant alleles of CALR. Theocharides et al25 reported 5 cases of CALR homozygous mutations associated with MPO deficiency, 3 of which were post-ET-MF and 2 of which were PMF. ET cases in the chronic phase were not included. Stengel et al33 reported that among CALR mutation cases, the proportion of homozygous mutant cases was 11 of 50 (22%), when limited to patients with high mutation load and/or progressive disease. These findings indicate that homozygosity for CALR mutation is also associated with disease severity in MPN patients. We are now crossing Mx1-cre;Calrf/+ mice with CALRdel52;Calr+/− mice to obtain CALRdel52;Mx1-cre;Calrf/− mice. In the future, verifying whether the mice develop severe MPN after deletion of the floxed allele will be necessary.
As mentioned above, homozygous CALR mutations in patients with MF lead to acquired MPO deficiency.25 The results from analysis of Calr-deficient mice are completely consistent with the findings obtained from the analysis of neutrophils in MPN patients with CALR homozygous mutations, indicating that some WT CALR function was abrogated by CALR mutation. As Mpo mRNA levels were not decreased, this abrogation may have occurred during MPO protein synthesis.
Although the frequency of HSCs in BM was the same, Calr-haploinsufficient LSKs had a competitive advantage over Calr WT LSKs both in the first and second recipient mice. In contrast, Calr-deficient LSKs had a competitive advantage over Calr WT LSKs early after transplantation in the first recipient mice. However, their chimerism decreased late after transplantation and became completely the same as Calr WT LSKs in the second recipient mice. Calr-haploinsufficient LSKs exhibited higher self-renewal activity. The activation of E2F target genes in Calr-haploinsufficient LSKs compared with both Calr WT and Calr-deficient LSKs may be a reason why Calr-haploinsufficient LSKs had a growth advantage. However, 2 points should be noted. First, LSKs contain a variety of early progenitors in addition to long-term HSCs (LT-HSCs); therefore, the signatures we observed may not be seen in LT-HSCs. Second, because E2F is a positive cell cycle regulator in HSCs, disruption of the quiescent phase of HSCs may lead to defects in the self-renewal capacity of HSCs and, in the long term, lead to HSC exhaustion.34 At present, we cannot clearly explain the mechanisms of regulation of the balance between quiescence and proliferation and maintenance of advantages of long-term growth over WT HSCs by CALR-haploinsufficient HSCs.
In addition, CALR haploinsufficiency compensated for the decreased self-renewal activity of LSKs induced by mutant CALR. These results were consistent with the previous report by Li et al,17 in which CALRdel52 KI LSKs display almost the same competitive advantage as WT LSKs. Thus, our CALRdel52;Calr+/− mice certainly mimicked CALRdel52 KI mice, and have an analytical advantage because they can be used to distinguish the role of mutant CALR from that of CALR haploinsufficiency, which both simultaneously occur in MPN patients with CALR mutation. The development of MPN only in recipient mice transplanted with CALRdel52;Calr+/− LSKs in competitive conditions clearly indicated that CALR haploinsufficiency would be essential for MPN onset. The mechanism of MPN onset with the CALR mutation resembles that with the JAK2V617F mutation. We and others previously reported that the JAK2V617F mutation reduces the self-renewal activity of HSCs,35,36 and loss of TET2 is necessary for the development and maintenance of JAK2V617F-induced MPNs. Mutations in epigenetic regulator genes such as TET2, EZH2, IDH2, and DNMT3A, are frequently associated with driver mutations in MPN patients.37 For instance, TET2 mutation is a loss-of-function mutation that strongly increases the in vivo repopulating capacity of HSCs.38-40 In contrast, the CALR mutation precedes epigenetic regulator gene mutations in most MPNs with the CALR mutation.9,10,37 CALR haploinsufficiency may take the place of epigenetic regulator gene mutations in MPNs with JAK2V617F and be essential for MPN onset and development.
To explore the mechanism of why CALRdel52;Calr+/− LSKs showed enhanced self-renewal activity compared with CALRdel52;Calr+/+ LSKs and contributed to the development of ET, we performed gene expression profiling of LSKs. In CALRdel52;Calr+/− LSKs, stem cell signature genes containing self-renewing genes and E2F target genes associated with cell cycle progression were enriched. These changes indicate that CALRdel52;Calr+/− LSKs grow faster compared with CALRdel52;Calr+/+ LSKs, which is consistent with the high chimerism of CALRdel52;Calr+/− cells in transplantation experiments. In addition, the excessive activation of proinflammatory cytokine signaling was palliated by Calr haploinsufficiency. The 2 gene sets, “TNF-α signaling via NF-κB” and “IFN-γ response,” were the first and second most strongly enriched gene sets in CALRdel52;Calr+/+ cells compared with WT cells. These 2 proinflammatory cytokine signals affect HSCs depending on their amount and context. Although baseline TNF-α signaling is thought to be necessary for HSC maintenance,41,42 excessive activation of TNF-α signaling suppresses HSC proliferation and reduces the long-term repopulation ability.43,44 The decline in HSC function related to aging may cause the increased TNF-α signaling and activation of downstream NF-κB.45,46 Regarding IFN-γ signaling, short-term signaling induces HSC proliferation,47,48 but long-term signaling suppresses HSC self-renewal, promotes HSC differentiation into the myeloid lineage, and depletes the HSC pool.49,50 The excessive activation observed in CALRdel52;Calr+/+ LSKs compared with WT LSKs may impair the self-renewal activity, and suppression of these pathways induced by Calr haploinsufficiency may alleviate the decline in HSC function and contribute to the development of MPN.
In summary, CALR deficiency had little effect on blood cell counts but induced reduction in erythropoiesis in the BM and EMH in the spleen. CALR haploinsufficiency, which was simultaneously present with the CALR mutation compensated for the decreased self-renewal activity of HSCs induced by the CALR mutation, contributing to MPN development.
RNA sequencing data have been deposited in the DNA Data Bank of Japan (accession number DRA008812).
The online version of this article contains a data supplement.
The publication costs of this article were defrayed in part by page charge payment. Therefore, and solely to indicate this fact, this article is hereby marked “advertisement” in accordance with 18 USC section 1734.
Acknowledgments
The authors thank M. Ikawa (Osaka University, Japan) for kindly providing the Calrf/− mice, T. Sugiyama and H. Nishitoh (University of Miyazaki, Japan) for helpful discussion, and S. Saito, M. Matsushita, T. Shinmori, and A. Nakatake for their technical assistance.
This work was supported by Grants-in-Aid for Scientific Research (C) (16K09852, 19K08819) (K.S.) and (B) (17H04210) (K.S.) from the Japan Society for the Promotion of Science, and by Research Grants from the Shinnihon Foundation of Advanced Medical Treatment Research (K.S.), the Senshin Medical Research Foundation (K.S.), and Japan Leukemia Research Fund (K.S.).
Authorship
Contribution: K. Shide, T.K., A.K., Y.O., and M.O. performed the research; K. Shide, T.Y.-N., S.K., and G.S. performed RNAseq analysis; K.I., M.S., K.A., Y.T., K. Nakamura, T.H., Y.K., H.I., S.H., and K. Nagata analyzed and interpreted the data; and K. Shide and K. Shimoda conceived the research, guided its design, analysis, and interpretation, and wrote the manuscript.
Conflict-of-interest disclosure: The authors declare no competing interests.
The current affiliation for M.O. is Department of Clinical Proteomics, National Cancer Center Research Institute, Tokyo, Japan.
Correspondence: Kazuya Shimoda, Department of Gastroenterology and Hematology, Faculty of Medicine, University of Miyazaki, 5200 Kihara, Kiyotake, Miyazaki 889-1692, Japan; e-mail: kshimoda@med.miyazaki-u.ac.jp.
