

Key Points
VenG was superior to GClb across different genetic subgroups, but del(17p) and mutated TP53 remain as adverse prognostic markers.
Unmutated IGHV is a predictive factor for particular benefit from venetoclax and obinutuzumab.

Abstract
Genetic parameters are established prognostic factors in chronic lymphocytic leukemia (CLL) treated with chemoimmunotherapy, but are less well studied with novel compounds. We assessed immunoglobulin heavy variable chain (IGHV) mutation status, common genomic aberrations, and gene mutations in 421 untreated patients within the CLL14 trial (NCT02242942), comparing obinutuzumab+chlorambucil (GClb) vs obinutuzumab+venetoclax (VenG). The incidences of genomic aberrations considering the hierarchical model were del(17p) 7%, del(11q) 18%, +12 18%, and del(13q) 35%, whereas IGHV was unmutated in 60% of patients. NOTCH1 mutations were most common (23%), followed by SF3B1 (16%), ATM (13%), and TP53 (10%). Although the overall response rate (ORR) for GClb was lower in patients with del(17p), del(11q), mutated TP53, ATM, and BIRC3, none of these parameters reduced complete remission (CR) rate and ORR with VenG. At a median follow-up of 28 months, del(17p) and mutated TP53 were the only abnormalities with an effect on progression-free survival (PFS) for both treatment groups: GClb (hazard ratio [HR], 4.6 [P < .01]; HR, 2.7 [P < .01], respectively) and VenG (HR, 4.4 [P < .01]; HR, 3.1 [P < .01], respectively). No other factors affected outcome with VenG, whereas for GClb del(11q), BIRC3, NOTCH1, and unmutated IGHV were associated with shorter PFS. Multivariable analysis identified del(17p), del(11q), unmutated IGHV, and mutated TP53, BIRC3, and SF3B1 as independent prognostic factors for PFS with GClb, whereas for VenG, only del(17p) was significant. VenG was superior to GClb across most genetic subgroups. Patients with adverse genetic markers had the strongest benefit from VenG, particularly subjects with unmutated IGHV, which was identified as a predictive factor in a multivariable treatment-interaction analysis.
Introduction
Chronic lymphocytic leukemia (CLL) shows a low number of somatic mutations in comparison with solid tumors,1 but recurrent genomic defects are among the strongest prognostic factors and are part of the standard assessment before initiation of therapy.2 Unmutated immunoglobulin heavy variable chain (IGHV) is associated with shorter time to first treatment, early progression, shorter overall survival (OS), and a higher number of recurrent genetic defects.3-6 A hierarchical model of 4 different chromosomal aberrations covers more than 70% of untreated patients with CLL and links genetic subgroups to survival.7 Highest risk for progression and death is found in a subgroup with deletion of a chromosomal region 17p [del(17p)] that contains the TP53 locus that is also recurrently affected by mutations with a comparable adverse outcome.8 In addition to TP53, more than 50 different driver genes were identified in CLL,5,9 and several of them (eg, SF3B1, NOTCH1, ATM, BIRC3, EGR2, NFKBIE, and RPS15) were attributed to early disease progression and poor outcome with chemoimmunotherapy.10-17 In particular, analyses in large clinical trial cohorts of untreated patients such as GCLLSG CLL8 and LRF CLL4 permitted us to explore the interaction of clinical, laboratory, and genetic parameters in homogeneous and well-annotated cohorts.4,18,19 In these trials, independent prognostic values for del(17p), del(11q), TP53mut, and SF3B1mut were confirmed. NOTCH1mut turned out to be predictor for lower efficacy of the CD20 antibody rituximab.4 Such findings led to attempts to integrate genetic markers into a prognostic score such as the CLL–International Prognostic Index (CLL-IPI),20-22 which was established in cohorts treated with chemo(immuno)therapy. In contrast, the prognostic value of genetic markers is scarcely explored in the context of novel compounds such as BTK and BCL2 inhibitors.
The BCL2 inhibitor venetoclax, in combination with rituximab, has proven superior to chemotherapeutic options such as bendamustine in pretreated patients.23 The CLL14 multicenter trial was designed to demonstrate superiority of time-limited venetoclax and obinutuzumab (VenG) to the standard of obinutuzumab and chlorambucil (GClb) in untreated patients with active disease and relevant comorbidities.24 Although both regimens were similar in safety, VenG outperformed GClb in rate of complete response (CR) and overall response rate (ORR), minimal residual disease (MRD) negativity, and progression-free survival (PFS) after a medium follow-up of only 28 months.25 This resulted in approval of VenG in the first-line setting by the US Food and Drug Administration in May 2019. On the basis of the protocol-defined prospective assessment of IGHV status and cytogenetic and molecular genetic parameters in the central reference laboratory of the GCLLSG, we investigated prognostic and predictive factors in the context of venetoclax and chlorambucil in combination with obinutuzumab. Based on standard definition, a prognostic factor associates with outcome independent of the type of therapy. In contrast, the effect of a predictive factor is restricted to a specific treatment and can only be identified in a comparative trial.26 The analysis for genetic prognostic and predictive factors was implemented as an exploratory objective in the trial protocol.
Patients and methods
Patients
The multicenter phase 3 CLL14 trial (NCT02242942) enrolled 432 patients with CLL in need of first-line treatment. All patients had relevant coexisting conditions defined by a Cumulative Illness Rating Scale score higher than 6 and/or a creatinine clearance lower than 70 mL/min and were randomly assigned to treatment with VenG or GClb. Obinutuzumab was administered 8 times over cycles 1 to 6 (28 days per cycle), and venetoclax or chlorambucil was given until cycle 12.24,25 All human investigations were approved by the institutional review board or independent health authorities at each participating institution and were conducted in accordance with the Declaration of Helsinki. All analyses of genetic markers were implemented in the study protocol from peripheral blood samples obtained at screening or cycle1 day1.
Prognostic factors
We performed analysis of genomic aberrations by interphase fluorescence in situ hybridization and IGHV mutational status by DNA sequencing in the central reference laboratory of the GCLLSG at Ulm University on all obtained samples at study entry. For gene mutation analysis of CLL candidate genes, we designed a customized Illumina TruSeq Custom Amplicon panel with 2 independent primer sets for redundant coverage of NOTCH1, SF3B1, ATM, TP53, RPS15, BIRC3, MYD88, FBXW7, POT1, XPO1, NFKBIE, EGR2, and BRAF either for the full gene or most commonly affected exons (supplemental Table 1 and supplemental Methods; available on the Blood Web site). The selection of these targets for next generation sequencing (NGS) comprises the 11 most frequent mutated genes in CLL identified via unbiased whole-exome sequencing of 528 patients with CLL.5 FBXW7 was added because of a known interaction with NOTCH1,27 and NFKBIE because of evidence about prognostic effect in CLL.14 We used a custom bioinformatics pipeline including Burrows-Wheeler Aligner and Samtools (alignment) and Varscan (variant calling and annotation). Current databases (COSMIC, 1000G, dbSNP145, ClinVar) were taken into consideration to evaluate and report variants above a threshold of 10% mean variant allele fraction as pathogenic/nonpathogenic. Novel variants not previously classified as somatic mutations or with unknown significance were confirmed to be somatic via sequencing of the nontumor sample obtained from the CD19-negative PBMC fraction if available.
Statistics
Statistical analyses including PFS, OS, response to treatment, and MRD negativity in peripheral blood were performed on an intent-to-treat basis, including all patients with samples available. We compared categorical variables using the Fisher exact test. There were no adjustments for multiple testing, so that all reported P values have an exploratory character. Time to event was analyzed by Kaplan-Meier estimates and nonstratified log-rank testing. Hazard ratios (HRs) and 95% confidence intervals (95% CIs) were calculated using Cox proportional hazards regression model. The terms prognostic and predictive are used based on definitions published elsewhere.26 For identification of predictive value, we included the term IGHV*treatment to a Cox regression model in addition to IGHV status and treatment group to test, whether the coefficient of IGHV*treatment is significantly different than 0 (HR, 1). Independent prognostic factors for PFS were identified by multivariable analyses using Cox proportional hazards regression modeling with stepwise forward and backward selection procedures. Treatment group and genetic subgroups that were independently associated with PFS in univariate analyses (test level was set at 5%), as well as genetic subgroups that were of particular interest (SF3B1 and ATM), were considered as candidates for the multivariate modeling for the whole population and both treatment groups, separately. Statistical tests were 2-sided, and statistical significance was defined as a value of P < .05 without adjustments for multiple testing. We used R studio 1.1.447 (RStudio Inc., Boston, MA) and SPSS v23 (SPSS, Chicago, IL) for statistical analyses.
Results
Incidence and associations of genetic markers
Of the intention-to-treat population (n = 432), fluorescence in situ hybridization/IGHV/NGS results were available in 418 (97%), 408 (94%), and 421 (97%) cases, respectively. Considering the hierarchical model,7 we identified 7% of patients with del(17p), followed by 18% with del(11q), 18% with trisomy 12 (+12), and 35% with del(13q), with the remainder of 22% with no abnormality. The highest incidence of mutations was found in NOTCH1, affecting 23% of patients (exon34: 18%, 3′UTR: 5%), followed by SF3B1 (16%), ATM (13%), TP53 (10%), XPO1 (6%), RPS15 (5%), POT1 (5%), BRAF (4%), NFKBIE (4%), BIRC3 (4%), EGR2 (4%), MYD88 (2%), and FBXW7 (1%; Figure 1A). IGHV was unmutated in 60% of cases and mutated in 39%, with 1% not evaluable. All aberrations, gene mutations, and IGHV status balanced well in both treatment groups.
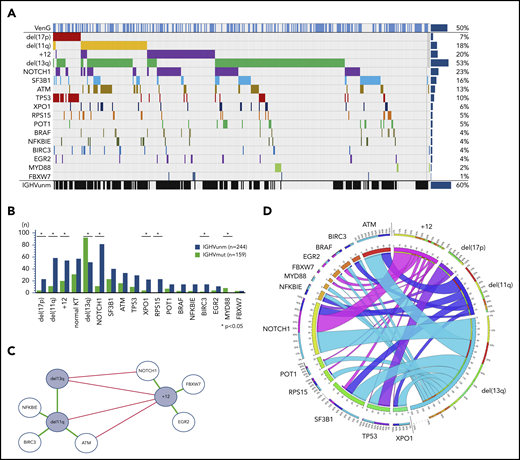
Incidence and associations of genetic parameters. (A) Distribution of markers (rows) in patients (columns) with overall incidence ordered by genetic parameters. (B) Distribution of gene mutations in the IGHV mutation status subgroups. Y axes provides full number of mutated/unmutated IGHV status per subgroup. X axes comprise cytogenetics parameters sorted according to the hierarchical model and mutated candidate genes sorted by incidence. (C) Genetic markers show significant (P < .05) co-occurrence (green lines) and mutual exclusivity (red lines) and cluster in a dichotomy of del(13q)/del(11q) and +12 and adjacent gene mutations. (D) Circos plot of the co-occurrence of gene mutations with chromosomal aberrations. Lengths of arcs correspond to total incidences of respective markers, and the width of each ribbon corresponds to the proportion of co-occurrence with a respective second marker.
Incidence and associations of genetic parameters. (A) Distribution of markers (rows) in patients (columns) with overall incidence ordered by genetic parameters. (B) Distribution of gene mutations in the IGHV mutation status subgroups. Y axes provides full number of mutated/unmutated IGHV status per subgroup. X axes comprise cytogenetics parameters sorted according to the hierarchical model and mutated candidate genes sorted by incidence. (C) Genetic markers show significant (P < .05) co-occurrence (green lines) and mutual exclusivity (red lines) and cluster in a dichotomy of del(13q)/del(11q) and +12 and adjacent gene mutations. (D) Circos plot of the co-occurrence of gene mutations with chromosomal aberrations. Lengths of arcs correspond to total incidences of respective markers, and the width of each ribbon corresponds to the proportion of co-occurrence with a respective second marker.
In line with prior observations, del(13q) and +12 were mutually exclusive (odds ratio [OR], 0.12; P < .01). del(11q) was accumulated in patients with del(13q) (OR, 2.63; P < .01), but was rare in +12 (OR, 0.34; P < .01). Mutated IGHV was preferentially found in patients with del(13q) (OR, 3.20; P < .01) and MYD88 mutation (8 of 9 cases; details in Figure 1B). In contrast, del(17p) (OR, 4.01; P < .01), del(11q) (OR, 3.89; P < .01), +12 (OR, 2.31; P < .01), and mutated NOTCH1 (OR, 6.70; P < .01), BIRC3 (OR, 4.78; P = .03), XPO1 (OR, 3.84; P = .01), and RPS15 (25 of 25 cases) were significantly accumulated in unmutated IGHV CLL.
Furthermore, we confirmed co-occurrences of gene mutations and chromosomal aberrations, most notably del(17p) with TP53 (OR, 67.94; P < .01) in 77% of all del(17p) cases and 57% of all TP53 mutated cases. In addition, we found a significant association of +12 with mutated NOTCH1 (OR, 3.02; P < .01) and FBXW7 (OR, 8.22; P = .02). del(11q) was associated with mutated ATM (OR, 6.12; P < .01) and BIRC3 (OR, 7.31; P < .01), both located on 11q, but also with NFKBIE (OR, 4.24; P < .01;). Patients with normal karyotype had a higher incidence of SF3B1 mutations (OR, 2.56; P < .01) and fewer TP53 mutations (OR, 0.35; P = .05).
VenG achieves high response rate and MRD negativity rate in all genetic subgroups
At treatment completion, the ORR and rate of CRs was higher with VenG (85% and 50%, respectively) in comparison with GClb (71% and 23%, respectively). Of note, this difference was even more pronounced in groups with adverse prognostic factors (Figure 2A). ORR to GClb was significantly lower with the presence of del(17p) (presence 36% vs absence 75%), del(11q) (58% vs 75%), mutated TP53 (58% vs 74%), ATM (57% vs 75%), BIRC3 (33% vs 74%), and unmutated IGHV (63% vs 84%). With VenG, ORR and CR rates were similar among all subgroups. Comparing response to VenG vs response to GClb confirmed the superiority of VenG, especially with regard to CR rate; this included all cytogenetic defined groups, including del(17p) (GClb 7% vs VenG 47%), as well as mutated TP53 (5% vs 48%), ATM (13% vs 44%), NOTCH1 (26% vs 52%), RPS15 (0% vs 46%), NFKBIE (18% vs 83%), mutated IGHV (35% vs 51%), and unmutated IGHV (15% s. 51%).
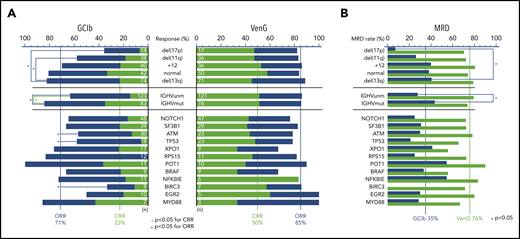
Response and MRD rates of genetic subgroups. (A) Stacked bar graph for CR (green bars) and ORRs (sum of blue and green bar) for VenG- and GClb-treated genetic subgroups. Significant difference (P < .05) is marked with a blue bracket and asterisk for ORR and green bracket and asterix for CRR. Chromosomal aberrations del(17p), del(11q), +12, and no abnormality are compared with del(13q). Total number of mutations per subgroup and treatment group is specified with white numbers on the bar. (B) Bar graph with MRD negativity rate (<10−4) after VenG (green bars) and GClb (blue bars) in peripheral blood for genetic subgroups.
Response and MRD rates of genetic subgroups. (A) Stacked bar graph for CR (green bars) and ORRs (sum of blue and green bar) for VenG- and GClb-treated genetic subgroups. Significant difference (P < .05) is marked with a blue bracket and asterisk for ORR and green bracket and asterix for CRR. Chromosomal aberrations del(17p), del(11q), +12, and no abnormality are compared with del(13q). Total number of mutations per subgroup and treatment group is specified with white numbers on the bar. (B) Bar graph with MRD negativity rate (<10−4) after VenG (green bars) and GClb (blue bars) in peripheral blood for genetic subgroups.
Three months after treatment completion, MRD from peripheral blood was assessed by allele-specific oligonucleotide–polymerase chain reaction per protocol, with a threshold of 10−4 for MRD negativity. The majority (76%) of venetoclax-treated patients became MRD negative in peripheral blood.25 With GClb, only 35% of patients achieved MRD negativity, and in particular, 2 subgroups failed to achieve this endpoint in the context of GClb: del(17p) (7% vs 41% with 13q; OR, 0.11; 95% CI, 0.01-0.91) and unmutated IGHV (28% vs 43%; OR, 0.50; 95% CI, 0.28-0.90). In contrast, with VenG, all major patient subgroups achieved high MRD negativity rates that were superior to those of GClb treatment (Figure 2B; supplemental Table 2). This included not only patients with a more indolent course, such as del(13q) (79% with VenG vs 41% with GClb) or mutated IGHV (74% vs 43%), but also patients with adverse prognostic markers, such as unmutated IGHV (79% vs 28%) and high-risk CLL with presence of del(17p) (71% vs 7%) or mutated TP53 (65% vs 21%).
del(17p) remains a prognostic factor for shorter PFS with VenG and GClb treatment
After a medium follow-up of 28 months, there were 101 events for PFS and 34 for OS in the analyzed cohort. del(17p) had an adverse effect in both treatment groups, resulting in a 24-month PFS rate of 65% vs 91% in VenG (presence vs absence: HR, 4.42; 95% CI, 1.88-10.39) and 23% vs 68% in GClb (HR, 4.64; 95% CI, 2.36-9.12; Figure 3A-B). Similarly, mutated TP53 was associated with shorter PFS with VenG (HR, 3.08; 95% CI, 1.31-7.25) and GClb (HR, 2.74; 95% CI, 1.50-5.00), although we could not demonstrate a significant effect in the absence of del(17p) (supplemental Figure 1A). Among patients with del(17p)/mutated TP53 disease, progression or death occurred in 15 of 24 patients with GClb and in 8 of 25 patients with VenG (Figure 3B). Notably, none of the patients progressed while receiving therapeutic doses of venetoclax: events for PFS or OS appeared before start of venetoclax (n = 1) or in the first week of venetoclax ramp up (n = 1), whereas all other patients progressed or died several months after end of therapy (n = 6; supplemental Figure 2).
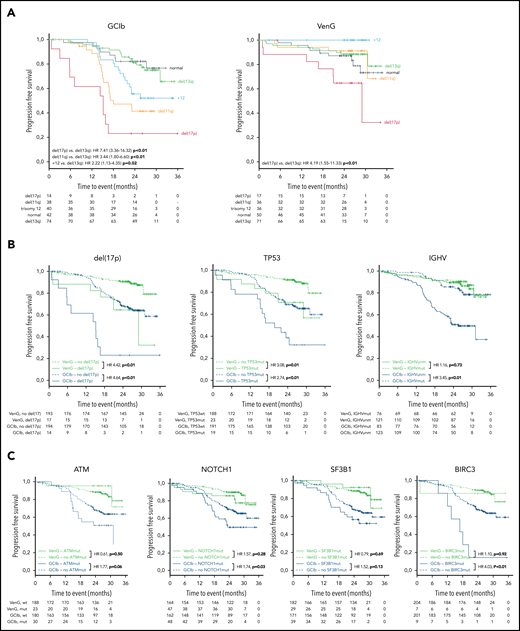
Kaplan-Meier estimates of PFS by genetic subgroups and treatment. (A) Kaplan-Meier estimates of PFS according to the hierarchical model of genomic aberrations, color-coded based on chromosomal aberration for GClb (left) and VenG (right). (B) Kaplan-Meier plots for PFS based on the status for del(17p) (presence vs absence), TP53 (mutated vs unmutated), and IGHV (unmutated vs mutated) and (C) for ATM, NOTCH1, SF3B1, and BIRC3 (mutated vs unmutated) for both treatment groups (green: VenG, blue: GClb). Subgroups with mutation/aberration are depicted by solid lines, subgroups with wild-type by dashed lines (B, C). HR values were calculated by cox proportional hazards, P values by log-rank test.
Kaplan-Meier estimates of PFS by genetic subgroups and treatment. (A) Kaplan-Meier estimates of PFS according to the hierarchical model of genomic aberrations, color-coded based on chromosomal aberration for GClb (left) and VenG (right). (B) Kaplan-Meier plots for PFS based on the status for del(17p) (presence vs absence), TP53 (mutated vs unmutated), and IGHV (unmutated vs mutated) and (C) for ATM, NOTCH1, SF3B1, and BIRC3 (mutated vs unmutated) for both treatment groups (green: VenG, blue: GClb). Subgroups with mutation/aberration are depicted by solid lines, subgroups with wild-type by dashed lines (B, C). HR values were calculated by cox proportional hazards, P values by log-rank test.
Other chromosomal aberrations and gene mutations were associated with adverse outcome only in the context of GClb chemoimmunotherapy: del(11q) [vs del(13q): HR, 3.44: 95% CI, 1.80-6.60], +12 [vs del(13q): HR, 2.22; 95% CI, 1.13-4.35], mutated NOTCH1 (HR, 1.74; 95% CI, 1.06-2.88), and BIRC3 (HR, 4.03; 95% CI, 1.73-9.37). Furthermore, ATM (HR, 1.77; 95% CI, 0.99-3.18) and SF3B1 (HR, 1.52; 95% CI, 0.88-2.62), previously discussed as prognostic factors in CLL, failed significance in the GClb group (Figure 3C). Details of median PFS, 24-month survival, and HRs/CI for all genetic markers are provided in Table 1. Considering the high co-occurrence of del(11q) with BIRC3 and ATM, we compared the outcome of patients with deletion, mutation, and both. Patients with sole ATM mutation, sole del(11q), or both had an equally increased risk for early disease progression or death after GClb (supplemental Figure 1B). Also, mutated BIRC3 associated with short PFS with GClb, which was even worse when coinciding with del(11q) (supplemental Figure 1C). Although mutated NOTCH1 and +12 associated with short PFS as individual factors, further analysis revealed a significant effect only with presence of both (supplemental Figure 1D). Therefore, +12 without NOTCH1 mutation and mutated NOTCH1 without +12 failed to affect outcome with GClb, an interesting result that requires further validation.
Incidence and PFS of genetic markers
| Genetic alteration | GClb | VenG | ||||||||||
|---|---|---|---|---|---|---|---|---|---|---|---|---|
| Incidence | 24m PFS, % | mPFS, m | HR | 95% CI | P | Incidence | 24m PFS, % | mPFS, m | HR | 95% CI | P | |
| del(17p) | 14/208 | 23.1 | 15.1 | 7.41 | 3.36-16.32 | <.01 | 17/210 | 64.7 | 29 | 4.19 | 1.55-11.33 | <.01 |
| del(11q) | 38/208 | 41.3 | 18 | 3.44 | 1.8-6.6 | <.01 | 36/210 | 91.2 | NR | 0.94 | 0.29-3.05 | .92 |
| +12 | 40/208 | 55.6 | NR | 2.22 | 1.13-4.35 | .02 | 36/210 | 100 | NR | NE | NE | NE |
| Normal | 42/208 | 82.1 | NR | 0.89 | 0.38-2.06 | .79 | 50/210 | 87.2 | NR | 1.54 | 0.61-3.89 | .36 |
| del(13q) | 74/208 | 81 | NR | NE | NE | NE | 71/210 | 88.4 | NR | NE | NE | NE |
| NOTCH1 | 48/210 | 59.2 | 23.4 | 1.74 | 1.06-2.88 | .03 | 47/211 | 85.8 | NR | 1.57 | 0.69-3.58 | .28 |
| SF3B1 | 39/210 | 56.7 | NR | 1.52 | 0.88-2.62 | .13 | 29/211 | 92.3 | NR | 0.79 | 0.24-2.6 | .69 |
| ATM | 30/210 | 50.8 | 31.1 | 1.77 | 0.99-3.18 | .06 | 23/211 | 95.5 | NR | 0.61 | 0.14-2.56 | .5 |
| TP53 | 19/210 | 36.8 | 19.8 | 2.74 | 1.50-5.00 | <.01 | 23/211 | 72.7 | NR | 3.08 | 1.31-7.25 | .01 |
| XPO1 | 17/210 | 64.7 | NR | 1.03 | 0.47-2.24 | .94 | 9/211 | 87.5 | NR | 1.25 | 0.17-9.26 | .83 |
| RPS15 | 12/210 | 57.1 | NR | 1.167 | 0.47-2.88 | .75 | 11/211 | 81.8 | NR | 1.34 | 0.32-5.64 | .69 |
| POT1 | 11/210 | 90.9 | NR | 0.41 | 0.1-1.67 | .21 | 10/211 | 100 | NR | NE | NE | NE |
| BRAF | 9/210 | 57.1 | 24.5 | 1.75 | 0.64-4.79 | .28 | 9/211 | 100 | NR | NE | NE | NE |
| NFKBIE | 11/210 | 70.7 | NR | 0.82 | 0.26-2.6 | .73 | 6/211 | 100 | NR | NE | NE | NE |
| BIRC3 | 9/210 | 14.3 | 16.8 | 4.03 | 1.73-9.37 | <.01 | 7/211 | 85.7 | NR | 1.1 | 0.15-8.13 | .92 |
| EGR2 | 10/210 | 66.7 | NR | 1.39 | 0.51-3.82 | .52 | 5/211 | 80 | NR | 2.79 | 0.66-11.78 | .16 |
| MYD88 | 7/210 | 100 | NR | NE | NE | NE | 3/211 | 100 | NR | NE | NE | NE |
| Unmutated IGHV | 123/208 | 51 | 25.6 | 3.45 | 1.95-6.1 | <.01 | 121/200 | 89.4 | NR | 1.16 | 0.51-2.62 | .73 |
| Mutated IGHV | 83/208 | 85.6 | NR | NE | NE | NE | 76/200 | 90.3 | NR | NE | NE | NE |
Absolute numbers of patients harboring mutations are provided for each treatment group with corresponding median PFS (mPFS) and 24-month PFS (24m PFS). For genetic aberrations, hazard ratio (HR), 95% confidence interval (95% CI) and P value are calculated vs del(13q), for gene mutations and IGHV status presence vs absence.
NE, not evaluable because of no event/no comparator; NR, not reached.
Unmutated IGHV was found in 60% of patients and carried prognostic value for PFS with GClb (HR, 3.45; 95% CI, 1.95-6.10; P < .01), whereas no effect was observed with VenG (HR, 1.16; 95% CI, 0.51-2.62; P = .73; Figure 3B).
Unmutated IGHV identifies patients with a particular benefit from VenG
The superiority of VenG over GClb was evident in all genetic subgroups, particularly in patients with high-risk characteristics (Figure 4). For example, in patients with del(11q), risk for progression or death was 8.93 (95% CI, 2.65-30.30) times higher with GClb in comparison with VenG. We observed similar benefits with VenG for the subgroups defined by mutated ATM, BIRC3, and SF3B1. Moreover, although 17 of 40 patients with +12 on GClb progressed within the observation time, there was no PFS event with VenG in the +12 group. Also, patients with del(17p) and/or mutated TP53 had a significant benefit from the VenG regimen, with a HR of 0.33 (95% CI, 0.12-0.89) for del(17p) and 0.35 (95% CI, 0.14-0.89) for mutated TP53 despite association with adverse outcome on both treatments. For del(17p), the median PFS improved from 15.1 months with GClb to 29.0 months with VenG. For patients with mutated TP53, median PFS was 19.8 months with GClb, whereas with VenG, it was not reached. In particular, groups characterized by favorable prognostic factors in the context of chemotherapy such as mutated IGHV and del(13q) had a similar benefit from both treatment options at current follow-up. After 24 months, 81.0% and 88.4% of patients with del(13q) as the sole abnormality remain without PFS events with GClb and VenG, whereas for mutated IGHV, the percentages were 85.6% and 90.3%, respectively. In contrast, 24-month PFS of patients with unmutated IGHV improved significantly from 51.0% with GClb to 89.4% with VenG. This corresponds to a 4.65 (95% CI, 2.66-8.13) times lower risk for progression or death with VenG treatment compared with GClb. To formally investigate the relation between treatment and IGHV mutational status, we performed an interaction-focused multivariable test. This analysis identified IGHV as a predictive factor with statistical significance (P = .03) showing particular effectivity of VenG in IGHV unmutated patients.
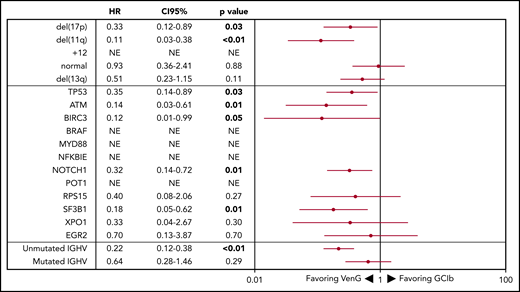
Forest plot of PFS by genetic subgroup. HRs <1 favor VenG, HRs >1 favor GClb. The HR for each subgroup is represented by a red dot, and 95% CIs are denoted by red lines. For “NE” the HR is not evaluable because there were no events in the VenG treatment group.
Forest plot of PFS by genetic subgroup. HRs <1 favor VenG, HRs >1 favor GClb. The HR for each subgroup is represented by a red dot, and 95% CIs are denoted by red lines. For “NE” the HR is not evaluable because there were no events in the VenG treatment group.
del(17p) is an independent prognostic factor for PFS and associates with early death
Finally, we performed multivariable analyses on the overall cohort and for both treatment groups separately considering genetic subgroups that were independently associated with PFS in univariate analyses [del(17p), del(11q), IGHV status, TP53, BIRC3, NOTCH1] and gene mutations with an incidence greater than 10% (SF3B1, ATM). The first model confirmed VenG as beneficial (HR, 0.24; 95% CI, 0.15-0.39) and identified del(17p) (HR, 3.86; 95% CI, 2.20-6.77), BIRC3 (HR, 2.96; 95% CI, 1.34-6.52), and unmutated IGHV (HR, 2.21; 95% CI, 1.38-3.55) as independent prognostic factors for the overall cohort. For GClb treatment, independent adverse factors were del(17p) (HR, 4.16; 95% CI, 1.87-9.23), del(11q) (HR, 2.41; 95% CI, 1.37-4.26), unmutated IGHV (HR, 2.75; 95% CI, 1.53-4.95), and mutated TP53 (HR, 2.48; 95% CI, 1.20-5.12), BIRC3 (HR, 3.80; 95% CI, 1.56-9.25), and SF3B1 (HR, 1.95; 95% CI, 1.10-3.45). In contrast, with VenG, only del(17p) remained of independent prognostic value (HR, 4.42; 95% CI, 1.88-10.39; more details in supplemental Table 3).
Regarding OS, 15 patients with GClb and 19 patients with VenG died within the follow-up time (not significant). Factors associated with significantly shorter OS in the GClb group were unmutated IGHV (HR, 5.38; 95% CI, 1.19-24.4), mutated TP53 (HR, 5.48; 95% CI, 1.87-16.1), and BRAF (HR, 6.61; 95% CI, 1.84-23.74), whereas del(17p) was prognostic with GClb (HR, 10.95; 95% CI, 3.85-31.14) and VenG (HR, 3.39; 95% CI, 1.12-10.23; Figure 5).
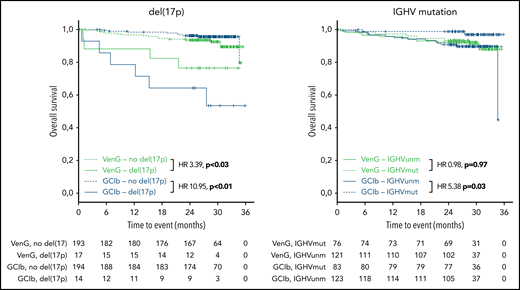
Kaplan-Meier estimates of OS by genetic subgroups and treatment. Green lines represent VenG treatment, blue lines GClb in the context of del(17p) (left graph) and unmutated IGHV (right graph). Solid lines represent patients with del(17p) (left) and unmutated IGHV (right), dashed lines patients without del(17p) (left) and mutated IGHV (right).
Kaplan-Meier estimates of OS by genetic subgroups and treatment. Green lines represent VenG treatment, blue lines GClb in the context of del(17p) (left graph) and unmutated IGHV (right graph). Solid lines represent patients with del(17p) (left) and unmutated IGHV (right), dashed lines patients without del(17p) (left) and mutated IGHV (right).
Discussion
According to International Workshop of CLL guidelines, del(17p), IGHV, and TP53 mutation status are mandatory prognostic parameters to be assessed in each patient with CLL before treatment initiation because of their effect on outcome with chemoimmunotherapy.2 In CLL14, a trial for patients with co-existing medical conditions, we confirmed the prognostic effect of all these factors for treatment with GClb. Patients with unmutated IGHV, del(17p), del(11q) mutated TP53, BIRC3, NOTCH1, and ATM had lower response rates, lower MRD negativity, and/or shorter PFS when treated with chemoimmunotherapy. In addition, several of these parameters are of independent prognostic value and confirm prior observations from clinical trials with FC, Clb,18,19 and FCR,4 which can be translated to the contemporary treatment option of the type 2 CD20 antibody obinutuzumab in combination with Clb. Interestingly, patients with BIRC3-mutated CLL had a very short PFS when treated with GClb. Although there is evidence for refractoriness to chemotherapy in cases with BIRC3 mutation,10 the high co-occurrence with the adverse factors unmutated IGHV (14 of 16 patients), del(11q) (9 of 15), and mutated NOTCH1 (6 of 16) may in part explain this observation. Another interesting finding is the adverse effect of ATM mutation on the absence of del(11q), as in prior publications a biallelic inactivation of ATM was required to affect outcome.19,28 In general, our results do not contradict these observations, as 2 mutations of ATM on different alleles can result in a biallelic inactivation similar to a co-existing del(11q). However, there was also a dedicated calling of ATM mutations in our analysis, as variants of unknown significance were confirmed to be somatic via sequencing of nontumor material. Finally, patient numbers were too small to provide a clear statement regarding monoallelic vs biallelic ATM (and BIRC3) inactivation.
With CLL14, we provide evidence for the prognostic and predictive value of genetic risk factors in frontline treatment with the BCL2 inhibitor venetoclax in patients with CLL and comorbidities. del(17p) is the only adverse parameter in the context of VenG confirmed by multivariable PFS analysis and the only factor associated with significantly shorter OS. An independent role of sole TP53 mutations remains unclear, as the number of patients without coexistent del(17p) was too low to allow meaningful analysis. In addition to del(17p) and mutated TP53, the only factor with a trend for adverse PFS was found in mutated NOTCH1 in the absence of +12 (HR, 2.2; 95% CI, 0.97-5.09), and this group comprised 14% of all VenG-treated patients. A trend for adverse outcome with NOTCH1 was also provided in the Murano trial.29 However, prospective analysis and further validation of this finding in other cohorts is necessarily required before drawing conclusions. Because of the short follow-up time of 28 months and the limited number of progression events after VenG, it may be too early to observe an effect of other candidate genes on PFS and OS.
The role of inactivated p53 on response to BCL2 inhibitors is still unclear, as preclinical models and ex vivo analyses provide inconclusive results.30,31 In clinical trials of relapsed patients with CLL, del(17p)/TP53mutated was associated with a higher risk for progression when treated with venetoclax alone or in combination with rituximab.23,32 A shorter duration of response with del(17p)/TP53mut was also found in a combined analysis of early venetoclax trials,33 and these results are supported by real-world data.34 Notably, all these data derived from pretreated patients, mainly after chemoimmunotherapy, whereas CLL14 is the first CLL trial with venetoclax in previously untreated patients that provides evidence for the prognostic value of genetic abnormalities, such as mutated TP53. In CLL14, all progression and death events of patients with del(17p) and/or mutated TP53 in the VenG group appeared when not receiving therapeutic doses of venetoclax. Most patients progressed after cycle 12, whereas in cases with early progression, venetoclax had been stopped because of adverse events. In 1 case, progression occurred after the first days of venetoclax initiation (with 20 mg). This is in line with the response data, as patients with del(17p) and/or mutated TP53 achieved high CR rates and MRD negativity with VenG in contrast to GClb. This indicates that in CLL14, worse outcome of these patients is a result of faster CLL regrow than primary resistance to venetoclax. A continuous treatment of patients with del(17p), as realized in the M13-982 trial, achieved durable remissions. Therefore, a longer treatment duration or a rechallenge with venetoclax appears reasonable and should be studied, particularly in this subset of patients.35,36 Another treatment concept is the combination with a third compound (ie, ibrutinib) in first-line treatment of ultra-high-risk CLL, which is the subject of clinical trials.37,38 Also, for ibrutinib, adverse outcome was observed in trials for del(17p)/TP53mut patients,39,40 although this could derive from the high co-incidence with complex karyotype.41,42 Recently published data on karyotype analyses in CLL14 did not show a significant effect on venetoclax efficacy.43 Also, Richter transformation as a mechanism of progression was rare in CLL14 and occurred in 2 patients treated with VenG and 1 patient with GClb therapy (not significant).
In summary, the management of high-risk CLL defined by del(17p) and/or mutated TP53 remains challenging in the era of novel compounds. Although del(17p) and mutated TP53 were associated with adverse outcome in both treatment groups, VenG improved PFS of these patients significantly, and affected patients should preferably be treated with a novel compound. Interestingly, in patients with trisomy 12 (18% of patients), there was no progression or death event with VenG during the observation period, which is a remarkable result with yet-unknown biologic background. In patients with normal fluorescence in situ hybridization karyotype defined on the basis of the hierarchical model, a benefit of VenG over GClb was not observed, although the majority of these patients had unmutated IGHV status (65%), and SF3B1 mutations were frequent with an incidence of 27%. Particularly in mutated IGHV, a significant difference between both treatment groups is not evident for PFS. In contrast to trials with chlorambucil alone as a comparator,44,45 GClb achieves durable remissions in patients with favorable prognostic markers, and therefore the short follow-up may be an important reason for nonsuperiority in such subgroups. At the current time, PFS data indicate that chemoimmunotherapy remains a valid treatment option in patients with mutated IGHV and turns IGHV status into a predictive factor, confirmed in a multivariable interaction analysis. However, given the effect of CR rate and especially MRD negativity on PFS, a superiority of VenG over GClb is also expected for PFS with longer follow-up. It has to be noted that all results from CLL14 provide evidence for a patient cohort with comorbidity and not eligible for intensive treatment. Therefore, the advantage of VenG over other first-line therapies in fit patients cannot be deduced from our results, but is a possibility, given a higher MRD-negativity rate than published for FCR in CLL8.46
In conclusion, genetic assessment, in particular for del(17p), remains important in CLL, as this study, despite the overall improvement, demonstrates a persistent adverse prognostic effect with VenG therapy. Furthermore, unmutated IGHV is a predictive factor identifying patients with particular benefit from VenG, and may therefore help to guide treatment decisions.
Genetic analyses were presented in part at the European Hematology Association annual meeting 2019 (oral presentation) and ICML 2019 (oral presentation, best abstract award submitted by a young investigator).
The online version of this article contains a data supplement.
The publication costs of this article were defrayed in part by page charge payment. Therefore, and solely to indicate this fact, this article is hereby marked “advertisement” in accordance with 18 USC section 1734.
Acknowledgments
The authors thank all patients, their families, and their physicians for trial participation and donation of samples. This work was supported by the Else Kröner-Fresenius-Stiftung (2010_Kolleg24), European Commission (01KT1601, FIRE CLL), Bundesministerium für Bildung und Forschung (031L0076C PRECISe), and Deutsche Forschungsgemeinschaft (SFB 1074 projects B1, B2). Genetic analyses were supported by AbbVie Inc and F. Hoffmann-La Roche Ltd (CLL14).
Authorship
Contribution: E.T., C.S., A.D., and J. Bloehdorn performed the genetic analyses; E.T., Y.J., L.B., D.M., and S.S. interpreted the data; E.T., D.M., H.D., and S.S. designed the research; E.T. and S.S. wrote the first version of the manuscript; S.R., C.Z., and J. Bahlo performed the statistical analysis; O.A.-S., B.E., M.T., K.H., W.S., M.P.L., K.F., and M.H. and designed and managed the clinical trial; O.A.-S., A.-M.F., B.E., and K.F. collected, analyzed, and interpreted the clinical data; M.R. and M.K. performed the MRD analyses; and all authors critically reviewed and approved the manuscript.
Conflict-of-interest disclosure: E.T. has received personal fees from Roche AG and personal fees and nonfinancial support from AbbVie during the conduct of the study; J. Bahlo has received nonfinancial support from Roche during the conduct of the study and personal fees and nonfinancial support from Roche outside the submitted work; O.A.-S. has received personal fees and nonfinancial support from AbbVie, Roche, Gilead, and Janssen outside the submitted work; M.R. has received grants from Roche/AbbVie and personal fees from Roche during the conduct of the study and personal fees from Roche and AbbVie outside the submitted work; A.-M.F. has received personal fees from Janssen Pharmaceutical outside the submitted work; B.E. has received grants and personal fees from Roche and AbbVie outside the submitted work; K.-A.K. has received grants and personal fees from Roche and AbbVie during the conduct of the study; M.T. has received personal fees from Roche Products Ltd outside the submitted work; K.H. and M.P.L. received personal fees from Roche during the submitted work; Y.J. reports receiving personal fees from Genentech outside the submitted work; M.K. has received grants from Roche and Mundipharma and travel support from Janssen during the conduct of the study. W.S. has received personal fees from AbbVie outside the submitted work; K.F. has received nonfinancial support from Roche during the conduct of the study; M.H. has received grants and personal fees from Roche and AbbVie during the conduct of the study and grants and personal fees from Gilead and Janssen and personal fees from Celgene and Boehringer Ingelheim outside the submitted work; S.S. has received grants, personal fees, and nonfinancial support from AbbVie and Hoffmann La-Roche during the conduct of the study and grants, personal fees, and nonfinancial support from AbbVie, Amgen, AstraZeneca, Celgene, Gilead, GSK, Hoffmann La-Roche, Janssen, Novartis, Pharmacyclics, and Sunesis outside the submitted work; C.S., S.R., C.Z., A.D., J. Bloehdorn, L.B., D.M., and H.D. declare no competing financial interests.
Correspondence: Stephan Stilgenbauer, Department of Internal Medicine III, Ulm University, Albert-Einstein-Allee 23, 89081 Ulm, Germany; e-mail: stephan.stilgenbauer@uniklinik-ulm.de.

This feature is available to Subscribers Only
Sign In or Create an Account Close Modal