

Key Points
We identified 4 oncogenic NTRK point mutations in patients with hematologic neoplasms that are amenable to FDA-approved Trk inhibitors.

Abstract
Much of what is known about the neurotrophic receptor tyrosine kinase (NTRK) genes in cancer was revealed through identification and characterization of activating Trk fusions across many tumor types. A resurgence of interest in these receptors has emerged owing to the realization that they are promising therapeutic targets. The remarkable efficacy of pan-Trk inhibitors larotrectinib and entrectinib in clinical trials led to their accelerated, tissue-agnostic US Food and Drug Administration (FDA) approval for adult and pediatric patients with Trk-driven solid tumors. Despite our enhanced understanding of Trk biology in solid tumors, the importance of Trk signaling in hematological malignancies is underexplored and warrants further investigation. Herein, we describe mutations in NTRK2 and NTRK3 identified via deep sequencing of 185 patients with hematological malignancies. Ten patients contained a point mutation in NTRK2 or NTRK3; among these, we identified 9 unique point mutations. Of these 9 mutations, 4 were oncogenic (NTRK2A203T, NTRK2R458G, NTRK3E176D, and NTRK3L449F), determined via cytokine-independent cellular assays. Our data demonstrate that these mutations have transformative potential to promote downstream survival signaling and leukemogenesis. Specifically, the 3 mutations located within extracellular (ie, NTRK2A203T and NTRK3E176D) and transmembrane (ie, NTRK3L449F) domains increased receptor dimerization and cell-surface abundance. The fourth mutation, NTRK2R458G, residing in the juxtamembrane domain, activates TrkB via noncanonical mechanisms that may involve altered interactions between the mutant receptor and lipids in the surrounding environment. Importantly, these 4 activating mutations can be clinically targeted using entrectinib. Our findings contribute to ongoing efforts to define the mutational landscape driving hematological malignancies and underscore the utility of FDA-approved Trk inhibitors for patients with aggressive Trk-driven leukemias.
Introduction
The neurotrophic receptor tyrosine kinases (NTRKs) are a family of genes, NTRK1, NTRK2, and NTRK3, encoding TrkA, TrkB, and TrkC receptors, respectively.1 These surface receptors consist of an extracellular domain for ligand binding, a single-pass transmembrane domain, and intracellular juxtamembrane and kinase domains. Upon ligand binding, these receptors homodimerize, which in turn leads to transphosphorylation of key tyrosine residues in the intracellular domain that further activate several downstream pathways including JAK/STAT, phosphatidylinositol 3-kinase (PI3K)/AKT, and RAS/MAPK to promote proliferation, differentiation, and survival.2
Apart from the seminal role these receptors play in the central and peripheral nervous system,3-7 oncofusions containing NTRKs have been implicated in pediatric and adult cancers, with the first fusion (ie, TPM3-NTRK1) reported in 1986 in a patient with colorectal cancer.1,2,8,9 Since then, fusions with NTRKs have been identified and characterized in many solid tumors, including congenital fibrosarcoma,10 secretory breast carcinoma,11 papillary thyroid carcinoma,12 and glioblastoma13 among others.14 The resultant chimeric Trk oncoproteins promote ectopic expression and constitutive kinase activity. Of the fusions identified, the ETV6-NTRK3 fusion, which juxtaposes the helix-loop-helix domain of transcription factor ETV6 and the kinase domain of NTRK3, has been intensively studied as a defining driver and diagnostic marker for many rare solid tumor malignancies.10,11,15,16
Although Trk-mediated cancers are rare (<1%), alterations in these receptors have recently emerged as promising therapeutic targets in solid tumors owing to the development of highly selective and durable inhibitors.17-21 Regardless of age or tumor origin, larotrectinib, a selective pan-Trk inhibitor, demonstrated robust antitumor activity with an overall response rate of 80%, culminating in its breakthrough US Food and Drug Administration (FDA) approval.19 Entrectinib, a pan-Trk, ROS1, and ALK inhibitor, has also shown efficacy against a broad range of histologies, including in patients with primary or secondary central nervous system disease.18 Its clinical utility resulted in its recent accelerated FDA approval.21
The tolerability and effectiveness of entrectinib and larotrectinib for Trk-positive solid tumors have sparked our interest in assessing the role of NTRKs in hematological malignancies. Studies thus far have primarily focused on ETV6-NTRK3 fusions in patients with acute myeloid leukemia (AML),22,23 chronic eosinophilic leukemia,24 and Philadelphia chromosome–like acute lymphoblastic leukemia (ALL).25,26 In animal models of AML, entrectinib treatment resulted in tumor regression and elimination of residual ETV6-NTRK3+ cancer cells from the marrow.27 More recently, after evaluating Trk fusions across 7,311 patients with hematologic malignancies, Taylor et al identified 4 previously unrecognized Trk oncofusions in patients who were sensitive to larotrectinib.28 They also reported partial remission in a patient with AML who harbored an ETV6-NTRK2 fusion following treatment with larotrectinib. Despite these and other studies,29,30 the significance of Trk signaling in leukemia largely remains unrecognized.31
Although Trk fusions represent the primary genetic alteration that confers oncogenic behavior in Trk-driven liquid tumors, point mutations in NTRK genes may also contribute to the tumorigenic process; however, this has not been rigorously investigated to date. Point mutations in the kinase domain of the NTRK genes have been previously reported in hematologic malignancies,32,33 although their functional significance remains uncertain. We recently sequenced primary samples from patients with hematologic malignancies and identified 9 novel point mutations in the NTRK2 or NTRK3 genes, many of which were found outside of the kinase domain. Of the 9 unique mutations we identified and tested, here, we show that 4 mutations hold oncogenic capacity, and cells transformed by these mutations are amenable to Trk inhibition. We also suggest a potential mechanism that drives the activation of these NTRK mutants and highlight major trends revealed through our functional genomics screens involving small-molecule inhibitors and small-interfering RNA (siRNA) perturbation that were conducted on malignant cells from patients harboring the specific NTRK mutations we herein report.
Materials and methods
Complete methods are provided in supplemental Materials and methods (available on the Blood Web site).
Sequencing of patient samples
Clinical specimens were collected with informed consent from patients according to a protocol approved by Oregon Health & Science University Institutional Review Board 4422 (NCT01728402). Deep sequencing was performed on 185 patient samples, including 96 AML, 51 ALL, and 38 myeloproliferative neoplasms (MPNs).34,35 NTRK mutations were confirmed via Sanger sequencing and engineered into murine Ba/F3 cells35,36 (supplemental Table 1).
Statistical analysis
Mean plus or minus standard error of the mean (SEM) are shown unless otherwise stated. One-way or 2-way analysis of variance (ANOVA) with the Tukey multiple comparison test were used to determine statistical significance. Statistical analysis was conducted using GraphPad Prism version 8.0. P values <.05 were deemed significant.
Results
Identification of oncogenic NTRK point mutations in patient samples
Deep sequencing using a custom capture library consisting of 1862 kinase and kinase-associated genes in 185 leukemia samples revealed NTRK point mutations in 10 patients (5.4%) diagnosed with hematologic malignancies (Figure 1A). NTRK2R458G was identified in 2 patients.
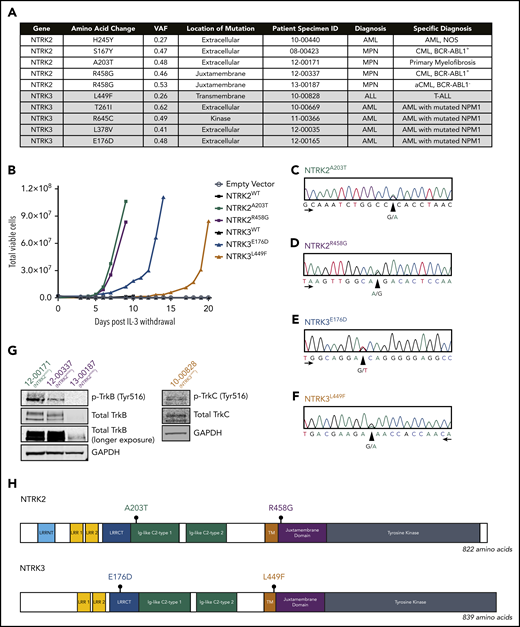
Identification of 4 oncogenic NTRK point mutations in patient samples. (A) Among the 185 patient samples sequenced using a custom capture library consisting of 1862 kinase and kinase-associated genes, 10 patients harbored a mutation in 1 of the NTRK genes. The NTRK2R458G mutation was found in 2 patients. Mutations are organized by gene and diagnosis. Patient specimen identifier (ID) is also provided. (B) NTRK2A203T, NTRK2R458G, NTRK3E176D, and NTRK3L449F mutations transform the murine Ba/F3 pro-B cell line and enable interleukin 3 (IL-3)–independent growth. No growth was observed in Ba/F3 cells harboring an empty vector (pMX-puro) or wild-type (WT) NTRK2 or NTRK3. Total viable cells are plotted over time and cell growth was measured after the withdrawal of IL-3. This experiment was repeated at least twice with consistent results. Additional validation studies are found in supplemental Figure 2. (C-F) Electropherograms from Sanger sequencing of patient genomic DNA confirm the presence of NTRK2A203T, NTRK2R458G, NTRK3E176D, and NTRK3L449F mutations. Peaks correspond to the following nucleotides: A (green), T (red), C (blue), and G (black). Arrows indicate direction of sequencing. (G) Immunoblot analysis of total and phosphorylated TrkB (p-TrkB) and TrkC (p-TrkC) on patient samples with known NTRKA203T (12-00171), NTRKR458G (12-00337 and 13-00187), and NTRK3L449F (10-00828) mutations. (H) Gene schematics depict the location of prioritized NTRK2 and NTRK3 point mutations. The location of the following domains is included: leucine-rich repeat (LRR) N-terminal domain (LRRNT; NTRK2-specific), LRR 1, LRR 2, LRR C-terminal domain (LRRCT), immunoglobulin (Ig)-like C2-type 1, Ig-like C2-type 2, transmembrane (TM), juxtamembrane, and tyrosine kinase. aCML, atypical CML; CML, chronic myeloid leukemia; GAPDH, glyceraldehyde-3-phosphate dehydrogenase; MPN, myeloproliferative neoplasm; NOS, not otherwise specified; VAF, variant allele frequency.
Identification of 4 oncogenic NTRK point mutations in patient samples. (A) Among the 185 patient samples sequenced using a custom capture library consisting of 1862 kinase and kinase-associated genes, 10 patients harbored a mutation in 1 of the NTRK genes. The NTRK2R458G mutation was found in 2 patients. Mutations are organized by gene and diagnosis. Patient specimen identifier (ID) is also provided. (B) NTRK2A203T, NTRK2R458G, NTRK3E176D, and NTRK3L449F mutations transform the murine Ba/F3 pro-B cell line and enable interleukin 3 (IL-3)–independent growth. No growth was observed in Ba/F3 cells harboring an empty vector (pMX-puro) or wild-type (WT) NTRK2 or NTRK3. Total viable cells are plotted over time and cell growth was measured after the withdrawal of IL-3. This experiment was repeated at least twice with consistent results. Additional validation studies are found in supplemental Figure 2. (C-F) Electropherograms from Sanger sequencing of patient genomic DNA confirm the presence of NTRK2A203T, NTRK2R458G, NTRK3E176D, and NTRK3L449F mutations. Peaks correspond to the following nucleotides: A (green), T (red), C (blue), and G (black). Arrows indicate direction of sequencing. (G) Immunoblot analysis of total and phosphorylated TrkB (p-TrkB) and TrkC (p-TrkC) on patient samples with known NTRKA203T (12-00171), NTRKR458G (12-00337 and 13-00187), and NTRK3L449F (10-00828) mutations. (H) Gene schematics depict the location of prioritized NTRK2 and NTRK3 point mutations. The location of the following domains is included: leucine-rich repeat (LRR) N-terminal domain (LRRNT; NTRK2-specific), LRR 1, LRR 2, LRR C-terminal domain (LRRCT), immunoglobulin (Ig)-like C2-type 1, Ig-like C2-type 2, transmembrane (TM), juxtamembrane, and tyrosine kinase. aCML, atypical CML; CML, chronic myeloid leukemia; GAPDH, glyceraldehyde-3-phosphate dehydrogenase; MPN, myeloproliferative neoplasm; NOS, not otherwise specified; VAF, variant allele frequency.
To assess the oncogenic capacity of these mutations, we stably expressed them in Ba/F3 cells, a murine interleukin 3 (IL-3)-dependent pro-B-cell line that provides a well-established transformation model.37 Certain oncogenes transform Ba/F3 cells by permitting sustained proliferation in the absence of IL-3. Of the 9 unique mutations we identified and tested, 4 conferred IL-3 independent growth: NTRK2A203T, NTRK2R458G, NTRK3E176D, and NTRK3L449F. Going forward, these 4 mutants were prioritized for further characterization. Ba/F3 cells expressing wild-type (WT) NTRK2, NTRK3, and empty vector (pMX-puro) were unable to grow without IL-3 (Figure 1B). Similarly, mutants NTRK2S167Y, NTRK2H245Y, NTRK3T261I, NTRK3L378V, and NTRK3R645C did not exhibit oncogenic capacity (supplemental Figure 1).
Independent of the Ba/F3 model, NTRK WT and prioritized mutants were transiently transfected into HEK 293T/17 cells. We observed robust Trk phosphorylation with NTRK mutant cells compared with WT following serum starvation (supplemental Figure 2).
We confirmed the presence of NTRK2A203T, NTRK2R458G, NTRK3E176D, and NTRK3L449F in patient samples via Sanger sequencing of genomic DNA (Figure 1C-F) and immunoblotting (Figure 1G). Protein lysates from available clinical samples indicated expression and phosphorylation of TrkB or TrkC in patients with the NTRK2A203T, NTRK2R458G, and NTRK3L449F mutations (Figure 1G). Protein lysate for the patient with NTRK3E176D was unavailable.
NTRK2A203T was found in a patient with primary myelofibrosis and resides within the extracellular domain. NTRK2R458G, located within the juxtamembrane domain, was observed in 2 patients, 1 with chronic myeloid leukemia (CML) and the other with atypical CML (Figure 1H). NTRK3E176D was observed in a patient with NPM1-mutated AML and found within the extracellular domain. NTRK3L449F was seen in a patient with T-cell ALL and is located within the transmembrane domain (Figure 1H). Available information about patient variant allele frequency (VAF) and co-occurring mutations is provided in supplemental Table 3. It should be noted that the capture library is focused on kinase-associated genes, and there may, therefore, be other mutations present in other gene families now known to be prevalent in leukemia that were not assessed using this platform.
Analysis of sequence alignment of NTRK2 genes from different species suggests that the R458 residue is a highly conserved residue throughout evolution whereas A203 was conserved only among mammals (supplemental Figure 3). Sequence alignment of multiple NTRK3 homologs shows that both E176 and L449 are also highly conserved throughout evolution (supplemental Figure 4). As such, these alignment studies suggest that these residues may contribute to the structure and biologic function of the TrkB and TrkC receptors, implicating that mutations in such residues may have functional consequences. In our analysis of cBioPortal, The Cancer Genome Atlas, PeCan, and COSMIC, we saw that our transforming mutants fell in regions of the NTRK genes in which similar mutations have been identified in other cancers, further supporting our hypothesis that these mutants may contribute to leukemogenesis (supplemental Figure 5).
Prioritized NTRK mutants exhibit increased Trk signaling and confer entrectinib sensitivity
Immunoblot analysis revealed increased phosphorylation of TrkB (Tyr516) or TrkC (Tyr516) in mutant-transformed Ba/F3 cells relative to parental Ba/F3 cells or cells transfected with WT NTRK or empty vectors (pMX-puro) (Figure 2A-B). Furthermore, NTRK2 and NTRK3 mutant-driven cells exhibited enhanced phosphorylation of AKT (Ser473) and extracellular signal-regulated kinase (ERK; Thr202/Tyr204) compared with WT cells, suggesting the importance of MAPK and PI3K/AKT signaling in promoting the survival of these oncogenic cells. Although phosphorylation of STAT3 (Tyr705) was significantly increased in Ba/F3 cells transfected with both NTRK3 mutants, it was increased in only 1 of the NTRK2 mutants (A203T). Upregulation of SRC phosphorylation (Tyr527) was only observed with Ba/F3 cells transfected with NTRK2 mutants. No significant difference was seen with phosphorylation of STAT5 (Tyr694) between WT and mutant NTRK2 or NTRK3 Ba/F3 cells (Figure 2A-B).
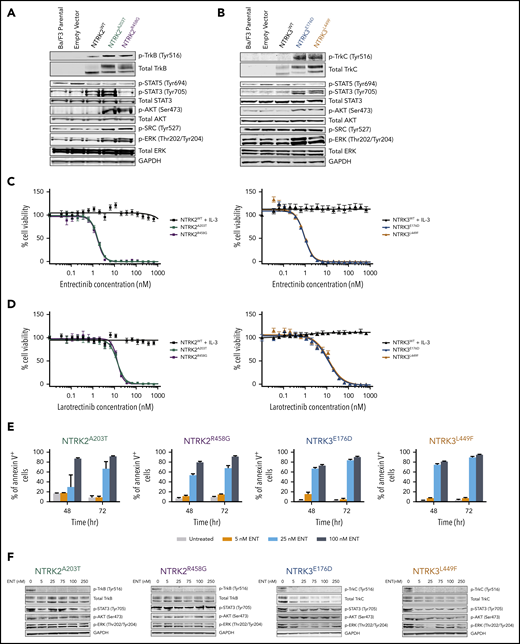
NTRK2 and NTRK3 mutants are constitutively phosphorylated and sensitive to Trk inhibition. (A-B) Expression of total and phosphorylated TrkB and TrkC is increased in mutant-transformed Ba/F3 cells relative to WT cells. All mutants phosphorylate canonical downstream effectors, AKT and extracellular signal-regulated kinase (ERK). STAT3 phosphorylation was not evident in NTRK2R458G. Both NTRK2 mutants result in increased SRC phosphorylation. GAPDH served as a loading control. Prior to lysis, WT cells were grown in IL-3–supplemented media and all lines were starved overnight in 0.1% bovine serum albumin (BSA) RPMI. (C-D) NTRK mutants are sensitive to entrectinib and larotrectinib. Six replicates of WT and mutant NTRK2 and NTRK3 Ba/F3 cells were plated with varying concentrations of entrectinib and larotrectinib for 72 hours. NTRK2WT and NTRK3WT cells were plated in media supplemented with IL-3. Cell viability was determined using a tetrazolamine-based viability assay. Viability is represented as a percentage of the untreated control. The average mean plus or minus SEM is shown. Additional validation studies are found in supplemental Figure 6B. (E) Mutant-transformed Ba/F3 cells were starved overnight in 0.1% BSA RPMI and then treated with increasing concentrations of entrectinib (ENT) for ∼16 hours and immunoblotted for Trk and downstream effectors. (F) ENT induces apoptosis in mutant-transformed Ba/F3 cells following 48 and 72 hours. Annexin V staining was performed in triplicate. The average mean plus or minus SEM is shown. Validation studies in supplemental Figure 6C. p-AKT, phosphorylated AKT; p-ERK, phosphorylated ERK; p-SRC, phosphorylated SRC; p-STAT, phosphorylated STAT.
NTRK2 and NTRK3 mutants are constitutively phosphorylated and sensitive to Trk inhibition. (A-B) Expression of total and phosphorylated TrkB and TrkC is increased in mutant-transformed Ba/F3 cells relative to WT cells. All mutants phosphorylate canonical downstream effectors, AKT and extracellular signal-regulated kinase (ERK). STAT3 phosphorylation was not evident in NTRK2R458G. Both NTRK2 mutants result in increased SRC phosphorylation. GAPDH served as a loading control. Prior to lysis, WT cells were grown in IL-3–supplemented media and all lines were starved overnight in 0.1% bovine serum albumin (BSA) RPMI. (C-D) NTRK mutants are sensitive to entrectinib and larotrectinib. Six replicates of WT and mutant NTRK2 and NTRK3 Ba/F3 cells were plated with varying concentrations of entrectinib and larotrectinib for 72 hours. NTRK2WT and NTRK3WT cells were plated in media supplemented with IL-3. Cell viability was determined using a tetrazolamine-based viability assay. Viability is represented as a percentage of the untreated control. The average mean plus or minus SEM is shown. Additional validation studies are found in supplemental Figure 6B. (E) Mutant-transformed Ba/F3 cells were starved overnight in 0.1% BSA RPMI and then treated with increasing concentrations of entrectinib (ENT) for ∼16 hours and immunoblotted for Trk and downstream effectors. (F) ENT induces apoptosis in mutant-transformed Ba/F3 cells following 48 and 72 hours. Annexin V staining was performed in triplicate. The average mean plus or minus SEM is shown. Validation studies in supplemental Figure 6C. p-AKT, phosphorylated AKT; p-ERK, phosphorylated ERK; p-SRC, phosphorylated SRC; p-STAT, phosphorylated STAT.
We next sought to identify inhibitors that could abrogate Trk signaling with the following tyrosine kinase inhibitors: BGJ398, cabozantinib, crenolanib, crizotinib, entrectinib, foretinib, imatinib, and ponatinib (supplemental Figure 6A). Of these, cabozantinib,38 crizotinib,25,27,39 entrectinib,27 and foretinib40 have been previously reported to have activity against NTRK and its orthologs, ROS1 and ALK. Apart from BGJ398 (pan-FGFR inhibitor) and imatinib (BCR-ABL1 inhibitor), which served as negative controls, all other tested inhibitors reduced the growth and viability of our mutant-transformed NTRK Ba/F3 cells to varying degrees (supplemental Figure 6A; supplemental Table 4). Entrectinib was the most potent inhibitor with a 50% inhibitory concentration (IC50) of 1.644 nM for NTRK2A203T, 1.566 nM for NTRK2R458G, 0.9794 nM for NTRK3E176D, and 1.015 nM for NTRK3L449F Ba/F3 cells (Figure 2C). With the recent accelerated FDA approval of larotrectinib for NTRK-positive solid tumors, we also tested the sensitivity of larotrectinib on our mutant Ba/F3 cell lines.19,41 Larotrectinib inhibited cell growth with an IC50 of 12.91 nM for NTRK2A203T, 13.42 nM for NTRK2R458G, 11.46 nM for NTRK3E176D, and 12.97 nM for NTRK3L449F Ba/F3 cells (Figure 2D). These data suggest that our 4 NTRK point mutations are highly sensitive to selective NTRK inhibitors. In all cases, WT NTRK Ba/F3 cells grown in IL-3–supplemented media were completely insensitive to all inhibitors.
As a consequence of entrectinib’s potency in our mutant-transformed Ba/F3 cell lines, we further characterized its cytotoxicity and specificity. We saw increased apoptosis following 48 and 72 hours of entrectinib treatment in all mutant-driven Ba/F3 cells (Figure 2E). Entrectinib did not induce apoptosis in Ba/F3 cells harboring the BCR-ABL1 oncogene or empty vector (pMX-puro), indicating that the cell death we observed in NTRK-transformed Ba/F3 cells is not due to entrectinib’s off-target toxicity but due to its specificity for NTRK (supplemental Figure 6B-C).
Upon treating our NTRK mutant-transformed Ba/F3 cells with entrectinib (0, 5, 25, 75, 100, and 250 nM), we observed a decrease in expression of total and phosphorylated TrkB and TrkC in all mutants (Figure 2F). However, we saw a varying degree of inhibition of STAT3, AKT, and ERK phosphorylation, suggesting some variability in downstream signaling among the mutants.
Increased cell-surface abundance of Trk receptors seen with mutants NTRK2A203T, NTRK2E176D, and NTRK3L449F
To begin to understand how our NTRK mutants lead to kinase activation, we modeled the impact of the amino acid change to the secondary structure of the Trk receptors using a previously published protein prediction model, Protein Homology/analogY Recognition Engine V 2.0 (Phyre2 ).42 Although NTRK2A203T was predicted to result in a partial loss of the β-pleated sheet, NTRK2R458G was predicted to shift the stretch of amino acids that contribute to the transmembrane domain α helix and increase the helix by 1 amino acid (supplemental Figure 7A-B). In the case of NTRK3, both mutations were predicted to replace β-pleated sheets found in the WT receptor with α helices (supplemental Figure 8A-B).
These predicted changes in secondary structure led us to hypothesize that our NTRK mutants may alter cell-surface localization and retention of the TrkB and TrkC receptors. To test our hypothesis, we measured cell-surface localization and retention via flow cytometry using allophycocyanin (APC)-conjugated anti-TrkB or anti-TrkC antibodies. These flow antibodies were validated on human glioblastoma cell lines that endogenously express TrkB or TrkC (supplemental Figure 9A-B). NTRK2A203T resulted in an approximately twofold increase in the abundance of TrkB receptor on the cell surface relative to WT (P = 0.002; Figure 3A). No significant difference in TrkB receptor localization was observed between NTRK2R458G and WT receptor (P = 0.6436; Figure 3A). Although both NTRK3 mutations resulted in increased receptor localization statistically compared with the WT receptor (P < 0.0001), the biological significance of this finding is uncertain as evident by the small increase observed (Figure 3B; supplemental Figure 9E-F).
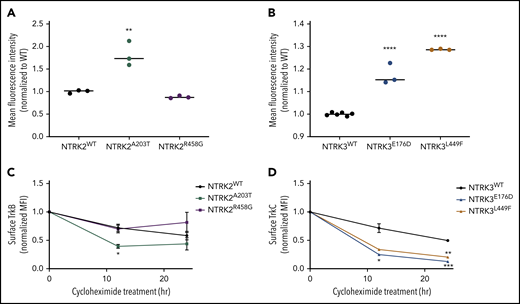
Mutants NTRK2A203T, NTRK3E176D, and NTRK3L449F increase Trk cell-surface localization but not retention. (A-B) To assess differences in mutant receptor localization, WT and mutant Ba/F3 cells were stained with APC-conjugated anti-TrkB or anti-TrkC antibodies and analyzed by flow cytometry. A significantly higher localization of Trk receptors was observed with NTRK2A203T, NTRK3E176D, and NTRK3L449F mutants relative to their respective WT receptor. Validation of APC-conjugated Trk flow antibodies is shown in supplemental Figure 9C-D. (C-D) To assess receptor retention at the cell surface, WT and mutant NTRK2 and NTRK3 Ba/F3 cells were treated with 100 µg/mL cycloheximide for 12 or 24 hours, stained with APC-conjugated anti-TrkB or anti-TrkC antibodies, and analyzed via flow cytometry. Following 12 hours, NTRK2A203T was less stable than NTRK2WT. Both NTRK3 mutants were less stable than NTRK3WT after 12 and 24 hours of cycloheximide treatment. Normalized mean fluorescence intensity (MFI) is shown over time. For all experiments, WT Ba/F3 cells were grown in IL-3–supplemented media and all lines were starved overnight in 0.1% BSA RPMI. Staining was performed in triplicate. Statistical significance was assessed by a 1-way or 2-way ANOVA followed by a Tukey multiple comparison test. All statistical comparisons shown are between WT and mutant receptors. The average mean plus or minus SEM is shown. *P < .05; **P < .01; ***P < .001; ****P < .0001.
Mutants NTRK2A203T, NTRK3E176D, and NTRK3L449F increase Trk cell-surface localization but not retention. (A-B) To assess differences in mutant receptor localization, WT and mutant Ba/F3 cells were stained with APC-conjugated anti-TrkB or anti-TrkC antibodies and analyzed by flow cytometry. A significantly higher localization of Trk receptors was observed with NTRK2A203T, NTRK3E176D, and NTRK3L449F mutants relative to their respective WT receptor. Validation of APC-conjugated Trk flow antibodies is shown in supplemental Figure 9C-D. (C-D) To assess receptor retention at the cell surface, WT and mutant NTRK2 and NTRK3 Ba/F3 cells were treated with 100 µg/mL cycloheximide for 12 or 24 hours, stained with APC-conjugated anti-TrkB or anti-TrkC antibodies, and analyzed via flow cytometry. Following 12 hours, NTRK2A203T was less stable than NTRK2WT. Both NTRK3 mutants were less stable than NTRK3WT after 12 and 24 hours of cycloheximide treatment. Normalized mean fluorescence intensity (MFI) is shown over time. For all experiments, WT Ba/F3 cells were grown in IL-3–supplemented media and all lines were starved overnight in 0.1% BSA RPMI. Staining was performed in triplicate. Statistical significance was assessed by a 1-way or 2-way ANOVA followed by a Tukey multiple comparison test. All statistical comparisons shown are between WT and mutant receptors. The average mean plus or minus SEM is shown. *P < .05; **P < .01; ***P < .001; ****P < .0001.
To evaluate alterations in protein retention at the cell surface, we performed a time-course experiment (12 and 24 hours) by treating serum-starved WT and mutant NTRK2 and NTRK3 Ba/F3 cell lines with 100 µg/mL cycloheximide followed by flow staining for cell-surface expression of TrkB and TrkC. Following 12 hours of cycloheximide treatment of Ba/F3 cells expressing the NTRK2 mutants or WT, NTRK2A203T possessed a decreased half-life relative to WT TrkB receptor (P = .0410; Figure 3C). At 24 hours, no difference in protein retention at the cell surface was observed between the NTRK2 mutants or NTRK2WT Ba/F3 cells. Both NTRK3 mutants were less stable than WT TrkC receptor following 12 hours of cycloheximide, with the difference between WT and NTRK3E176D resulting in statistical significance (P = .0481; Figure 3D). After 24 hours of cycloheximide treatment, both NTRK3 mutants were found at lower levels at the surface relative to NTRK3WT (P = .0007 for NTRK3E176D and P = .0012 for NTRKL449F; Figure 3D). Despite higher surface expression of NTRK2A203T and NTRK3E176D/L449F (Figure 3A-B), this was not due to an increase in protein retention at the cell surface, and in fact the mutated isoforms had shorter cell-surface half-lives.
NTRK2A203T, NTRK3E176D, and NTRK3L449F mutants increase receptor dimerization
Another possible explanation for increased concentration of NTRK2A203T, NTRK3E176D, and NTRK3L449F at the cell surface despite decreased cell-surface retention (Figure 3) is increased receptor dimerization. To this end, we created and cotransfected C-terminal FLAG- and hemagglutinin (HA)-tagged vectors for all WT and NTRK mutants in HEK 293/T17 cells. Dimerization was measured by immunoprecipitating the FLAG-tagged construct followed by immunoblotting for HA (Figure 4A). A higher ratio of HA to FLAG immunoprecipitation was indicative of increased receptor dimerization.
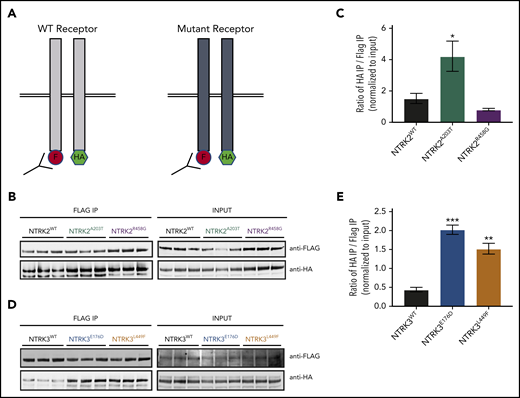
NTRK2A203T , NTRK3E176D , and NTRK3L449F exhibit increased receptor dimerization in comparison with their respective WT receptor. (A) Schematic of NTRK dimerization studies. A total of 0.5 µg of FLAG (F)- and hemagglutinin (HA)-tagged NTRK WT or mutant constructs were cotransfected into HEK293T/17 cells and immunoprecipitated (IP) using anti-FLAG beads. FLAG immunoprecipitates were then probed with an anti-HA antibody to detect the coimmunoprecipitating receptor, suggestive of receptor dimerization. The level of HA and FLAG coimmunoprecipitation was quantified using ImageJ and normalized to input. A higher ratio of HA to FLAG immunoprecipitation was indicative of increased receptor dimerization. (B-C) Immunoblot analysis and quantification of WT and mutant NTRK2 constructs suggest that the NTRK2A203T mutation caused increased receptor dimerization. (D-E) Increased receptor dimerization was seen with both NTRK3 mutants relative to WT as evident by immunoblot and quantification analysis. For all experiments, statistical significance was assessed by a 1-way ANOVA followed by a Tukey multiple comparison test. All statistical comparisons shown are between WT and mutant receptors. Three biological replicates were performed for each condition. Each experiment was performed at least twice with consistent results. The average mean plus or minus SEM is shown. *P < .05; **P < .01; ***P < .001.
NTRK2A203T , NTRK3E176D , and NTRK3L449F exhibit increased receptor dimerization in comparison with their respective WT receptor. (A) Schematic of NTRK dimerization studies. A total of 0.5 µg of FLAG (F)- and hemagglutinin (HA)-tagged NTRK WT or mutant constructs were cotransfected into HEK293T/17 cells and immunoprecipitated (IP) using anti-FLAG beads. FLAG immunoprecipitates were then probed with an anti-HA antibody to detect the coimmunoprecipitating receptor, suggestive of receptor dimerization. The level of HA and FLAG coimmunoprecipitation was quantified using ImageJ and normalized to input. A higher ratio of HA to FLAG immunoprecipitation was indicative of increased receptor dimerization. (B-C) Immunoblot analysis and quantification of WT and mutant NTRK2 constructs suggest that the NTRK2A203T mutation caused increased receptor dimerization. (D-E) Increased receptor dimerization was seen with both NTRK3 mutants relative to WT as evident by immunoblot and quantification analysis. For all experiments, statistical significance was assessed by a 1-way ANOVA followed by a Tukey multiple comparison test. All statistical comparisons shown are between WT and mutant receptors. Three biological replicates were performed for each condition. Each experiment was performed at least twice with consistent results. The average mean plus or minus SEM is shown. *P < .05; **P < .01; ***P < .001.
We saw an approximately twofold increase in dimerization with NTRK2A203T relative to NTRK2WT (P = .0405; Figure 4B-C). NTRK2R458G exhibited no increase in dimerization (P = .6751; Figure 4B-C). Both NTRK3 mutants had a statistically significant increase in dimerization relative to WT NTRK3 (fourfold increase [P = .0002] for NTRK3E176D and threefold increase [P = .0013] for NTRK3L449F; Figure 4D-E).
TrkB and TrkC are expressed in patients with leukemia and sensitive to small-molecule inhibitors and siRNAs
To identify functional targets in primary patient samples, peripheral mononuclear white blood cells from patients carrying the NTRK2A203T (12-00171; Figure 5A), NTRK2R458G (12-00337; Figure 5B), and NTRK3L449F (10-00828; Figure 5C) mutations were assayed ex vivo against panels of small-molecule inhibitors or siRNAs.43,44 Among the various small-molecule drug families, we saw an increased sensitivity to PI3K/AKT/mammalian target of rapamycin (mTOR) and type III receptor tyrosine kinase (RTK)/vascular endothelial growth factor inhibitors in the patient harboring the NTRK2A203T mutation (Figure 5A). As for the patient with the NTRK2R458G mutation, among the tested inhibitors, this patient sample showed enhanced sensitivity to an NF-κB activation inhibitor, crizotinib (an inhibitor of Trk/ALK/ROS1), and LY294002 (a PI3K inhibitor) (Figure 5B). It should be noted that entrectinib and larotrectinib had not been developed at the time of patient sample accrual. Because ex vivo inhibitor testing can only be done on fresh samples at the time of sample procurement, we cannot comment on how these patients would respond to these 2 inhibitors. Reduced cell viability in the presence of siRNA targeting NTRK2 and NTRK3 was observed with the patient containing the NTRK3L449F mutation, suggesting that these cells may exhibit dependence on NTRK2 and NTRK3 for cell survival. The knockdown of NTRK2 significantly altered cell viability (Figure 5C).
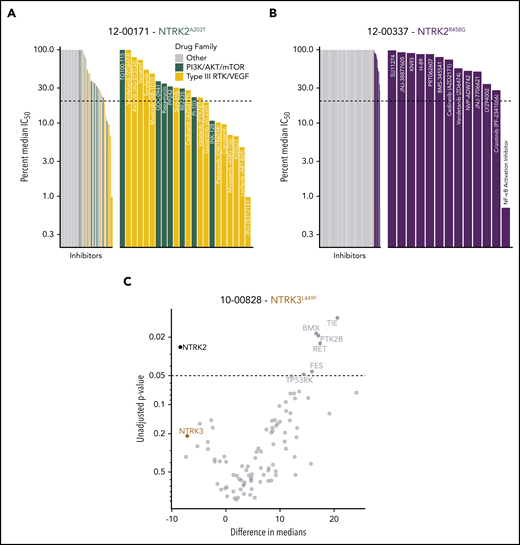
Patients with leukemia harboring NTRK mutations show altered sensitivity to small-molecule inhibitors of various signaling pathways. (A) Inhibitor profile for patient 12-00171, with the IC50 response to each inhibitor shown on a log10 scale relative to the median IC50 of all primary samples tested to date. Dotted line indicates 20% of the median IC50, which has historically been a marker for patient samples remarkably sensitive to a screened inhibitor.34,44 Inhibitors targeting the indicated families are colored, and then emphasized with the breakout panel on the right (drugs targeting other families are removed from the chart). (B) Inhibitor profile for patient 12-00337, all drugs with IC50 responses less than the median IC50 are shown in the breakout panel on the right and labeled. (C) siRNA screen targeting tyrosine kinases in patient 10-00828. Targets are compared against nontargeting control, with unadjusted P values derived from a Student 2-tailed t test (n = 3 for each target) shown on the y-axis (negative log10 scale), and effect size shown as difference in median viability on the x-axis. NTRK2 and NTRK3 knockdown resulted in reduced cell viability.
Patients with leukemia harboring NTRK mutations show altered sensitivity to small-molecule inhibitors of various signaling pathways. (A) Inhibitor profile for patient 12-00171, with the IC50 response to each inhibitor shown on a log10 scale relative to the median IC50 of all primary samples tested to date. Dotted line indicates 20% of the median IC50, which has historically been a marker for patient samples remarkably sensitive to a screened inhibitor.34,44 Inhibitors targeting the indicated families are colored, and then emphasized with the breakout panel on the right (drugs targeting other families are removed from the chart). (B) Inhibitor profile for patient 12-00337, all drugs with IC50 responses less than the median IC50 are shown in the breakout panel on the right and labeled. (C) siRNA screen targeting tyrosine kinases in patient 10-00828. Targets are compared against nontargeting control, with unadjusted P values derived from a Student 2-tailed t test (n = 3 for each target) shown on the y-axis (negative log10 scale), and effect size shown as difference in median viability on the x-axis. NTRK2 and NTRK3 knockdown resulted in reduced cell viability.
Discussion
Inhibitors targeting Trk oncofusions have shown dramatic and durable responses in pediatric and adult patients with solid tumors regardless of histology.17-19,21,45 The success of these inhibitors has reinvigorated interest in delineating the contribution of Trk signaling in hematologic tumors. Similar to FLT3, KIT, colony-stimulating factor 1 receptor (CSF1R), CSF2Rβ, CSF3R, and platelet-derived growth factor receptor β (PDGFRβ), previous studies have suggested that Trk receptors and their respective ligands also contribute to different stages of hematopoiesis.36,46-48 Trk receptors are expressed on hematopoietic cells and mesenchymal stromal cells found within the bone marrow microenvironment.49 They promote proliferation and survival of dendritic cells, lymphocytes, macrophages, and monocytes.47 In particular, TrkB is highly expressed on immature thymocytes and its expression declines as T cells differentiate.50 Marrow stromal cells secrete nerve growth factor that binds to TrkA on hematopoietic cells.49 However, apart from these studies, a clear functional role of Trk signaling in normal hematopoiesis remains undefined.
There is increasing evidence highlighting Trk receptors in leukemogenesis.31 Differing from the activation of ABL1, which is predominantly driven by the BCR-ABL1 fusion, Trks can be activated by much broader mechanisms, including oncogenic fusions,22,25,28 deletion/truncation events,51,52 transcriptional upregulation,40,53,54 and point mutations32,33 in leukemia.
In this study, we identified and characterized 4 novel oncogenic NTRK point mutations in patients with leukemia: 2 in NTRK2 (A203T, R458G) and 2 in NTRK3 (E176D, L449F) (Figure 1H). Although point mutations in similar regions have been reported in solid tumors (supplemental Figure 5), to our knowledge, we are the first to study and characterize these mutations in hematological malignancies. Due to the unavailability of a matched skin biopsy, we were unable to confirm whether these mutations are somatic or germline. Although they are not found in the COSMIC database, it should be noted that the NTRK2A203T mutation has been reported in ExAC, albeit at a very low allele frequency55 (supplemental Table 3). Collectively, our data in combination with others accentuate a previously underestimated role of NTRK point mutations in a subset of patients with leukemia and propel the need to consider Trk inhibitors for such patients clinically.
We saw that point mutations A203T and E176D in the extracellular domain of TrkB and TrkC receptors, respectively, transformed Ba/F3 cells and led to increased phosphorylation of the Trk receptor and its downstream effectors, RAS/MAPK, PI3K/AKT, and JAK/STAT signaling. Both point mutations also exhibited increased receptor dimerization (Figure 4). Our data are in agreement with the deltaTrkA mutation found in a patient with AML.51 This in-frame mutation contains a 75-amino acid deletion in the extracellular domain of the TrkA receptor that resulted in constitutive kinase activity, activation of downstream signaling, transformation of fibroblasts in vitro, and polyclonal AML in mice transplanted with deltaTrkA+ cells.51,52 Deletion of the 75 amino acids likely alters the tertiary structure of the receptor and results in the removal of key glycosylation sites that prevent spontaneous receptor-receptor interactions (ie, dimerization).56 Previous work from our laboratory has also shown that the T618I point mutation in CSF3R abrogates an O-glycosylation event, which in turn increases receptor dimerization.57 As evident by both studies, the extracellular domain, particularly glycosylation sites within this domain, could serve as a regulatory switch that prevents spontaneous dimerization and kinase activation.
In line with these findings, we speculate that NTRK2A203T and NTRK3E176D disrupt nearby N-glycosylation sites at residues 205 of TrkB and 163 of TrkC, enabling receptor dimerization (Figure 4) and, thus, supporting the aberrant kinase activity we observed (Figure 2A-B). NTRK3E176D could also disrupt disulfide bond formation between cysteines at residues 166 and 207 and thereby distort the receptor’s tertiary structure leading to aberrant signaling. The increase in NTRK2A203T and NTRK3E176D receptor molecules at the cell surface and decrease in cell-surface retention (Figure 3A,C) further reinforce that receptor dimerization is possibly the predominant mechanism of activation for these mutants. It is likely that increased abundance of cell-surface receptor molecules could facilitate increased dimerization events, culminating in increased receptor internalization, which is further supported by the decrease we saw in surface retention of the mutant receptors.
We also saw an increased propensity to dimerize with our transmembrane domain mutant, NTRK3L449F (Figure 4C-D). Transmembrane domain mutations have been shown to cause constitutive receptor activation through receptor stabilization, which increases kinase activity and downstream oncogenic signaling.36,58,59 For example, previous work from our laboratory has shown that a transmembrane domain mutation in CSF2Rβ R461C resulted in prolonged surface retention of the mutant receptor relative to the WT receptor in a patient with T-ALL.36 A very similar finding was seen with activating mutations in the IL7 receptor again in patients with T-ALL.59 Receptor stability, in both studies, stemmed from the formation of disulfide bonds between cysteine residues that were introduced by the respective point mutations. Although we saw a similar downstream signaling profile for the NTRK3L449F mutant, in our case, disulfide bond formation was not the underlying activation mechanism. Increased dimerization exhibited by NTRK3L449F could potentially be explained by the change in secondary protein structure. Our Phyre2 modeling predicted that a leucine to phenylalanine alteration results in a shift from a β-pleated sheet to an α helix (supplemental Figure 8B). The α helix is possibly more conducive for receptor dimerization.
Unlike the extracellular and transmembrane domain NTRK mutants, NTRK2R458G did not induce increased receptor dimerization (Figure 4A-B). Nonetheless, we saw robust kinase activation (Figure 2A) and oncogenicity (Figure 1B), signifying that dimerization may not serve as the underlying activation mechanism. It should be noted that the arginine residue at position 458 is conserved in all 3 NTRK genes and, therefore, may play an important function in Trk regulation (supplemental Figure 10A).
Given the proximity of the R458 residue to the TrkB transmembrane domain, we examined whether NTRK2R458G altered the transmembrane domain and whether this change influenced receptor-receptor interactions or interactions between the juxtamembrane and transmembrane domains.60 Based on our analysis of the transmembrane domain using previously validated prediction models,36,61-71 NTRK2R458G did not significantly alter the stretch of amino acids that typically delineate the transmembrane domain (supplemental Figure 10B-C).
It may be the case that the NTRK2R458G mutant modifies the structure of the juxtamembrane domain and the manner by which this domain interacts with lipids in its immediate environment. To date, multiscale studies on molecular dynamics receptor simulation have shown the importance of the interaction between anionic lipids found within the membrane and juxtamembrane domains of epidermal growth factor and ephrin receptors.72,73 Both of these studies highlight that basic, positively charged residues at the N terminus of the juxtamembrane domain interact with negatively charged phosphatidylinositol-4,5-biphosphate (PIP2) headgroups, driving the formation of lipid nanoclusters in the membrane. Specifically, arginine and lysine are key residues that mediate this interaction with PIP2 in all 58 human RTKs, implicating the importance of this interaction for the structure and function of these receptors.72 Studies suggest that these lipid nanoclusters around the juxtamembrane domain may maintain an autoinhibitory function that prevents unwarranted receptor activation in normal physiologic conditions.74-76 Loss of this autoinhibitory function may enable constitutive receptor activation and downstream signaling that facilitates cancer growth and progression. We believe this phenomenon is analogous to what is observed in a subset of RTKs, such as FLT3 and PDGFRβ, where key residues in the juxtamembrane domain of the receptor maintain basal receptor activity.77 As such, we postulate that loss of the positively charged arginine in the R458G mutant could alter these lipid-protein interactions, resulting in a functionally active TrkB receptor that encourages upregulation of downstream signaling and leukemogenesis.
Based on a previously reported course-grain molecular dynamics simulation study, we prepared the homology model of human NTRK2 WT and colored each protein residue by the mean number of contacts with PIP2 (supplemental Figure 11A).72 Two significant changes observed following the mutation of an arginine to a glycine were the change in polarity (ie, decrease in the positively charged blue area) and a decrease in the shape of the molecular surface due to the loss of a bulky side chain (supplemental Figure 11B-C). We therefore predict that the R458G mutation changes the way PIP2 lipid molecules are recruited and how they nanocluster around the juxtamembrane domain.
The lack of a crystallized structure that engages the flexible Trk juxtamembrane domain prevents us from fully understanding how the NTRK2R458G mutation alters the lipid-juxtamembrane domain interactions relative to the WT receptor. Despite this limitation, our data suggest that the loss of arginine, a conserved residue among all 3 Trk receptors, is crucial to the regulatory function of the TrkB receptor. Future studies will consider the use of cryoelectron microscopy to study the molecular interactions by which the juxtamembrane domain controls Trk function and activity.
Irrespective of the underlying activation mechanism, we saw decreased phosphorylation of TrkB and TrkC in our mutant-transformed Ba/F3 cells following treatment with entrectinib. We also observed a dose-dependent increase in apoptosis in our mutant cells following entrectinib treatment. Our findings were in line with Smith et al, who reported that in vitro entrectinib treatment potently inhibits cellular proliferation, Trk activation, and induces apoptosis in ETV6-NTRK3+ AML cell lines, and in a xenograft study.27 Akin to their study, we found entrectinib to be more potent than larotrectinib, a selective pan-Trk inhibitor, in our Ba/F3 model.
Assays performed on freshly isolated clinical material from patients with NTRKA203T/R458G mutations allowed us to observe altered sensitivities to small-molecule inhibitors of various signaling pathways (Figure 5A-B). Importantly, we saw sensitivity to Trk and PI3K/AKT inhibitors based on IC50 values. These findings correlate with increased Trk activation and downstream PI3K/AKT signaling we observed in our mutant-transformed cells (Figure 2A). It should be noted that both patients with the NTRK2R458G mutation had either a co-occurring mutation in BCR-ABL1T315I or CSF3RT640N (supplemental Table 3). Despite these known oncogenes, the NTRK2R458G mutation may play an important role in mediating resistance. According to our small-molecule inhibitor screen, the patient (ie, 12-00337) with BCR-ABL1T315I was resistant to ponatinib, an FDA-approved inhibitor against BCR-ABL1T315I mutations seen in CML. We also saw no response to other known CML tyrosine kinase inhibitors such as imatinib, dasatinib, and nilotinib (supplemental Table 5). Here, the NTRK2R458G may serve as a bypass resistance pathway for these leukemia cells. Whether the NTRK mutation is an early event or a secondary mutation is outside of the scope of this current work but will be considered in future studies. As for the patient (ie, 13-00187) harboring NTRK2R458G with an accompanying functional CSF3RT640N comutation, we are unable to comment on which mutation is driving leukemogenesis.78 It may be the case that both mutations contribute to the overall phenotype.
Taken together, we identified and characterized 4 oncogenic NTRK point mutations in the setting of leukemia. These mutations bear functional consequence. Their response to FDA-approved inhibitors entrectinib and larotrectinib is striking and warrants investigation of other rare, yet targetable, NTRK mutations in hematological malignancies. In an era of personalized cancer therapy, in which understanding a patient’s mutational landscape is imperative for treatment, our study paves the way for therapeutic targeting of Trk signaling in hematological malignancies. Similar to basket trials focused on solid tumors harboring Trk mutations, a parallel systematic approach is necessary to assess the efficacy of Trk inhibitors in patients with liquid tumors.
Raw sequencing files are available upon request.
The online version of this article contains a data supplement.
The publication costs of this article were defrayed in part by page charge payment. Therefore, and solely to indicate this fact, this article is hereby marked “advertisement” in accordance with 18 USC section 1734.
Acknowledgments
The authors are extremely thankful to their patients for their time and precious tissue samples. The authors also thank the Oregon Health & Science University (OHSU) Massively Parallel Sequencing Shared Resource and Flow Cytometry Core for technical support, Nicola Long and Beth Wilmot for analytical support, and Stephen Kurtz for critical review of the manuscript.
This work was supported by the Howard Hughes Medical Institute, the Leukemia & Lymphoma Society, and National Institutes of Health, National Cancer Institute grant 1R01CA214428 (B.J.D.). B.J.D. was also supported by National Cancer Institute grants 1U01CA217862, 5U01CA214116, and 1U54CA224019. S.K.J. was supported by the Achievement Rewards for College Scientists (ARCS) Scholar Foundation, The Paul & Daisy Soros Fellowship, and National Cancer Institute grant 1F30CA239335-01. E.T. was supported by Leukemia & Lymphoma Society grant LLS SCOR 7005-11, Lamfrom funds, American Cancer Society grant MRSG-17-040-01-LIB, and National Cancer Institute grant 1U54CA224019. J.W.T. received V Foundation for Cancer Research and Gabrielle’s Angel Foundation for Cancer Research grants, and National Cancer Institute grants 1R01CA183947, 1U01CA217862, 1U54CA224019, and 3P30CA069533.
Authorship
Contribution: B.J.D. and C.E.T. supervised the study; S.K.J., W.H.B., M.A.D., B.J.D., and C.E.T. conceived and designed the study; S.K.J., W.H.B., K.W.-S., S.K.M., M.A.D., B.J.D., and C.E.T. developed the methodology; S.K.J., K.Q., W.H.B., K.W.-S., and A.H. acquired data; S.K.J., K.Q., W.H.B., K.W.-S., D.B., E.T., J.W.T., M.A.D., S.K.M., B.J.D., and C.E.T. analyzed and interpreted data (eg, statistical analysis, biostatistics, computational analysis); S.K.J., K.Q., W.H.B., K.W.-S., A.H., D.B., E.T., J.W.T., M.A.D., S.K.M., B.J.D., and C.E.T. wrote, reviewed, and edited the manuscript; and S.K.M. developed the prioritization framework to assist in rigor and reproducibility.
Conflict-of-interest disclosure: B.J.D. serves on scientific advisory boards for Aileron Therapeutics, ALLCRON, Cepheid, Vivid Biosciences, Celgene, the RUNX1 Research Program, EnLiven Therapeutics, Gilead Sciences (inactive), Baxalta (inactive), and Monojul (inactive); serves on scientific advisory boards for, and holds stock in, Aptose Biosciences, Blueprint Medicines, Beta Cat, Third Coast Therapeutics, GRAIL (inactive), and CTI BioPharma (inactive); is the scientific founder of MolecularMD (inactive, acquired by ICON); serves on the board of directors for, and holds stock in, Amgen; serves on the board of directors for the Burroughs Wellcome Fund and CureOne; is on the joint steering committee for Beat AML of the Leukemia & Lymphoma Society; is the founder of VP Therapeutics; received clinical trial funding from Novartis, Bristol-Myers Squibb, and Pfizer; and received royalties from patent 6958335 (Novartis exclusive license) and the Oregon Health & Science University (OHSU) and the Dana-Farber Cancer Institute (1 Merck exclusive license). E.T. serves on advisory boards for Agios, Astellas, Daiichi-Sankyo, and ImmunoGen; and receives clinical trial funding from Janssen, Incyte, and Beat AML of the Leukemia & Lymphoma Society. J.W.T. receives research support from Agios, Aptose, Array, AstraZeneca, Constellation, Genentech, Gilead, Incyte, Janssen, Petra, Seattle Genetics, Syros, and Takeda. M.A.D. and C.E.T. received research funding from Ignyta (inactive). The remaining authors declare no competing financial interests.
Correspondence: Cristina E. Tognon, Oregon Health & Science University, 3181 SW Sam Jackson Park Rd, Mail Code: KR-HEM, Portland, OR 97239; e-mail: tognon@ohsu.edu; and Brian J. Druker, Oregon Health & Science University, 3181 SW Sam Jackson Park Rd, Mail Code: KR-HEM, Portland, OR 97239; e-mail: drukerb@ohsu.edu.

This feature is available to Subscribers Only
Sign In or Create an Account Close Modal