

Key Points
IMiDs induce the degradation of aromatase and impair estradiol autocrine signaling in human megakaryocytes.
Degradation of aromatase by IMiDs causes thrombocytopenia via the inhibition of proplatelet formation.

Abstract
Immunomodulatory drugs (IMiDs) are key agents for the treatment of multiple myeloma and myelodysplastic syndrome with chromosome 5q deletion. IMiDs exert their pleiotropic effects through the recruitment of neosubstrates to cereblon, a substrate receptor of the E3 ubiquitin ligase complex; therefore, identification of cell-specific neosubstrates is important to understand the effects of IMiDs. In clinical practice, IMiDs induce thrombocytopenia, which frequently results in the discontinuation of IMiD treatment. In the current study, we sought to identify the molecular mechanism underlying thrombocytopenia induced by IMiD treatment. We found that IMiDs strongly impaired proplatelet formation, a critical step in functional platelet production, through the inhibition of autocrine estradiol signaling in human megakaryocytes. Furthermore, we identified aromatase, an indispensable enzyme for estradiol biosynthesis, as a novel neosubstrate of cereblon. IMiDs promoted the recruitment of aromatase to cereblon, resulting in the degradation of aromatase in a proteasome-dependent manner. Finally, aromatase was significantly degraded in the bone marrow of patients with multiple myeloma who developed thrombocytopenia with IMiD treatment. These data suggest that aromatase is a neosubstrate of cereblon that is responsible for IMiD-induced thrombocytopenia.
Introduction
Immunomodulatory drugs (IMiDs) such as lenalidomide and pomalidomide are key drugs for the treatment of multiple myeloma (MM) and myelodysplastic syndrome (MDS) with chromosome 5q deletion [del(5q)].1-4 IMiDs modulate the ubiquitination of intracellular proteins by E3 ubiquitin ligase and alter the stability of target proteins via proteasomal degradation. IMiDs directly bind to cereblon, a substrate receptor for the E3 ubiquitin ligase complex, and retarget the enzyme complex toward neosubstrates such as the lymphoid transcription factor IKAROS family zinc finger 1/3 (IKZF1/3) and casein kinase 1α in MM and MDS with del(5q), respectively, which underlies their clinical efficacy in these disorders.5-8 The neosubstrates are degraded while the endogenous substrates accumulate by the altered E3 ubiquitin ligase activity in the presence of an interaction between cereblon and IMiDs.9,10 Therefore, the identification of cell-specific neosubstrates should be a critical step in understanding IMiD-mediated pleiotropic effects.
The number of patients treated with IMiDs for MM has dramatically increased in the last decades. IMiDs, however, also frequently cause cytopenia. The downregulation of IKZF1, an IMiD-dependent substrate of cereblon, can lead to anemia and neutropenia, because IKZF1 is expressed in erythroid and myeloid cells and contributes to their differentiation processes.11,12 Indeed, a recent study demonstrated that IMiD-mediated degradation of IKZF1 reduced the transcription of PU.1, which is a critical transcription factor of myeloid maturation, leading to granulocyte maturation arrest and neutropenia.13 IMiDs also cause severe thrombocytopenia at a high frequency (11.4%-44%),1-4 but the underlying mechanism remains elusive, because the ablation of ikzf1 in mice leads to thrombocytosis rather than thrombocytopenia.14 Thus, it is possible that distinct neosubstrates of cereblon might be involved in the pathogenesis of IMiD-induced thrombocytopenia.
Megakaryopoiesis is a tightly regulated process that culminates in the production of platelets. In bone marrow, megakaryocyte lineage cells develop from hematopoietic stem/progenitor cells (HSPCs) and undergo proliferation and differentiation, exhibiting polyploidization and cytoplasmic maturation.15 Finally, in the perivascular microenvironment, mature megakaryocytes extend dynamic processes into the lumen of bone marrow sinusoids. These intravascular extensions, termed proplatelets, are sheared from their transendothelial stems by blood flow, resulting in the production of platelets in peripheral blood.16 Therefore, proplatelet formation is a critical step for functional platelet production in megakaryopoiesis.16-19
To clarify the molecular mechanism of IMiD-induced thrombocytopenia, we investigated the biological activities of IMiDs in human megakaryopoiesis. We found that IMiDs strongly impaired proplatelet formation through the inhibition of autocrine estradiol signaling in human megakaryocytes. Furthermore, we identified aromatase, an indispensable enzyme for estradiol biosynthesis, as a novel neosubstrate of cereblon. IMiDs promoted the recruitment of aromatase to cereblon, inducing the degradation of aromatase via the ubiquitin-proteasome pathway. Finally, we found that patients with MM who developed IMiD-induced thrombocytopenia exhibited decreased aromatase levels in bone marrow. These results demonstrate aromatase as a novel neosubstrate of cereblon and suggest that the degradation of aromatase plays a central role in IMiD-induced thrombocytopenia in humans.
Materials and methods
Clinical samples
The bone marrow samples of adult patients with MM diagnosed according to World Health Organization criteria were included in this study. In all patients, bone marrow was aspirated from the posterior superior iliac spine and stained with May-Giemsa. Human adult bone marrow and granulocyte colony-stimulating factor–mobilized peripheral blood samples were obtained from healthy donors or purchased from AllCells. Cord blood cells were obtained from full-term deliveries provided by the Kyushu Block Red Cross Blood Center, Japan Red Cross Society, and Ishida Ladies Clinic. Informed consent was obtained from all patients and controls in accordance with the Declaration of Helsinki of 1975, revised in 1983. The Institutional Review Board of Kyushu University Hospital approved all research involving human participants.
In vitro culture of megakaryocytes derived from CD34+ HSPCs
CD34+ HSPCs were isolated using the Indirect CD34 MicroBead Kit (Miltenyi Biotec) and grown in serum-free medium as previously reported.20 Briefly, to generate mature megakaryocytes, cells were cultured in Iscove modified Dulbecco medium supplemented with 20% BIT serum substitute (albumin/insulin/transferrin; STEMCELL Technologies), 40 µg/mL of low-density lipoprotein, 50 µM of 2-mercaptoethanol, and antibiotics in the presence of a cytokine cocktail including stem cell factor (1 ng/mL), thrombopoietin (30 ng/mL), interleukin-6 (7.5 ng/mL), and interleukin-9 (13.5 ng/mL). All cytokines were purchased from R&D Systems. Ten days after the initiation of culture, dead cells were removed using the Dead Cell Removal Kit (Miltenyi Biotec), and live megakaryocytes were cultured for an additional 24 hours with 10 µM of the IMiDs alone or in combination with 10 nM of estradiol and/or 100 nM of bortezomib to examine proplatelet formation. The percentage of proplatelet-forming megakaryocytes was calculated by dividing the number of proplatelet-forming megakaryocytes with the total number of cells. All cultures were incubated at 39°C in a humidified chamber under 10% carbon dioxide.
Flow cytometric analysis
For the analysis of megakaryocytes derived from CD34+ HSPCs, cells were stained and analyzed by fluorescence-activated cell sorter Aria II, as previously reported.21,22 Briefly, cells were stained with phycoerythrin- or Pacific Blue–conjugated anti-CD41 (HIP8) and allophycocyanin-conjugated anti-CD42b (HIP1). Dead cells were excluded by propidium iodide staining. Appropriated isotype-matched, irrelevant control monoclonal antibodies were used to determine background staining. For the ploidy analysis of human megakaryocytes, cells were fixed and permeabilized with ice-cold 70% ethanol and resuspended with incubation in phosphate-buffered saline containing 50 µg/mL of propidium iodide and 100 µg/mL of ribonuclease A for 30 minutes followed by flow cytometric analysis.
Electron microscopy
CD34+ HSPC–derived megakaryocytes were fixed in 2.5% glutaraldehyde and 0.1 M of sucrose. Cells were postfixed in 1% osmic acid, dehydrated with a graded ethanol series, and embedded in Epon. Ultrathin 80-nm sections were cut and stained with 2% uranyl acetate and Sato’s Pb and then examined with a Tecnai F20 transmission electron microscope.
Microarray analysis
Megakaryocytes were generated from CD34+ HSPCs of 4 healthy volunteers in the presence or absence of 10 µM of lenalidomide. Live megakaryocytes were collected, and total RNA was extracted using Isogen2 (Nippon Gene). Gene expression profiling was performed using SurePrint G3 Human GE microarray 8 × 60 000 (version 2.0; Agilent) according to the manufacturer’s protocol. Detailed experimental procedures are described in the supplemental Materials and methods, available on the Blood Web site.
Western blotting analysis
Cells were lysed in RIPA lysis buffer (50 mM of tris[hydroxymethyl]aminomethane [pH, 7.4], 150 mM of sodium chloride, 10 mM of tetrasodium pyrophosphate, 25 mM of sodium β-glycerophosphate, 1 mM of EDTA, 1% [weight/volume] sodium dodecyl sulfate [SDS], and protease and phosphatase inhibitors). The lysates were denatured in equal volumes of 2× SDS sample buffer, fractionated by SDS–polyacrylamide gel electrophoresis on precast gels (Wako), and transferred onto nitrocellulose membranes (Wako). Before incubation with primary antibodies, the blots were blocked in 5% nonfat dry milk in tris(hydroxymethyl)aminomethane-buffered saline with 0.1% Tween 20 for 30 minutes. For protein detection, primary antibodies detecting 3β-hydroxysteroid dehydrogenase (3β-HSD; Abcam), aromatase (Abcam), cereblon (Sigma-Aldrich), β-actin (Cell Signaling Technology), hemagglutinin (HA; Cell Signaling Technology), and FLAG (Sigma-Aldrich) were used. Secondary antibodies were horseradish peroxidase–conjugated anti-rabbit or anti-mouse light chain–specific antibodies (Jackson ImmunoResearch). The blots were visualized with the ECL Prime Western Blotting Detection Reagent (GE Healthcare).
Quantitative reverse transcription polymerase chain reaction
Total RNA was reverse transcribed to complementary DNA using the PrimeScript II 1st Strand Complementary DNA Synthesis Kit (Takara Shuzo). The messenger RNA (mRNA) levels were measured by quantitative real-time polymerase chain reaction in triplicate using SYBR Green Universal Master Mix (Thermo Fisher Scientific) in an Mx3000P Real-Time QPCR System (Agilent Technologies). The relative expression of each gene was calculated by the ΔΔCt method, which uses changes in the cycling threshold, and mRNA levels of glyceraldehyde-3-phosphate dehydrogenase were used for normalization. Primer sequences are available upon request.
Cell line culture and transfection
K562 and 293T cells were obtained from American Type Culture Collection and were grown in RPMI 1640 or Dulbecco’s modified Eagle medium supplemented with 10% heat-inactivated fetal bovine serum and antibiotics at 37°C in a humidified incubator under 5% carbon dioxide. K562 cells were transfected with 5 µg of HA-tagged human aromatase, FLAG-tagged human wild-type (WT) cereblon (cereblonWT; SINO Bioscience), or empty vector. 293T cells were transfected with 5 µg of HA-tagged human aromatase, FLAG-tagged human cereblonWT (SINO Bioscience), FLAG- and HA-tagged human cereblonYW/AA,5 or empty vectors. Electroporation was performed using the Amaxa Nucleofector System (Lonza) according to the manufacturer’s instructions.
Immunoprecipitation
To assess binding of aromatase to cereblon, a lysate mixture of K562 cells transfected with HA-tagged aromatase and those transfected with FLAG-tagged cereblon was incubated and subjected to immunoprecipitation with an antibody against HA. To determine IMiD-cereblon interaction–dependent binding of aromatase and cereblon, FLAG-tagged cereblonWT or cereblonYW/AA was immunoprecipitated from the lysates of 293T cells transfected with each plasmid and used to capture aromatase from 293T cells transfected to overexpress aromatase. The direct binding of aromatase and cereblon was analyzed by coimmunoprecipitation using purified recombinant aromatase and cereblon. Each experiment was performed by using magnetic beads, and after washing, the bound proteins were eluted by the elution buffer to be analyzed by immunoblotting, as described in “Western blotting analysis.” Detailed experimental procedures are described in the supplemental Materials and methods.
Immunofluorescence
Megakaryocytes were isolated from bone marrow by CD61 MicroBead Kit (Miltenyi Biotec). Cells were fixed with Fixation Buffer (BioLegend) and subsequently permeabilized with Intracellular Staining Permeabilization Wash Buffer (BioLegend) and blocked with 5% bovine serum albumin for 1 hour. Primary antibody was rabbit antiaromatase antibody (Abcam), which was diluted 1:1000 and incubated overnight at 4°C. Negative control cells were incubated with irrelevant polyclonal rabbit immunoglobulin G instead of the primary antibody. After washing 3 times, Alexa Fluor 488–conjugated anti-rabbit antibody (Thermo Fisher Scientific) was added at 1:1000 dilution and incubated for 1 hour at room temperature. Nuclei were stained with 4′,6-diamidino-2-phenylindole. After washing 3 times, cells were analyzed by fluorescence microscopy using BZ-X700 (Keyence).
Statistical analysis
All statistical analyses were performed with EZR, which is a modified version of R commander (https://www.rcommander.com/) designed to add statistical functions frequently used in biostatistics. Significance was assessed by 2-tailed Student t test. P values of <.05 were considered significant. Data are presented as means ± standard errors of the mean.
Results
IMiD-induced thrombocytopenia is not due to megakaryocyte reduction
Most anticancer agents for hematological malignancies cause cytopenia through toxicity to hematopoietic cells in the bone marrow. Therefore, we first tested whether IMiDs reduce the number of megakaryocytes. The bone marrow samples of 24 MM patients treated with lenalidomide maintenance therapy or doublet therapy (lenalidomide or pomalidomide in combination with dexamethasone) were examined. We compared the number and morphological characteristics of megakaryocytes using serial bone marrow samples that were obtained before and during treatment. The patient characteristics are shown in Table 1. Thrombocytopenia of any grade during IMiD treatment was observed in 17 patients (71%), and grade ≥3 thrombocytopenia was observed in 5 patients in our study (20%). The observed frequencies were similar to those reported in 3 large clinical trials of maintenance therapy involving 10 mg of lenalidomide (CALBG100104, IFM2005-02, and GIMEMA RV-MM-PI-209), in which the incidence of grade ≥3 thrombocytopenia was 14%, 14%, and 4.3%, respectively.23-25 Importantly, platelet counts were significantly decreased after IMiD therapy (190 × 109/L before therapy and 98 × 109/L during therapy; P < .01). However, mature megakaryocytes were observed frequently in patients being treated with IMiDs (Figure 1A upper). The maturity of megakaryocytes classified by the size of cytoplasm and the degree of nuclear lobulation was not changed during treatment. Signs of dysmegakaryopoiesis, such as abnormal megakaryocytes with widely separated nuclei and micromegakaryocytes, were not evident (Figure 1A lower). The number of megakaryocytes per 50 low-power fields (LPFs) in the bone marrow aspiration samples did not change by IMiD treatment (Figure 1B).
Patient characteristics
| UPN | Age, y | Sex | Subtype | ISS | IMiD dosing, mg/d | Dex dosing, mg/wk | Platelet count, × 109/L | n of Megs per 50 LPFs | BM MM cells, % | |||
|---|---|---|---|---|---|---|---|---|---|---|---|---|
| Before treatment | During treatment | Before treatment | During treatment | Before treatment | During treatment | |||||||
| 1 | 71 | F | IgG | 2 | Len 10 | NA | 197 | 109 | 35 | 4 | 0 | 7.6 |
| 2 | 57 | F | BJP | 1 | Len 10 | NA | 141 | 92 | 8 | 26 | 0.4 | 2.4 |
| 3 | 61 | M | IgA | 3 | Len 10 | NA | 210 | 109 | 4 | 20 | 0.2 | 9 |
| 4 | 80 | M | IgA | 2 | Len 10 | NA | 150 | 90 | 15 | 25 | 4 | 9.4 |
| 5 | 56 | F | IgG | 2 | Len 10 | NA | 220 | 126 | 3 | 17 | 0 | 0 |
| 6 | 73 | F | BJP | 3 | Len 10 | NA | 285 | 125 | 2 | 9 | 1 | 0 |
| 7 | 64 | F | IgG | 2 | Len 10 | NA | 131 | 57 | 2 | 7 | 1.9 | 0.7 |
| 8 | 55 | F | IgG | 1 | Len 10 | NA | 120 | 73 | 30 | 31 | 0 | 0 |
| 9 | 55 | M | BJP | 1 | Len 10 | NA | 203 | 171 | 25 | 5 | 0 | 0.9 |
| 10 | 51 | F | IgA | 1 | Len 10 | NA | 190 | 36 | 13 | 30 | 0.47 | 0.9 |
| 11 | 65 | M | IgG | 2 | Len 10 | NA | 95 | 38 | 5 | 12 | 0 | 0.3 |
| 12 | 64 | M | IgA | 2 | Len 10 | NA | 198 | 197 | 5 | 19 | 0.07 | 1.3 |
| 13 | 64 | M | IgD | 2 | Len 10 | NA | 101 | 67 | 23 | 25 | 0.8 | 5.7 |
| 14 | 72 | F | IgG | 3 | Len 10 | NA | 122 | 86 | 7 | 12 | 4.8 | 4.5 |
| 15 | 83 | M | IgG | 1 | Len 15 | 20 | 74 | 39 | 51 | 12 | 8.6 | 1.97 |
| 16 | 67 | F | IgG | 2 | Len 25 | 20 | 507 | 237 | 5 | 12 | 0 | 0.5 |
| 17 | 55 | F | IgG | 2 | Len 25 | 40 | 189 | 105 | 14 | 47 | 1.6 | 0.7 |
| 18 | 49 | F | IgG | 1 | Len 25 | 40 | 332 | 136 | 4 | 7 | 0.05 | 0 |
| 19 | 55 | M | IgA | 1 | Len 25 | 40 | 334 | 329 | 22 | 47 | 0 | 0 |
| 20 | 60 | F | IgA | 1 | Len 25 | 40 | 528 | 139 | 5 | 2 | 0.5 | 2.6 |
| 21 | 67 | M | IgG | 1 | Pom 3 | 20 | 198 | 174 | 64 | 50 | 2.6 | 8.3 |
| 22 | 57 | M | IgA | 1 | Pom 4 | 20 | 107 | 29 | 6 | 5 | 2 | 0.6 |
| 23 | 48 | M | IgA | 3 | Pom 4 | 40 | 136 | 23 | 9 | 4 | 8 | 1.3 |
| 24 | 46 | M | IgG | 2 | Pom 4 | 40 | 152 | 79 | 58 | 38 | 0.4 | 2.7 |
| Mean (range) | 190 (74-528) | 98 (23-329) | 9 (2-64) | 15 (2-50) | 0.44 (0-8.6) | 1.1 (0-9.4) | ||||||
| P | <.01 | .55 | .19 | |||||||||
BJP, Bence Jones protein; BM, bone marrow; Dex, dexamethasone; Ig, immunoglobulin; ISS, International Staging System; Len, lenalidomide; LPF, low-power field; Meg, megakaryocyte; NA, not applicable; Pom, pomalidomide; UPN, unique patient number.
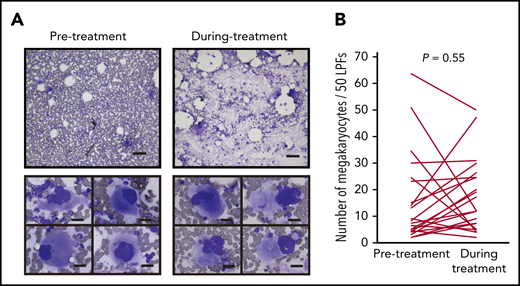
IMiD therapy spares megakaryocytes in the bone marrow. (A) Bone marrow aspirates before and during treatment from case 1 listed in Table 1 (May-Giemsa staining). Lower panels show representative megakaryocytes. Images were captured by a BH-2 microscope (Olympus) and ACT-2U imaging software (Nikon) with ×100 (upper; scale bar, 100 µm) and ×400 (lower; scale bar, 25 µm) magnification. (B) Number of megakaryocytes per 50 low-power fields (LPFs) in bone marrow aspirates from 24 patients listed in Table 1. Each line represents the change in the number of megakaryocytes in each patient. P value was determined by 2-tailed Student t test. To avoid the potential influence of tumor infiltration on hematopoiesis, bone marrow samples with <10% clonal plasma cells were examined.
IMiD therapy spares megakaryocytes in the bone marrow. (A) Bone marrow aspirates before and during treatment from case 1 listed in Table 1 (May-Giemsa staining). Lower panels show representative megakaryocytes. Images were captured by a BH-2 microscope (Olympus) and ACT-2U imaging software (Nikon) with ×100 (upper; scale bar, 100 µm) and ×400 (lower; scale bar, 25 µm) magnification. (B) Number of megakaryocytes per 50 low-power fields (LPFs) in bone marrow aspirates from 24 patients listed in Table 1. Each line represents the change in the number of megakaryocytes in each patient. P value was determined by 2-tailed Student t test. To avoid the potential influence of tumor infiltration on hematopoiesis, bone marrow samples with <10% clonal plasma cells were examined.
IMiDs do not affect the process of megakaryocyte maturation
Megakaryopoiesis comprises cell division followed by polyploidization.26,27 Megakaryocyte progenitors differentiate through cell divisions to generate cells expressing main platelet proteins such as CD41 and, in subsequent stages, CD42b, which are early differentiation markers.28 These nonpolyploid cells, also called promegakaryoblasts, switch from mitosis to endomitosis (ie, DNA reduplication without cytoplasmic division), thereby accumulating DNA content in a discrete step to eventually become polyploid megakaryoblasts and megakaryocytes.27 Therefore, to test the effect of IMiDs on each maturation step, we employed a serum-free liquid culture system in which human CD34+ HSPCs generate mature megakaryocytes.20 As shown in Figure 2A, CD34+ HSPCs differentiated into large and multilobulated megakaryocytes after 10 days independently of the presence of IMiDs. Flow cytometric analysis revealed that most of the progenies derived from CD34+ HSPCs were positive for CD41 and that the frequency of phenotypically mature CD41+CD42b+ megakaryocytic cells did not change with the addition of IMiDs (Figure 2B). Furthermore, the ploidy levels of the human megakaryocytes were not affected either (Figure 2C).

IMiDs do not inhibit maturation or endomitosis of megakaryocytes. (A) Cytospin preparations of cells derived from CD34+ HSPCs (May-Giemsa staining) showing large and weakly basophilic cytoplasm, azurophilic granules, and multilobulated nuclei. HSPCs were cultured in serum-free liquid media for 10 days in the presence or absence of 10 µM of IMiDs. Images were captured by a BH-2 microscope (Olympus) and ACT-2U imaging software (Nikon) with ×600 magnification (scale bars, 25 µm). (B) Flow cytometric analysis of CD41 and CD42b expression. Representative flow cytometric plots are shown in 3 panels on the left. Summarized data of the percentages of CD41+CD42b+ phenotypically mature megakaryocytes are shown in the right panel. (C) DNA ploidy analysis by flow cytometry. Ploidy levels were evaluated based on the DNA content with PI staining. Representative ploidy histograms are shown in 2 panels on the left. Summary of the ploidy distributions is illustrated in the right panel. Data are from 4 (B) and 3 (C) independent experiments and expressed as means ± standard errors of the mean. P values were determined by 2-tailed Student t test. Cont, control; Len, lenalidomide; Pom, pomalidomide.
IMiDs do not inhibit maturation or endomitosis of megakaryocytes. (A) Cytospin preparations of cells derived from CD34+ HSPCs (May-Giemsa staining) showing large and weakly basophilic cytoplasm, azurophilic granules, and multilobulated nuclei. HSPCs were cultured in serum-free liquid media for 10 days in the presence or absence of 10 µM of IMiDs. Images were captured by a BH-2 microscope (Olympus) and ACT-2U imaging software (Nikon) with ×600 magnification (scale bars, 25 µm). (B) Flow cytometric analysis of CD41 and CD42b expression. Representative flow cytometric plots are shown in 3 panels on the left. Summarized data of the percentages of CD41+CD42b+ phenotypically mature megakaryocytes are shown in the right panel. (C) DNA ploidy analysis by flow cytometry. Ploidy levels were evaluated based on the DNA content with PI staining. Representative ploidy histograms are shown in 2 panels on the left. Summary of the ploidy distributions is illustrated in the right panel. Data are from 4 (B) and 3 (C) independent experiments and expressed as means ± standard errors of the mean. P values were determined by 2-tailed Student t test. Cont, control; Len, lenalidomide; Pom, pomalidomide.
IMiDs inhibit proplatelet formation of human megakaryocytes
We next investigated the effect of IMiDs on proplatelet formation, the final step in platelet production.15,16 Mobilized human peripheral blood–derived megakaryocytes29 were used for the evaluation of changes in the percentage of proplatelet-forming megakaryocytes by IMiD treatment. We counted 500 cells using phase-contrast microscopy and calculated the percentages of proplatelet-forming megakaryocytes, defined as cells containing ≥1 filament-like processes, as previously reported.30 Approximately 29% of the megakaryocytes formed proplatelets in the control media, whereas, strikingly, only 5% and 7% of the megakaryocytes formed proplatelets in the presence of lenalidomide and pomalidomide, respectively (Figure 3A-B). These data strongly suggest that both lenalidomide and pomalidomide inhibited the process of proplatelet formation.
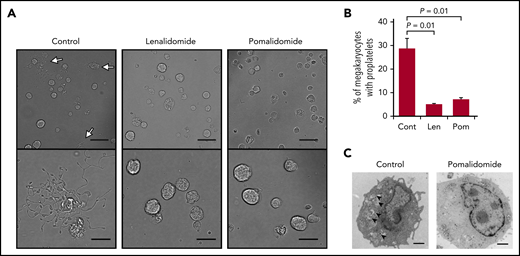
IMiDs inhibit proplatelet formation of human megakaryocytes. (A) Representative phase-contrast microscopic images of megakaryocytes derived from CD34+ HSPCs with or without 10 µM of lenalidomide (Len) or pomalidomide (Pom). Arrows denote megakaryocytes with proplatelets. Lower panels show enlarged images. Images were captured by BZ-X700 (Keyence) with ×20 (upper; scale bars, 50 µm) and ×40 (lower; scale bars, 25 µm) objective lens. (B) Mean percentages of megakaryocytes with proplatelets in 500 cells analyzed per sample. Data are from 3 independent experiments and expressed as means ± standard errors of the mean. P values were determined by 2-tailed Student t test. (C) Transmission electron microscopic images of representative megakaryocytes for each treatment group are shown. Arrowheads denote demarcation membranes. Images were captured by Tecnai F20 electron microscope with ×5000 magnification (scale bar, 1 µm).
IMiDs inhibit proplatelet formation of human megakaryocytes. (A) Representative phase-contrast microscopic images of megakaryocytes derived from CD34+ HSPCs with or without 10 µM of lenalidomide (Len) or pomalidomide (Pom). Arrows denote megakaryocytes with proplatelets. Lower panels show enlarged images. Images were captured by BZ-X700 (Keyence) with ×20 (upper; scale bars, 50 µm) and ×40 (lower; scale bars, 25 µm) objective lens. (B) Mean percentages of megakaryocytes with proplatelets in 500 cells analyzed per sample. Data are from 3 independent experiments and expressed as means ± standard errors of the mean. P values were determined by 2-tailed Student t test. (C) Transmission electron microscopic images of representative megakaryocytes for each treatment group are shown. Arrowheads denote demarcation membranes. Images were captured by Tecnai F20 electron microscope with ×5000 magnification (scale bar, 1 µm).
To further understand the process of IMiD-mediated inhibition of proplatelet formation, we analyzed structural changes of megakaryocytes derived from human CD34+ HSPCs by electron microscopy (Figure 3C). Ultrastructural features of cytoplasmic reorganization precede proplatelet formation. The demarcation membrane system (DMS) is an extensive plasma membrane invagination and is a membrane reservoir for proplatelet formation.31 As shown in Figure 3C, IMiD-treated megakaryocytes lacked the DMS, suggesting that IMiDs inhibited the development of the DMS, which is an essential step for proplatelet formation (Figure 3C).
Impaired proplatelet formation is attributed to deficient megakaryocyte-intrinsic estradiol action
To understand the mechanism by which IMiDs inhibited the proplatelet formation of megakaryocytes, we performed transcriptome analysis of megakaryocytes derived from CD34+ HSPCs in the liquid culture in the presence or absence of lenalidomide. Differentially expressed genes were evaluated comprehensively by gene set enrichment analysis. As shown in Figure 4A, the IMiDs did not affect the transcriptional enrichment of genes related to the megakaryocyte lineage differentiation or the expression levels of platelet-related genes32 (supplemental Figure 1).
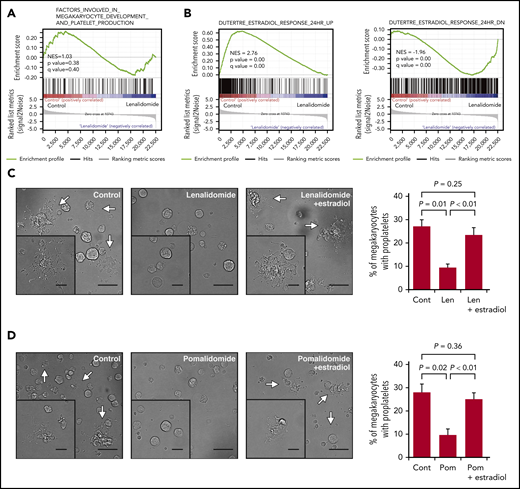
IMiDs inhibit proplatelet formation by blocking estradiol action. (A) Gene expression profiles of untreated and lenalidomide (Len)-treated megakaryocytes to examine genes involved in the terminal differentiation of megakaryocytes and platelet production was evaluated by gene set enrichment analysis (GSEA). (B) GSEA comparing untreated and Len-treated megakaryocytes for estradiol-upregulated (left panel) and -downregulated (right panel) genes. For each gene set, an enrichment score was calculated using the normalized Kolmogorov-Smirnov statistic. To adjust for the different sizes of gene sets, normalized enrichment score (NES) was calculated. (C-D) Representative phase-contrast microscopic images of megakaryocytes cultured with or without 10 µM of Len (C) or pomalidomide (Pom) (D) alone or in the presence of 10 nM of estradiol. Arrows denote megakaryocytes with proplatelets. Insets show enlarged images. Images were captured by BZ-X700 (Keyence) with ×20 (large images; scale bars, 50 µm) and ×40 (inset images; scale bars, 25 µm) objective lens. Mean percentages of proplatelet-forming megakaryocytes in 500 cells analyzed per sample are shown in the right panels. Data are from 3 independent experiments and expressed as means ± standard errors of the mean. P values were determined by 2-tailed Student t test.
IMiDs inhibit proplatelet formation by blocking estradiol action. (A) Gene expression profiles of untreated and lenalidomide (Len)-treated megakaryocytes to examine genes involved in the terminal differentiation of megakaryocytes and platelet production was evaluated by gene set enrichment analysis (GSEA). (B) GSEA comparing untreated and Len-treated megakaryocytes for estradiol-upregulated (left panel) and -downregulated (right panel) genes. For each gene set, an enrichment score was calculated using the normalized Kolmogorov-Smirnov statistic. To adjust for the different sizes of gene sets, normalized enrichment score (NES) was calculated. (C-D) Representative phase-contrast microscopic images of megakaryocytes cultured with or without 10 µM of Len (C) or pomalidomide (Pom) (D) alone or in the presence of 10 nM of estradiol. Arrows denote megakaryocytes with proplatelets. Insets show enlarged images. Images were captured by BZ-X700 (Keyence) with ×20 (large images; scale bars, 50 µm) and ×40 (inset images; scale bars, 25 µm) objective lens. Mean percentages of proplatelet-forming megakaryocytes in 500 cells analyzed per sample are shown in the right panels. Data are from 3 independent experiments and expressed as means ± standard errors of the mean. P values were determined by 2-tailed Student t test.
A previous study revealed that megakaryocytes synthesized and secreted estradiol and that the estradiol signaling pathway played a role in the initiation of proplatelet formation in an autocrine manner.33 As shown in Figure 4B, gene set enrichment analysis further revealed that the previously identified estradiol response gene sets34 were accordingly enriched positively and negatively in the control megakaryocytes, whereas the megakaryocytes treated with lenalidomide lacked the gene expression signatures of the estradiol response, suggesting that lenalidomide blocked estradiol signaling in human megakaryocytes. We then tested whether the addition of estradiol to the medium could recover the capacity of proplatelet formation in the IMiD-treated megakaryocytes. As shown in Figure 4C-D, the addition of exogenous estradiol significantly restored the percentages of proplatelet-forming megakaryocytes treated with either lenalidomide or pomalidomide. A recent report showed that proplatelet formation requires proteasome-dependent regulation of small GTPase RhoA activity.35 Consistent with this report, the proteasome inhibitor disrupted the effect of estradiol on IMiD-treated megakaryocytes (supplemental Figure 2A-B). These results strongly suggest that the IMiD-mediated inhibition of proplatelet formation was caused by deficiency in endogenous estradiol signaling in megakaryocytes.
Aromatase is a novel neosubstrate of cereblon
We hypothesized that a certain protein required for estradiol synthesis might be a neosubstrate of cereblon and that its destabilization by IMiDs might explain this observation. The biosynthesis of all steroid hormones requires 3β-HSD, and the conversion of testosterone into estradiol in the final step of estradiol synthesis is mediated by aromatase.33,36 As shown in Figure 5A-B, both 3β-HSD and aromatase proteins were strongly expressed in normal human megakaryocytes derived from CD34+ HSPCs. Lenalidomide did not change the protein level of 3β-HSD (Figure 5A); however, the expression levels of aromatase were dramatically decreased within 24 hours after IMiD treatment (Figure 5B). In contrast, the mRNA levels of CYP19A1, a gene encoding aromatase, in the megakaryocytes were unchanged in IMiD-treated megakaryocytes, suggesting that the decrease in aromatase protein level was dependent on a posttranscriptional mechanism (Figure 5C). Furthermore, the downregulation of aromatase protein became evident within 3 hours after lenalidomide treatment (Figure 5D). Of note, the effects of both lenalidomide and pomalidomide occurred at a concentration of 0.01 µM, which was lower than the reported serum concentrations in patients treated with IMiDs (Figure 5E-F).37,38 Interestingly, CC-220, a next-generation IMiD,39 did not induce the degradation of aromatase (supplemental Figure 3).
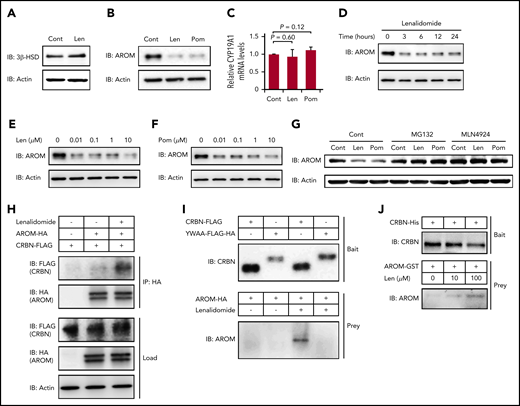
IMiDs induce cereblon-dependent degradation of aromatase. (A-B) Protein expression levels of 3β-HSD (A) and aromatase (AROM) (B) in megakaryocytes generated from CD34+ HSPCs. (C) Relative mRNA expression levels of CYP19A1 in megakaryocytes generated from CD34+ HSPCs. The cells were treated with dimethyl sulfoxide, 10 µM of lenalidomide (Len), or pomalidomide (Pom) for 24 hours. (C) Data are from 3 independent experiments and expressed as means ± standard errors of the mean. P values were determined by 2-tailed Student t test. (D) Time course of 10-µM Len treatment in megakaryocytes for AROM protein levels. (E-F) Immunoblot analysis for AROM protein levels in megakaryocytes treated for 24 hours with Len (E) or Pom (F) at indicated concentrations. (G) Immunoblot analysis for AROM protein levels in K562 cells treated for 24 hours with or without 10 µM of IMiDs alone or in the presence of 10 µM of MG132 or 1 µM of MLN4924. (H) Lysate mixture of K562 cells transfected with HA-tagged AROM and those transfected with FLAG-tagged cereblon (CRBN) was incubated with or without 10 µM of Len for 12 hours and subjected to immunoprecipitation with antibody against HA. (I) FLAG-tagged CRBN was immunoprecipitated from the lysates of 293T cells transfected with indicated CRBN variants and used to capture AROM from 293T cells transfected to overexpress aromatase. (J) Purified recombinant His-tagged CRBN-loaded beads were incubated with glutathione S-transferase (GST)–tagged AROM in the presence of Len at indicated concentrations. Results are representative of 2 (A, G, H, I, J) or 3 (B, D, E, F) independent experiments. Cont, control; IB, immunoblotting; IP, immunoprecipitation.
IMiDs induce cereblon-dependent degradation of aromatase. (A-B) Protein expression levels of 3β-HSD (A) and aromatase (AROM) (B) in megakaryocytes generated from CD34+ HSPCs. (C) Relative mRNA expression levels of CYP19A1 in megakaryocytes generated from CD34+ HSPCs. The cells were treated with dimethyl sulfoxide, 10 µM of lenalidomide (Len), or pomalidomide (Pom) for 24 hours. (C) Data are from 3 independent experiments and expressed as means ± standard errors of the mean. P values were determined by 2-tailed Student t test. (D) Time course of 10-µM Len treatment in megakaryocytes for AROM protein levels. (E-F) Immunoblot analysis for AROM protein levels in megakaryocytes treated for 24 hours with Len (E) or Pom (F) at indicated concentrations. (G) Immunoblot analysis for AROM protein levels in K562 cells treated for 24 hours with or without 10 µM of IMiDs alone or in the presence of 10 µM of MG132 or 1 µM of MLN4924. (H) Lysate mixture of K562 cells transfected with HA-tagged AROM and those transfected with FLAG-tagged cereblon (CRBN) was incubated with or without 10 µM of Len for 12 hours and subjected to immunoprecipitation with antibody against HA. (I) FLAG-tagged CRBN was immunoprecipitated from the lysates of 293T cells transfected with indicated CRBN variants and used to capture AROM from 293T cells transfected to overexpress aromatase. (J) Purified recombinant His-tagged CRBN-loaded beads were incubated with glutathione S-transferase (GST)–tagged AROM in the presence of Len at indicated concentrations. Results are representative of 2 (A, G, H, I, J) or 3 (B, D, E, F) independent experiments. Cont, control; IB, immunoblotting; IP, immunoprecipitation.
Furthermore, the IMiD-mediated aromatase degradation was abrogated by the proteasome inhibitor MG132 and by the selective inhibitor of NEDD8-activating enzyme MLN4924, suggesting that the aromatase degradation was dependent on the ubiquitin-proteasome pathway (Figure 5G).
Finally, we determined whether aromatase was bound to cereblon in the presence of IMiDs. The lysates from K562 cells expressing HA-tagged aromatase and those from K562 cells expressing FLAG-tagged cereblon were mixed, followed by incubation with or without lenalidomide. We found that the FLAG-tagged cereblon coimmunoprecipitated with the HA-tagged aromatase only after incubation with lenalidomide (Figure 5H). Next, the mutant cereblonYW/AA with defective IMiD-binding capacity5 failed to bind aromatase even in the presence of lenalidomide (Figure 5I). Finally, IMiD-dependent binding of purified recombinant cereblon and aromatase is highly suggestive of their direct contact without intervention of other intracellular proteins (Figure 5J). Interestingly, sequence alignment of aromatase residue K150-T170 was similar to that proximal to the cereblon-binding site of GSPT-1, a previously delineated direct neosubstrate (supplemental Figure 4).40 These results collectively suggest that IMiDs mediated the binding of aromatase with cereblon to induce the degradation of aromatase via the ubiquitin-proteasome pathway.
Aromatase degradation is evident in patients with IMiD-induced thrombocytopenia
We next evaluated aromatase protein levels in patients with IMiD-induced thrombocytopenia. First, we compared aromatase protein levels in the bone marrow samples of 5 patients with MM treated with IMiDs and 5 patients with MM who had not received IMiDs. Consistent with the results shown in Figure 1, the numbers of megakaryocytes per 50 low-power fields were not significantly different between the IMiD-naïve patients and the IMiD-treated patients who developed thrombocytopenia (Table 2). Strikingly, patients with IMiD-induced thrombocytopenia did not have detectable levels of aromatase protein, whereas all IMiD-naïve patients had considerable levels of aromatase protein in the bone marrow (Figure 6A). Figure 6B shows the sequential changes in aromatase protein levels in the bone marrow samples of 3 patients before and after the start of IMiD therapy. The aromatase protein levels in the bone marrow during treatment were significantly reduced, which was associated with a significant reduction in platelet counts (Figure 6B; Table 1). Consistently, aromatase protein was undetectable in megakaryocytes isolated from the bone marrow of patients treated with IMiDs by an immunofluorescent staining (Figure 6C-D). These results collectively suggest that aromatase is a neosubstrate of cereblon responsible for IMiD-induced thrombocytopenia.
Characteristics of patient samples used for bone marrow aromatase expression experiments
| UPN | Age, y | Sex | IMiD dosing, mg/d | Dex dosing, mg/wk | Platelet count, × 109/L | n of Megs per 50 LPFs |
|---|---|---|---|---|---|---|
| 25 | 58 | F | NA | NA | 286 | 29 |
| 26 | 51 | M | NA | NA | 249 | 34 |
| 27 | 64 | M | NA | NA | 167 | 14 |
| 28 | 56 | M | NA | NA | 309 | 18 |
| 29 | 65 | M | NA | NA | 174 | 19 |
| 30 | 54 | F | Pom 3 | 40 | 96 | 18 |
| 31 | 58 | M | Len 10 | NA | 90 | 24 |
| 32 | 59 | M | Len 10 | NA | 54 | 22 |
| 33 | 62 | F | Len 10 | NA | 95 | 11 |
| 34 | 64 | M | Len 25 | 40 | 52 | 15 |
Dex, dexamethasone; Len, lenalidomide; LPF, low-power field; Meg, megakaryocyte; NA, not applicable; Pom, pomalidomide; UPN, unique patient number.
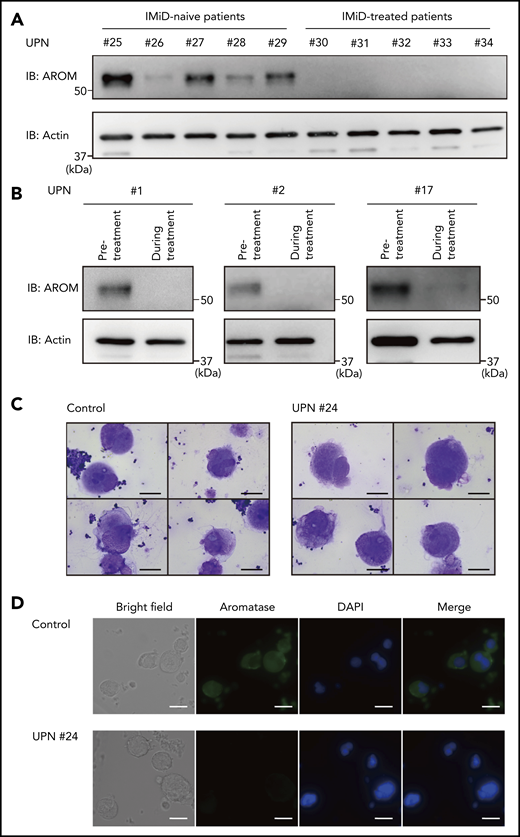
Aromatase is decreased in the bone marrow of IMiD-treated patients. (A) Immunoblot analysis of aromatase (AROM) in bone marrow samples from the cases listed in Table 2. (B) Serial changes in AROM protein levels in the bone marrow samples from cases 1, 2, and 17 listed in Table 1. Frozen viable patient samples were thawed at 37°C. The cells were lysed in RIPA lysis buffer. Immunoblot analysis was performed using 5 to 10 µg of protein per sample. Because of limited availability of the patient samples, the experiment was performed only once. (C) Cytospin preparations of megakaryocytes isolated from bone marrow samples of a healthy volunteer and case 24 listed in Table 1 (May-Giemsa staining). Images were captured by a BH-2 microscope (Olympus) and ACT-2U imaging software (Nikon) with ×600 magnification (scale bars, 25 µm). (D) Representative immunofluorescence microscopic images of megakaryocytes. Cells were stained with anti-AROM antibody (green). Nuclei were counterstained with 4′,6-diamidino-2-phenylindole (DAPI) (blue). Megakaryocytes were identified as large cells containing a multilobulated nucleus. Images were captured by BZ-X700 (Keyence) with ×40 objective lens (scale bars, 25 µm). Two independent patient-control–matched pair experiments were performed. UPN, unique patient number.
Aromatase is decreased in the bone marrow of IMiD-treated patients. (A) Immunoblot analysis of aromatase (AROM) in bone marrow samples from the cases listed in Table 2. (B) Serial changes in AROM protein levels in the bone marrow samples from cases 1, 2, and 17 listed in Table 1. Frozen viable patient samples were thawed at 37°C. The cells were lysed in RIPA lysis buffer. Immunoblot analysis was performed using 5 to 10 µg of protein per sample. Because of limited availability of the patient samples, the experiment was performed only once. (C) Cytospin preparations of megakaryocytes isolated from bone marrow samples of a healthy volunteer and case 24 listed in Table 1 (May-Giemsa staining). Images were captured by a BH-2 microscope (Olympus) and ACT-2U imaging software (Nikon) with ×600 magnification (scale bars, 25 µm). (D) Representative immunofluorescence microscopic images of megakaryocytes. Cells were stained with anti-AROM antibody (green). Nuclei were counterstained with 4′,6-diamidino-2-phenylindole (DAPI) (blue). Megakaryocytes were identified as large cells containing a multilobulated nucleus. Images were captured by BZ-X700 (Keyence) with ×40 objective lens (scale bars, 25 µm). Two independent patient-control–matched pair experiments were performed. UPN, unique patient number.
Discussion
In the present study, we have identified aromatase as a novel IMiD-dependent cereblon substrate in humans. IMiDs induced aromatase degradation by interaction with cereblon and inhibited autocrine estradiol signaling–dependent proplatelet formation in megakaryocytes. Our data strongly suggest that the degradation of aromatase is the molecular mechanism of IMiD-induced thrombocytopenia in MM patients.
Our study indicates that modification of the IMiD structure in a way to avoid aromatase degradation may reduce the risk of thrombocytopenia. In clinics, a number of patients discontinue IMiD therapy because of severe thrombocytopenia. X-ray structural analyses have revealed that the phthalimide moiety of thalidomide and its derivatives is structurally different between each compound and potentially determines the substrate specificity of IMiDs.41 Recent work also showed that lenalidomide induced the degradation of casein kinase 1α, whereas thalidomide and pomalidomide did not, which might explain the specific therapeutic effect of lenalidomide in MDS with del(5q).8 Structural analyses of the cereblon-IMiD complex–provided interaction surface for aromatase are critical in future studies.
Our current study suggests that administration of estradiol can prevent IMiD-induced thrombocytopenia. IMiDs, as well as estradiol, however, increase the risk of thrombotic complications.42,43 Introduction of new IMiDs that do not affect the degradation of aromatase, such as CC-220 (supplemental Figure 3), is important to avoid this complication.
This study also indicates new therapeutic applications for IMiDs in aromatase-related diseases. Aromatase is expressed in adipose tissue of the breast, which locally produces estradiol, contributing to the development of postmenopausal breast cancer.36 Aromatase inhibitors are widely used in the treatment of postmenopausal breast cancer.44 Currently available aromatase inhibitors bind aromatase in competition with its substrate androgen to inhibit aromatase activity, and this treatment sometimes induces an increase in androgen levels.45 In general, an increase in substrate concentration can impair the inhibitory activity of a competitive inhibitor, and such aromatase inhibitors cannot completely inhibit estradiol synthesis.46,47 The strong inhibitory effect of IMiDs on aromatase synthesis suggests that they might be useful in the treatment of breast cancer. It is also possible that the combination of aromatase inhibitors and IMiDs might be synergistically effective for breast cancer, because their molecular mechanisms to target aromatase activity are different. However, it is unclear whether adipose tissue cells in breast cancer have sufficient susceptibility to IMIDs, because the affinity of IMiD-dependent substrates to cereblon might change in the presence of other neosubstrates that share a binding site structurally similar to the cereblon-IMiD interface.41 Nonetheless, it might be important to test the potential therapeutic effects of IMiDs in breast cancer.
Because MM usually involves elderly patients, it is also important to understand whether age-related somatic mutations, including clonal hematopoiesis of indeterminate potential (CHIP),48 may affect platelet production during IMiD treatment. Both CHIP and IMiD treatment are related to myeloid neoplasms, including MDS48-50 ; therefore, the assessment of CHIP status in patients with IMiD-mediated thrombocytopenia may be required in future studies.
In summary, the current study elucidates the molecular mechanism of IMiD-caused thrombocytopenia in MM patients. IMiDs induced the degradation of aromatase and impaired autocrine estradiol signaling, leading to the inhibition of the proplatelet formation of megakaryocytes. Detailed analyses of the IMiD-mediated binding mode of aromatase and cereblon are warranted.
Microarray data are available at the Gene Expression Omnibus under accession number GSE111994.
The online version of this article contains a data supplement.
The publication costs of this article were defrayed in part by page charge payment. Therefore, and solely to indicate this fact, this article is hereby marked “advertisement” in accordance with 18 USC section 1734.
Acknowledgments
The authors thank Yasuyuki Ohkawa of the Laboratory for Technical Support, Medical Institute of Bioregulation, Kyushu University, Fukuoka, Japan, for valuable help in performing the electron microscopic analysis.
This study was supported, in part, by a Grant-in-Aid for Young Scientists (A) (16748470) (Y.K.), a Grant-in-Aid for Scientific Research (S) (16747244) (K.A.), a Grant-in-Aid for Scientific Research (A) (17922585) (T. Miyamoto), and Grants-in-Aid for Scientific Research (B) (16674756) (T. Miyamoto) and (19109659) (Y.K.) from the Ministry of Education, Culture, Sports, Science and Technology of Japan and, in part, by Grants-in-Aid from the Japan Agency for Medical Research and Development (16768249) (Y.K) and (16770576) (K.A.).
Authorship
Contribution: T.T., Y.K., K.H., T. Sakoda, D.I., H.I., and T. Shima designed and performed all experiments, analyzed the data, performed the statistical analysis, and wrote the manuscript; T. Miyamoto, K.K., and T. Maeda analyzed the data; T.I. and H.H. provided the plasmid vector carrying mutant cereblonYW/AA and advised the study design; and K.A. and Y.K. designed and supervised the overall project and wrote the manuscript.
Conflict-of-interest disclosure: The authors declare no competing financial interests.
Correspondence: Koichi Akashi, 3-1-1 Maidashi, Higashi-ku, Fukuoka 812-8582, Japan; e-mail: akashi@med.kyushu-u.ac.jp.

This feature is available to Subscribers Only
Sign In or Create an Account Close Modal