

Key Points
ATL-driver mutations are detectable in the blood of HTLV-1 carriers 6 months to >10 years before diagnosis with ATL.
ATL-driver mutations are associated with ATL-like oligoclonality, which may be a useful biomarker of transformation.

Abstract
Adult T-cell leukemia/lymphoma (ATL) is an aggressive hematological malignancy caused by human T-cell leukemia virus type-1 (HTLV-1). ATL is preceded by decades of chronic HTLV-1 infection, and the tumors carry both somatic mutations and proviral DNA integrated into the tumor genome. In order to gain insight into the oncogenic process, we used targeted sequencing to track the evolution of the malignant clone in 6 individuals, 2 to 10 years before the diagnosis of ATL. Clones of premalignant HTLV-1–infected cells bearing known driver mutations were detected in the blood up to 10 years before individuals developed acute and lymphoma subtype ATL. Six months before diagnosis, the total number and variant allele fraction of mutations increased in the blood. Peripheral blood mononuclear cells from premalignant cases (1 year prediagnosis) had significantly higher mutational burden in genes frequently mutated in ATL than did high-risk, age-matched HTLV-1 carriers who remained ATL-free after a median of 10 years of follow-up. These data show that HTLV-1–infected T-cell clones carrying key oncogenic driver mutations can be detected in cases of ATL years before the onset of symptoms. Early detection of such mutations may enable earlier and more effective intervention to prevent the development of ATL.
Introduction
Adult T-cell leukemia/lymphoma (ATL) is a malignancy of T cells that can have an extremely poor prognosis. The aggressive subtypes of ATL (∼60% of cases) have a median overall survival of 8 to 10 months,1 and ∼50% of individuals diagnosed with the “indolent” chronic and smoldering subtypes transform to aggressive disease within a year.2
With the exception of a small number of case reports of novel targeted therapies, the only potentially curative treatment of aggressive ATL is allogeneic hematopoietic stem cell transplantation, which is rarely performed due to failure to achieve clinical remission, early disease progression, and lack of donor availability. The outcome after transplantation is frequently poor due to preexisting immune compromise and poor performance status, and relapse after transplant is frequent.
Early detection of ATL could increase opportunities to treat with curative intent by enabling timely planning of allogeneic hematopoietic stem cell transplantation at disease onset. Similarly, detection of premalignancy in high-risk individuals would allow clinicians to conduct intervention trials (for example, with mogamulizumab, a well-tolerated humanized anti–C-C chemokine receptor 4 antibody), which aim to reduce the likelihood of transformation to frequently chemorefractory aggressive ATL.
ATL occurs at a rate of 0.7 to 7.1 cases per 1000 carrier-years3-6 in individuals chronically infected with the deltaretrovirus human T-cell leukemia virus type-1 (HTLV-1), which equates to ∼2% to 7% lifetime risk in all HTLV-1 carriers.7 Integrated (proviral) HTLV-1 genomes are found in the DNA of malignant ATL cells. ATL typically occurs at least 20 to 30 years after initial infection, almost exclusively in individuals with a HTLV-1 proviral load (PVL; percentage of peripheral blood mononuclear cells [PBMCs] carrying integrated HTLV-1 proviruses) of >4%.5
HTLV-1 barcodes infected cells by integrating proviral copies of its genome throughout the host cell genetic material.8,9 Thus, each infected T-cell clone bears a unique proviral integration site (UIS), which can be used to monitor persistence and evolution of clonal populations within an individual over time. Thousands of unique infected T-cell clones circulate in HTLV-1–infected individuals, many of which persist over decades within each host without transforming to malignant disease.9,10
As HTLV-1–infected T-cell clones divide and die more frequently than uninfected T cells,11 replicative errors probably make a significant contribution to genomic instability and cellular transformation. Expression of viral proteins, Tax and HTLV-1 B-zip protein, can drive proliferation of infected cells. Viral proteins also have potential to be directly genotoxic (reviewed in detail elsewhere12 ), and transgenic mice, which express Tax or HTLV-1 B-zip protein in T cells, develop lymphoproliferative disorders.13 Viral protein expression in turn exposes infected cells to lysis by virus-specific cytotoxic T lymphocytes, which play a critical role in maintaining a steady-state PVL and protecting against development of HTLV-1–associated diseases.
Hundreds of somatic mutations and copy number changes are typically observed in established ATL tumors. PLCG1, PRKCB, PDL1, CCR4, CARD11, STAT3, TP53, VAV1, TBL1XR1, NOTCH1, GATA3, and IRF4 mutated in >10% of cases and are likely drivers.14-16 Mutations in genes involved in T-cell receptor/NF-κB signaling are highly enriched in ATL, implying that there is natural selection for cells bearing these mutations within the niche occupied by T cells. We hypothesized that these mutations are acquired in a stepwise process, and thus, HTLV-1–infected cells carrying ATL-driver mutations must circulate prior to diagnosis with ATL.
We studied serial samples obtained 2 to 10 years prior to diagnosis from 6 HTLV-1–infected individuals with a high PVL who subsequently developed aggressive ATL. Here, we report a longitudinal analysis of tumor-associated genomic variants and HTLV-1 integration sites, which reveal the kinetics of evolution of the malignant clone in ATL and compare these with HTLV-1 carriers who did not develop malignancy. Our results demonstrate that individuals at high risk of ATL can be identified months or years prior to clinical presentation.
Patients and methods
Subjects
Donors attended the National Centre for Human Retrovirology (Imperial College Healthcare NHS Trust, St Mary's Hospital, London). Written informed consent was obtained and research was conducted under the governance of the Communicable Diseases Research Group Tissue Bank, approved by the UK National Research Ethics Service (09/H0606/106, 15/SC/0089).
Tumor and normal samples for whole-exome sequencing
Tumor genomic DNA was extracted from formaldehyde-fixed paraffin-embedded tissue samples (lymph node biopsies from patients A1, A2, L1, L2, and L4 and a skin sample from patient L3). Samples were deparaffinized by incubation in 100% xylene followed by 100% ethanol and extracted using the QIAmp DNA Mini Kit protocol (Qiagen, Hilden, Germany). Where necessary, DNA was cleaned up using the QIAamp DNA Micro Kit and eluted in elution buffer. DNA extracted from flow-sorted CD19+ and CD33+ cells was pooled as germline control “normal” DNA. Cryopreserved PBMCs from each patient were stained with anti-CD2-APC, -CD3-BV421, -CD19-FITC, and -CD33-PE (Biolegend, San Diego, CA). Cells were fixed using ebioscience FoxP3 fixation/permeabilization buffer (Thermo Fisher Scientific, Waltham, MA) and sorted with a BD Aria III. CD4+ T cells were excluded by gating on CD2−CD3− events, following which CD19+ B cells and CD33+ myeloid cells were collected. DNA was extracted using a DNeasy Kit (Qiagen) using the manufacturer’s protocols after an overnight incubation in buffer AL (Qiagen)/phosphate-buffered saline/proteinase K at 62°C.
PVL quantification
PVL was assayed in the molecular diagnostic unit (Imperial College London) as part of routine clinical investigation of HTLV-1 infection. Briefly, the number of copies of the Tax and β-globin genes were quantified by quantitative polymerase chain reaction (PCR).17 The number of HTLV-1 proviruses per 100 PBMCs was calculated as follows: [(copy number of Tax)/(copy number of β-globin/2)] * 100. Quantitative PCR was also used to quantify the abundance of the integration site of the malignant clone in each patient, using 1 primer that annealed in the 3′ end of the provirus, and 1 primer that annealed in genomic DNA adjacent to the UIS (supplemental Table 1, available on the Blood Web site).
Mapping and quantification of HTLV-1 integration sites
Linker-mediated–PCR, high-throughput sequencing, and mapping of viral integration sites were carried out as described in Gillet et al.9 Sonicated genomic DNA (1 μg) was ligated to a partially double-stranded DNA adaptor that contained a 6-bp barcode. Two rounds of nested PCR were used to amplify the region between the HTLV-1 LTR and the adaptor. Libraries of amplicons were sequenced (paired-end 50-bp reads and a 6-bp barcode read) using an Illumina HiSeq or MiSeq platform. Paired reads were then aligned to a human genome reference (Hg18). The number of cells within a HTLV-1–infected clone sequence was estimated by quantification of the number of distinct genomic shear sites generated by sonication. Clone abundance estimates were corrected using a calibration curve.9 The absolute abundance of each unique integration site was calculated as follows: absolute abundance/100 PMBC = (relative abundance UIS/100 HTLV-1–infected cells) * (PVL/100 PBMC)/100.
Computation of OCI
The Gini index18 (oligoclonality index, OCI) was used to compare the clone frequency distribution between samples. The OCI was computed using the ineq package (http://CRAN.R-project.org/package=ineq) in R (http://www.R-project.org/). The OCI ranges between 0 and 1, with 0 indicating that all clones make up an equal proportion of the load, and 1 indicating that a single clone dominates completely. To correct for variable sample size, we applied a type 1 correction as outlined in Turpin et al.19
Whole-exome sequencing
Automated exome capture of DNA extracted from tumor samples and matched normal genomic DNA samples was performed using the SureSelectXT Human All Exon V5 Kit (Agilent, Santa Clara, CA) on the Agilent Bravo automated liquid handling system. Libraries were sequenced using an Illumina HiSeq 2500 or 3000 instrument using SBS v4 reagents (Illumina). Exome coverage was >100×, and >90% of the exome was covered at ≥20× in all samples. Reads were aligned to the Hg19 reference genome using Novoalign software (Novocraft) or BWA-MEM, and variants were called using the GATK pipeline. Germline variants were subtracted using VarScan, and each called somatic mutation was manually inspected using Integrative Genomics Viewer (IGV) (https://software.broadinstitute.org/software/igv/; supplemental Figure 1).
Targeted sequencing of single nucleotide variants (SNVs)
A custom HaloplexHS probe array (Agilent; patient-specific targeted sequencing [PSTS] probes: 14243-1500984167, ATL-mut-scan: 57105-1526479315) was used to capture target regions from 0.5 to 1 µg of genomic DNA in total genomic DNA extracted from PBMC samples (see supplemental Tables 3 and 4 for further details). HaloplexHS libraries were sequenced such that, when demultiplexed, single molecules containing each site of interest were sequenced to a median depth of 2806 unique reads. DeepSNV was used to call variants in reads with PHRED >q30, using the Shearwater ML algorithm (deepSNV R package; https://git.bioconductor.org/packages/deepSNV),20 which uses a β-binomial model to sensitively discriminate sequencing errors from low-frequency SNVs by estimating local sequencing error rates and dispersion at a given locus across all cases and controls. In order to exclude germline variants and test for somatic variants that occur in HTLV-1–transformed cells, a maximum variant allele frequency (VAF) threshold was set at 0.25, as the maximum frequency of HTLV-1–infected cells in the control cohort was 50% of PBMCs. Aligned reads supporting each variant identified was examined using IGV software. Variants that were only seen in a single amplicon and/or that were present in that amplicon only across multiple samples were removed as likely artifacts.21
Graphical analysis of genomic data
Mutations were manually allocated to clusters on the basis of VAF of each mutation at the first time point at which a given mutation was detected (supplemental Figure 2A-F). VAF = 0.01% was set as the lower limit of detection. Data were visualized in R using the fishplot package (https://github.com/chrisamiller/fishplot).22
Results
Genomic profiling of malignant tissue
We identified 6 individuals from whom serial samples had been banked several years before the development of ATL (incident ATL cohort; Table 1). All individuals had a PVL >4% of PBMCs, associated with a high risk of ATL, at all time points tested (Figure 1).
Incident ATL cohort
| Code | Clinical subtype | Stage (lymphoma subtype) | Age at diagnosis, y | Months from HTLV diagnosis to ATL | HTLV-associated disease | Immunomodulatory therapy prior to ATL diagnosis |
|---|---|---|---|---|---|---|
| A1 | Acute | n/a | 57 | 32 | HAM | None |
| A2 | Acute | n/a | 85 | 118 | HAM | Methyl prednisolone |
| L1 | Lymphoma | IVS | 54 | 168 | HAM | Cyclosporine |
| L2 | Lymphoma | IVB | 51 | 29 | SPA | Methotrexate, anti-TNF, hydroxychloroquine, prednisolone |
| L3 | Lymphoma | IV | 53 | 124 | None | None |
| L4 | Lymphoma* | IIA | 33 | 22 | SS | None |
Patients were subtyped according to the Shimoyama classification and Ann Arbor staging systems.
HAM, HTLV-associated myelopathy; n/a, not applicable; SPA, seronegative polyarthritis; SS, Strongyloides stercoralis hyperinfection; TNF, tumor necrosis factor.
This patient also had Epstein-Barr virus–positive cells with Hodgkin disease–like histologic features.31

Abundance of the tumor-dominant HTLV-1 integration site in the peripheral blood. HTLV-1 integration sites were quantitatively mapped by linker-mediated (LM)-PCR followed by high-throughput sequencing. The OCI of each sample was computed (blue data points, plotted on the right y-axis). Pie charts also depict HTLV-1 integration sites at selected time points. Each slice of the pie represents a single unique HTLV-1 integration site, with the tumor-dominant integration site shown in red. LN indicates samples obtained from lymph node biopsies; all other samples are PBMCs. Results were corroborated by quantitative PCR for the tumor-dominant integration site (red data points, left y-axis) and expressed per 100 PBMCs (diploid cells). The PVL was also estimated by quantitative PCR for the Tax gene and expressed as copies per 100 PBMCs (black data points, left y-axis). Time zero indicates the time point at which each individual was diagnosed with ATL. Integration site data from 2 time points from patient A2 have been previously published in Gillet et al,9 and data from 3 time points from patient A1 have been previously published in Bangham et al.32
Abundance of the tumor-dominant HTLV-1 integration site in the peripheral blood. HTLV-1 integration sites were quantitatively mapped by linker-mediated (LM)-PCR followed by high-throughput sequencing. The OCI of each sample was computed (blue data points, plotted on the right y-axis). Pie charts also depict HTLV-1 integration sites at selected time points. Each slice of the pie represents a single unique HTLV-1 integration site, with the tumor-dominant integration site shown in red. LN indicates samples obtained from lymph node biopsies; all other samples are PBMCs. Results were corroborated by quantitative PCR for the tumor-dominant integration site (red data points, left y-axis) and expressed per 100 PBMCs (diploid cells). The PVL was also estimated by quantitative PCR for the Tax gene and expressed as copies per 100 PBMCs (black data points, left y-axis). Time zero indicates the time point at which each individual was diagnosed with ATL. Integration site data from 2 time points from patient A2 have been previously published in Gillet et al,9 and data from 3 time points from patient A1 have been previously published in Bangham et al.32
One individual in the cohort had no evidence of HTLV-1–associated disease, and one had a history of S stercoralis hyperinfection. One had seronegative polyarthritis, and three had HAM/tropical spastic paraparesis. Two patients with HAM had prior therapy: one was treated with cyclosporine, and one was treated with methyl prednisolone. The patient with polyarthritis had a long history of exposure to immunomodulatory therapy (including methotrexate and anti-TNF monoclonal antibodies) and continued to be treated after diagnosis with ATL.
Whole-exome sequencing of genomic DNA extracted from tumor and matched normal tissue (supplemental Figure 1) identified a median of 112 (range 63 to 235) SNVs per tumor (Figure 2, supplemental Table 2). A median of 6 (range 4 to 11) mutations in each individual were in genes previously identified as potential oncogenic drivers in ATL.14 The most frequently mutated gene was PLCG1, in which 4 mutations were observed in tumors from 3 patients. Identical gain-of-function mutations were detected in PRKCB (D630N) and CCR4 (Y331X) in 50% of tumors. TP53 and NOTCH1 were also mutated in 50% of tumors. As reported in Shah et al,16 EP300 was mutated in 2 of 6 cases. The tumor fraction present in malignant tissue was estimated from the VAF (copies per 100 diploid cells) and ranged from 37% to 74%.

Mutational profile of tumors. (A) Resequenced somatic mutations observed in tumor exome sequencing dataset of 6 patients, A1 to 2, and L1 to 4 classified by type. (B) Frequency and type of probable driver mutations and recurrent mutations. Nonsilent mutations (missense-, nonsense-, and splicing-mutations, and frameshift/in frame insertions/deletions), which occurred in genes that are significantly mutated in ATL,14 were considered putative driver mutations (CCR4 to ZFP36L2). Patient A2 had an additional silent mutation in NOXA1; patient L2 also had silent mutations in TP53 and PIK3CD, and an intronic mutation in POT1. Genes that were recurrently mutated within the cohort were also plotted (MUC16 to ZFPM2).
Mutational profile of tumors. (A) Resequenced somatic mutations observed in tumor exome sequencing dataset of 6 patients, A1 to 2, and L1 to 4 classified by type. (B) Frequency and type of probable driver mutations and recurrent mutations. Nonsilent mutations (missense-, nonsense-, and splicing-mutations, and frameshift/in frame insertions/deletions), which occurred in genes that are significantly mutated in ATL,14 were considered putative driver mutations (CCR4 to ZFP36L2). Patient A2 had an additional silent mutation in NOXA1; patient L2 also had silent mutations in TP53 and PIK3CD, and an intronic mutation in POT1. Genes that were recurrently mutated within the cohort were also plotted (MUC16 to ZFPM2).
HTLV-1 integration site mapping
High-throughput sequencing was used to quantitatively map HTLV-1 integrations within tumor samples. Given the observed tumor fraction from exome sequencing data, the dominant HTLV-1 integration site in the tumor tissue (tumor-dominant integration site) was postulated to be present in the malignant clone (Figure 1; eg, Chr18:61944115, patient L1). In 1 individual, A2, 3 unique HTLV-1 integration sites of equal dominance were detected in the tumor tissue, which likely represent 3 unique HTLV-1 integrations within a single malignant clone. In 1 individual (A1), the tumor-dominant integration site was undetermined, as a high frequency of integration site sequencing reads (mean 62% of reads per sample) mapped to repetitive regions of the human genome. All tumor tissues had an OCI typical of cases of ATL.9,19 These observations were confirmed by quantitative PCR for the tumor-dominant integration site.
Cells that carried the tumor-dominant HTLV-1 integration site were detected in all longitudinal blood samples, obtained up to 10 years prior to diagnosis with ATL (Figure 1). In each case, 1 year before diagnosis, the tumor-dominant site was present at >0.5% of PBMCs. The kinetics of clonal expansion fell into 2 patterns: in 4 of 6 cases, the tumor-dominant integration site was also dominant in the peripheral blood (at a frequency of >5% of PBMCs) at the first time point tested, 2 to 10 years prior to full transformation. Of the 2 remaining cases, L2 and A1, the tumor-dominant integration site increased over 2 logs in abundance in the blood in the 2 years before diagnosis.
Targeted deep-sequencing of earlier time points
Having shown that the tumor-dominant HTLV-infected clone was detectable in the blood at early time points, we then asked whether known oncogenic driver mutations were also present in the blood before the diagnosis of ATL. We designed a panel of oligonucleotide probes (PSTS) to enrich and resequence 424 unique variants (all variants occurring in driver genes and all nonsynonymous variants) that had been detected in the tumor biopsies of our cohort (supplemental Figure 1). The PSTS panel redetected a median of 99% (range 89% to 100%) of variants that had been identified by whole-exome sequencing.
Genomic DNA from peripheral blood samples, which had been obtained prior to diagnosis with ATL, was deep sequenced after enrichment with the PSTS probes. Reads derived from unique DNA fragments (identified by the presence unique molecular identifier tags) were sequenced to a median depth of 900× (up to 18 000× in samples in which the frequency of the tumor-dominant integration site was <1% of PBMCs) to give a theoretical sensitivity of 0.01% to 0.2% PBMCs. Not all loci were successfully enriched by the PSTS probes in all samples (71/424 unique variants were not enriched; supplemental Tables 2 and 3). This included 4 known drivers: HLA-A, HLA-B, VAV1 and EP300.
At least 1 tumor-associated mutation was detectable in all PBMC samples from all patients, including the earliest time point tested (Figure 3). Over time, the VAF and number of detectable mutations increased. A year before diagnosis, 50% of all mutations observed in the tumor tissue were detectable in blood (Figure 3A). Mutations in putative drivers were also observed from the earliest time point (Figure 3B; frequency >0.5% of PBMCs at the earliest time point in 5 of 6 cases), and the total number of putative-ATL driver mutations detected increased over time (Figure 3C). Although most tumor-associated mutations were also detectable in the blood at the sample closest to diagnosis, some mutations were restricted to tumor tissue only, suggesting a later role in transformation.
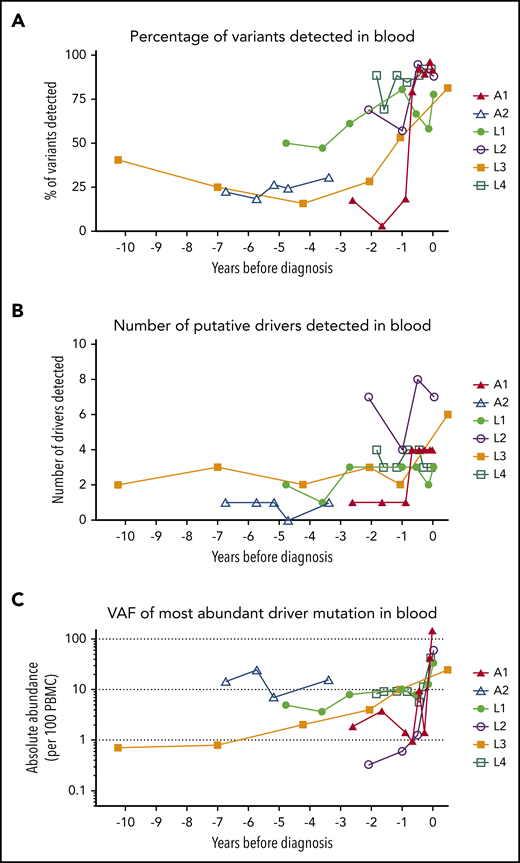
Mutational burden over time. (A) The percentage of tumor somatic variants detected in PBMC samples from in each individual at each time point sampled. The percentage was calculated for each individual as follows: (number of tumor-associated variants detected in PBMC genomic DNA collected at time point)/(total number of tumor-associated variants successfully resequenced using the PSTS probes)*100. (B) The number of putative ATL-driver variants identified in PBMC genomic DNA of each individual. (C) The frequency (copies per diploid genome) of the most abundant putative driver mutation detected in PBMC genomic DNA. Time zero indicates the time point at which each individual was diagnosed with ATL.
Mutational burden over time. (A) The percentage of tumor somatic variants detected in PBMC samples from in each individual at each time point sampled. The percentage was calculated for each individual as follows: (number of tumor-associated variants detected in PBMC genomic DNA collected at time point)/(total number of tumor-associated variants successfully resequenced using the PSTS probes)*100. (B) The number of putative ATL-driver variants identified in PBMC genomic DNA of each individual. (C) The frequency (copies per diploid genome) of the most abundant putative driver mutation detected in PBMC genomic DNA. Time zero indicates the time point at which each individual was diagnosed with ATL.
For each individual, variants were clustered into groups on the basis of allele frequency at each time point to reconstruct the clonal evolution in each patient (Figure 4; supplemental Figure 2). As HTLV-1 is a known driver of ATL oncogenesis, the abundance of the integration site of the tumor-dominant clone was also included in the clustering analysis.
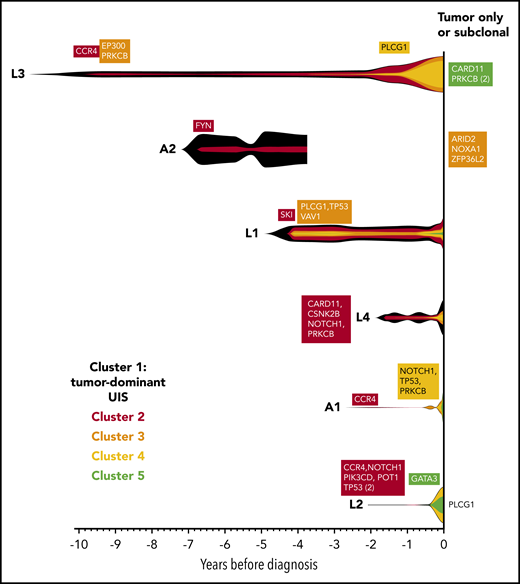
Evolution of the malignant clone in PBMC samples. As the tumors were considered to be clonal, the assumption was made that all high-frequency variants detected in the tumor tissue samples occurred within a single clone, which progressively accumulates additional mutations over time. Variants were manually clustered into groups according to the VAF of each variant at each time point (see supplemental Figure 2A-F). The mean VAF of variants in each cluster at each time point was normalized to the maximum VAF of tumor-associated variants detected in the blood (vertical height of fishplot at time zero = maximum VAF of all tumor-associated variants in the blood, using the formula: (mean VAF of a cluster of variants at a given time point)/(maximum VAF of all tumor-associated variants observed in the blood at any time point). The first time point at which a cluster containing driver mutations was detected is labeled in each case. Subdominant and tumor-only variants were excluded from this analysis and are listed on the right-hand side. Vertical lines indicate the time points at which targeted deep sequencing was carried out using the PSTS probe panel. Time zero indicates the time point at which each individual was diagnosed with ATL.
Evolution of the malignant clone in PBMC samples. As the tumors were considered to be clonal, the assumption was made that all high-frequency variants detected in the tumor tissue samples occurred within a single clone, which progressively accumulates additional mutations over time. Variants were manually clustered into groups according to the VAF of each variant at each time point (see supplemental Figure 2A-F). The mean VAF of variants in each cluster at each time point was normalized to the maximum VAF of tumor-associated variants detected in the blood (vertical height of fishplot at time zero = maximum VAF of all tumor-associated variants in the blood, using the formula: (mean VAF of a cluster of variants at a given time point)/(maximum VAF of all tumor-associated variants observed in the blood at any time point). The first time point at which a cluster containing driver mutations was detected is labeled in each case. Subdominant and tumor-only variants were excluded from this analysis and are listed on the right-hand side. Vertical lines indicate the time points at which targeted deep sequencing was carried out using the PSTS probe panel. Time zero indicates the time point at which each individual was diagnosed with ATL.
As expected, the tumor-dominant HTLV-1 integration site was the most abundant putative driver at the earliest time point. Notably, CCR4 mutations were detected in 3 of 3 individuals in the first cluster of somatic mutations at the earliest time point.
Deep sequencing of PBMCs from premalignant cases and high-risk carriers
We hypothesized that quantification of mutational burden in genes frequently mutated in ATL could identify individuals at high risk of ATL. To test this hypothesis, we designed a panel of probes to enrich loci that are frequently mutated in ATL (ATL-mut-scan; supplemental Table 4). We used this panel to deep-sequence stored samples of PBMC-genomic DNA from a cohort of HTLV-1 carriers who fulfilled the criteria for medium to high risk of ATL (n = 55; median age, 78; median PVL, 10%; range, 1.5% to 50%), but had not reported symptoms of ATL in a median of 10 years follow-up (range, 5-16; supplemental Table 5). Of these controls, 27 had inflammatory disease (HAM, HTLV-related neurological symptoms, arthritis, lupus, or Sjogren syndrome), one had S stercoralis–related disease, and 27 were asymptomatic carriers (ACs) of the virus (supplemental Table 5). Samples of PBMC genomic DNA from 12 HTLV-1–infected individuals at low risk of ATL (PVL undetectable or <1%) were also analyzed. PBMC genomic DNA from the incident ATL cohort (positive controls; collected 1 year prior to diagnosis) was also sequenced using the same protocol.
We performed unbiased high-sensitivity SNV detection using the Shearwater MF algorithm (deepSNV R package20,23 ), estimating the sequencing error rate at each locus in order to sensitively detect low-frequency somatic variants. As expected, all premalignant cases had detectable mutations in loci frequently mutated in ATL, whereas 48 of 55 (87%) of samples from medium and high PVL controls (PVL > 1%) had no detectable mutations in PBMC genomic DNA (Figure 5; supplemental Table 6). One high PVL AC had a single detectable nonsynonymous mutation: a stopgain mutation in the PEST domain of NOTCH1 (Q2405X). Six patients with HAM had one or more nonsynonymous mutations within the panel; however, there was no significant difference in the frequency of ACs who had detectable mutations and patients with inflammatory disease who had detectable mutations. Samples from 2 carriers had somatic TET2 mutations, which are commonly observed in age-related clonal hematopoiesis of indeterminate potential,24 and may occur in non-T cells.
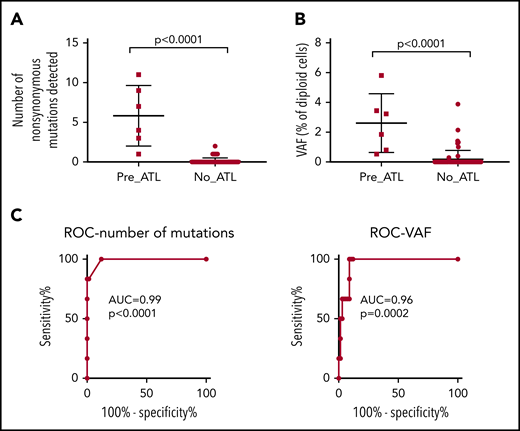
Comparison of premalignant cases with high-risk carriers. PBMC genomic DNA from 6 premalignant cases (1 year prior to diagnosis with ATL), 55 high-risk individuals, and 12 low-risk controls was deep sequenced using the ATL-mut-scan probes (see supplemental Table 5). Variants were identified using the Shearwater ML algorithm by pairwise comparison with the 2 low-risk controls. (A) Number of variants detected per sample. (B) Mean frequency of variant alleles in PBMCs (per diploid genome). Statistics: Mann-Whitney, 2-tailed, 95% confidence interval. (C) ROC curve of the number of mutations detected and the frequency of mutations in the blood. AUC, area under the curve; ROC, receiver operator characteristic curve.
Comparison of premalignant cases with high-risk carriers. PBMC genomic DNA from 6 premalignant cases (1 year prior to diagnosis with ATL), 55 high-risk individuals, and 12 low-risk controls was deep sequenced using the ATL-mut-scan probes (see supplemental Table 5). Variants were identified using the Shearwater ML algorithm by pairwise comparison with the 2 low-risk controls. (A) Number of variants detected per sample. (B) Mean frequency of variant alleles in PBMCs (per diploid genome). Statistics: Mann-Whitney, 2-tailed, 95% confidence interval. (C) ROC curve of the number of mutations detected and the frequency of mutations in the blood. AUC, area under the curve; ROC, receiver operator characteristic curve.
There was a significant difference between premalignant cases and controls in the total number of nonsynonymous variants detected and the mean VAF of ATL drivers (Figure 5A-B). The positive predictive power of having a detectable nonsynonymous mutation in an ATL-driver gene was 71%, and the negative predictive power was 100%, assuming an ATL prevalence rate of 20% in high PVL (>4% of PBMCs infected) carriers. Excluding age-related clonal hematopoiesis of indeterminate potential–associated mutations such as TET2 might improve the predictive power of the capture sequencing approach, as seen in the case of acute myeloid leukemia (AML).24 Receiver operator curve analysis confirmed that mutational profiling of ATL-driver genes had excellent diagnostic specificity (Figure 5C).
Discussion
The key finding of this work is that clonally expanded, premalignant cells bearing putative driver mutations are detectable in the blood prior to overt ATL, but not in age- and PVL-matched HTLV-1 carriers who did not develop ATL during 10 years of clinical observation. Furthermore, we demonstrate that, in a subset of cases, lymphoma-subtype ATL can be detected before symptoms occur by sampling the blood.
Our cohort was predominantly of Afro-Caribbean ethnicity, and the mutational profile of the tumor samples analyzed was broadly similar to data published from other American (of African ethnicity)16 and Japanese14 patients with ATL. Our genomic analysis pipeline was optimized to detect exonic SNVs. Thus, it is likely that we did not detect all the driver events present in each case: additional possible events include intronic driver mutations, copy number variations, changes in chromosome structure, and epigenetic modifications, including changes in chromatin looping. Regardless, we could monitor evolution of the malignant clone, through longitudinal analysis of clustered somatic variants: ATL-driver SNVs, presumed passenger mutations, and HTLV-1 integration sites.
Three of 6 individuals in our cohort had identical CCR4 mutations that occurred in the first detectable cluster of somatic mutations. Importantly, HTLV-1–infected cells that carried CCR4 and other ATL-driver mutations were observed to be stable in the blood for >10 years in some individuals. Thus, the presence of low-frequency ATL-driver mutations does not appear to predict the time to transformation. However, presence of early drivers was associated with clonal dominance within HTLV-1–infected cells: in other words, the frequency distribution of HTLV-1–infected T-cell clones in patients with more than 1 detectable ATL-driver mutation differed significantly from that typically observed in most ACs and HAM/tropical spastic paraparesis patients.9 Five of the 6 individuals we studied had a clone frequency distribution of HTLV-1–infected cells, which was ATL-like (OCI >0.8) over 1 year prior to diagnosis with ATL.
There is robust evidence that ATL-like clonality of HTLV-1–infected cells is associated with an elevated risk of ATL: a cohort study of 50 ACs who had “monoclonal” (detected by the low-resolution semiquantitative Southern blotting) HTLV-1–infected cells in their peripheral blood had an incidence rate of 48 ATL cases per 1000 carrier-years.25,26
Just 1 of the 6 patients in our cohort transformed without transitioning through a >1 year of highly oligoclonal HTLV infection (OCI >0.8). Further longitudinal studies of high PVL carriers at an appropriate age (in the 10-year window prior to the median age of ATL onset in that population) are needed to quantify the proportion of cases that transform rapidly from a polyclonal background.
Somatic cellular selection was evident within the malignant clone: new clusters of mutations became detectable in the blood as time progressed. In the 6-month window before diagnosis with ATL, the frequency of the tumor-dominant integration site and mutations that were present in the mature tumor increased in frequency in the blood. In 3 of 6 cases (A1, L2, and L3), transformation was temporally linked to detection of a new cluster of mutations, at least one of which was a known ATL-driver. In the remainder of cases, either we did not have a sample close to diagnosis (A2) or we did not detect a new putative driver mutation in the blood. As discussed, our analysis pipeline detects only a fraction of driver events: thus, we cannot exclude the possibility that an additional, undetected mutation has occurred that drove full malignant transformation.
These data support a multihit model of ATL oncogenesis. HTLV-1–infected cells containing known oncogenic driver mutations can persist stably for many years, before additional mutations cause progression to ATL. Clonal dominance of HTLV-1–infected cells which carry ATL driver mutations confers an increased risk of malignant transformation in 2 ways. First, proviral sequences within the dominant clone have been shown in vitro and in vivo to drive mitotic proliferation of T cells,27,28 so increasing the risk of further replicative mutations within the dominant clone. Second, the new mutations may act additively (or even synergistically) with the existing driver mutations.
This model of transformation explains the long clinical latency observed in this study, and the observation that ATL-like clonality of HTLV-infected cells is associated with increased risk of ATL. Furthermore, it explains how presence of clonal expansion alone is not predictive of time to transformation: full transformation requires a random genetic event, and thus, is impossible to predict. However, a second hit that offers a strong selective advantage may cause rapid disease progression in some cases. The proportion of cases in which such rapid progression occurs will determine the positive predictive value of assays of HTLV-1 clonality for early detection of ATL.
Similar clonal expansions carrying driver mutations have been observed in the blood prior to diagnosis with AML (clinically defined as >20% of the bone marrow cellular component being composed of immature blast cells). The absolute frequency of expanded pre-AML clones in the blood, the number of detectable mutations, and the presence of particular driver mutations were associated with risk of development of AML.29,30 The time to progression was similar to our cohort of individuals who developed ATL: some individuals had clonal expansions of mutated cells that were stable for 3 to 10 years, whereas others (who had mutations in high-risk genes) expanded rapidly. Individuals with specific high-risk mutations (particularly when these mutations are detected at a young age, <50 years) are also more likely to develop AML; however, an estimated 20% to 46% of AML cases had no detectable mutation in known driver genes before diagnosis. Larger studies are needed to test whether this is also true for ATL.
In conclusion, we have demonstrated that development of ATL involves a progressive accumulation of mutations within an infected T-cell clone. These data also show that early detection of ATL is possible: through mutational profiling of genes frequently mutated in ATL, or alternatively through analysis of a related biomarker, clonality of HTLV-1–infected cells. These results may lead to more effective clinical management of ATL.
For original data, please contact a.rowan@imperial.ac.uk. The integration site analysis data will be deposited at the National Cancer Institute Retrovirus integration database (https://rid.ncifcrf.gov/) hosted by the National Cancer Institute, at the National Institutes for Health. This will be free of any personal identifiers and freely available online. The gene expression analysis will be hosted by the European Genome-Phenome Archive. Access to these data will require formal approval.
The online version of this article contains a data supplement.
The publication costs of this article were defrayed in part by page charge payment. Therefore, and solely to indicate this fact, this article is hereby marked “advertisement” in accordance with 18 USC section 1734.
Acknowledgments
The authors thank the blood donors and clinic staff at the National Centre for Human Retrovirology (www.htlv.eu). They also thank Yanping Guo, of St Mary’s Flow cytometry facility for assistance with flow sorting.
This work was supported by the Wellcome Trust (https://wellcome.ac.uk/) (CRMB Senior Investigator Award WT100291MA), the National Institute for Health Research (NIHR) Biomedical Research Centre based at Imperial College Healthcare NHS Trust and Imperial College London (https://imperialbrc.nihr.ac.uk), and the Guy’s and St Thomas’ NIHR Biomedical Research Centre (http://www.guysandstthomasbrc.nihr.ac.uk/). The views expressed are those of the authors and not necessarily those of the NHS, the NIHR, or the Department of Health.
Authorship
Contribution: A.G.R., R.D., L.B.C., P.A.F., G.P.T., and C.R.M.B. planned the study; P.A.F., G.P.T., and L.B.C. recruited patients; M.-A.D. assayed PVLs; A.G.R., A.W., A.M., N.A.G., and L.B.C. performed integration site analysis; R.D. performed exome and targeted resequencing; A.R., R.D., A.M., and L.J.M. performed bioinformatic analysis; and all authors contributed to writing the paper.
Conflict-of-interest disclosure: The authors declare no competing interests.
The current affiliation for M.-A.D. is the Skin Tumour Unit, Guy’s Hospital, Great Maze Pond, London, United Kingdom.
The current affiliation for N.A.G. is the Department of Veterinary Medicine, Namur Research Institute for Life Sciences (NARILIS), University of Namur, Namur, Belgium.
The current affiliation for L.J.M. is the Department of Pathology, Division of Cellular & Molecular Pathology, Cambridge University, Cambridge, United Kingdom.
Correspondence: Aileen G. Rowan, Medical School Building, Imperial College St Mary’s Campus, Norfolk Pl, London W2 1PG, United Kingdom; e-mail: a.rowan@imperial.ac.uk.

This feature is available to Subscribers Only
Sign In or Create an Account Close Modal