

Key Points
Elevated yearlong leukocyte trajectories predicted PV disease evolution.
No yearlong hematologic laboratory value trajectories predicted thrombosis.

Abstract
There are unresolved questions regarding the association between persistent leukocytosis and risk of thrombosis and disease evolution in polycythemia vera (PV), as much of the published literature on the topic does not appropriately use repeated-measures data or time-dependent modeling to answer these questions. To address this knowledge gap, we analyzed a retrospective database of 520 PV patients seen at 10 academic institutions across the United States. Taking hematologic laboratory data at ∼3-month intervals (or as available) for all patients for duration of follow-up, we used group-based trajectory modeling to identify latent clusters of patients who follow distinct trajectories with regard to their leukocyte, hematocrit, and platelet counts over time. We then tested the association between trajectory membership and hazard of 2 major outcomes: thrombosis and disease evolution to myelofibrosis, myelodysplastic syndrome, or acute myeloid leukemia. Controlling for relevant covariates, we found that persistently elevated leukocyte trajectories were not associated with the hazard of a thrombotic event (P = .4163), but were significantly associated with increased hazard of disease evolution in an ascending stepwise manner (overall P = .0002). In addition, we found that neither hematocrit nor platelet count was significantly associated with the hazard of thrombosis or disease evolution.
Introduction
Polycythemia vera (PV) is a chronic myeloproliferative neoplasm (MPN) defined by an absolute erythrocytosis, distinct bone marrow histologic features, and (with few exceptions) the presence of either V617F or exon 12 mutations in Janus kinase 2 (JAK2).1 These mutations also drive overproliferation of other myeloid-derived cell lines; elevated leukocyte (white blood cell count [WBC]) and platelet counts are frequently observed.2 Patients with PV are at increased risk of venous and arterial thrombotic events, and over time, the disease can evolve to myelofibrosis (MF), myelodysplastic syndrome (MDS), or acute myeloid leukemia (AML).3
The risk-adapted therapeutic approach to PV is centered on prognostic stratification for thrombotic risk. However, uncertainty persists regarding the optimal individualized prognostication tool and the relative impact on thrombotic risk reduction and disease course modification with current treatments and investigational agents. The rarity of the disease, a prolonged time to event for disease evolution (8.5-20 years) and overall survival (OS; 13.5-24 years), and a lack of well-validated surrogate end points for these major outcomes all contribute to this challenge.4,5
Current management of PV aims to reduce incidence of thrombotic events, although active clinical response to therapy is judged by the “normalization” of hematologic laboratory indices (leukocyte count, hematocrit, and platelet count), and reduction in splenomegaly (if present).6 Few of these commonly used clinical parameters have been validated as meaningful surrogate markers for thrombotic risk, disease evolution, or OS. Despite this lack of validation, landmark prospective trials such as RESPONSE (clinicaltrials.gov #NCT01243944),7 upon which ruxolitinib received US Food and Drug Administration (FDA) approval as a second-line agent in PV, use these surrogate end points. Although the prospective CYTO-PV trial (#NCT01645124) showed a significant difference in hazard of thrombosis between those with strict (<45%) and less strict (45%-50%) hematocrit control, there were also significant differences in the median WBC counts between the 2 study arms over the course of patient follow-up.8 These differences were not accounted for in the analyses, leaving ambiguous whether the observed effects were driven by differences in hematocrit, leukocyte count, or both.9
Leukocytosis as a risk factor for thrombosis and disease evolution has been evaluated in multiple retrospective studies with discordant results.4,10-14 These studies share several common limitations: first, leukocytosis is typically defined as a value measured at a single time point (usually diagnosis) in the patient’s period of follow-up. These analyses are therefore potentially poor representations of how a clinician observes or reacts to this laboratory value over time and provide minimal insight into how longitudinal laboratory data or leukocyte “normalization” may associate with thrombotic or evolutionary hazard. Valuable information about cumulative “exposure” to leukocytosis, and information related to the relative benefit of leukoreduction, is discarded.
To address this knowledge gap and to demonstrate statistical methodology that could be applied to any regularly measured biomarker of interest over the course of a patient’s treatment, we used group-based trajectory modeling (GBTM), a type of latent-class analysis that identifies clusters of patients who follow statistically distinct trajectories in biomarker trends over time, to capture the prognostic associations between yearlong leukocyte, hematocrit, and platelet trajectories and the major outcomes of thrombosis and disease evolution in cohorts constructed from a retrospective database of 520 PV patients across 10 academic institutions across the United States.15 To our knowledge, this is the largest United States–only retrospective database of PV patients to date.
Materials and methods
Patients
To construct our initial database, we collected 520 patient records from 10 participating institutions. Institutional review board approval was obtained at the coordinating center and all participating centers before patient data were collected. Research was conducted in accordance with the Declaration of Helsinki. Patients were required to carry a diagnosis of PV as defined by 2016 World Health Organization criteria, to be 18 years of age or older at the time of diagnosis, to have 3 recorded appointments with a hematologist at the participating institution, and to have at least 1 of those appointments fall within the past 10 years (January 2009 to January 2019). We relied on site coordinators to verify these criteria and generate a list of all site patients meeting these criteria from which to select a random sample for database entry. Patient records were reviewed locally, and retrospective data regarding patient demographics, diagnosis, relevant comorbidities, cytogenetics, interval laboratory monitoring, and therapy usage were transmitted to the coordinating site using REDCap electronic data-capture tools hosted by the Icahn School of Medicine at Mount Sinai.16 Time of diagnosis was determined by date of positive JAK2 mutational testing unless the patient received the diagnosis before JAK2 assay availability, in which case the patient’s time of diagnosis was estimated from physician’s notes, provided the patient had documented JAK2 testing at a later point in the disease course. Outcomes were major thrombotic events (including determination of Common Terminology Criteria for Adverse Events grade) as recorded in physician notes, and evolution to MF, MDS, and AML on the basis of a relevant diagnostic bone marrow biopsy and physician documentation within visit notes. Demonstration of bone marrow fibrosis alone without concordant physician’s documentation of disease evolution was not considered a recordable event. Prior medication history, including lines of therapy used, therapy dosages, dose modifications, discontinuations, and adverse events were determined by examining physician’s documentation within encounter notes and medication reconciliation audit records. Patients were included in the GBTM analyses if they had ≥3 repeated laboratory instances within a 12-month time frame, to ensure that there was adequate density of longitudinal data on each patient to appropriately estimate at least second-order polynomial trajectories. According to this landmark approach, patients were excluded if they experienced the outcome of interest (thrombosis or disease evolution) or were censored within the landmark period of 12 months from index time. The index time was defined as the time the first laboratory value meeting the criteria was measured. Survival models begin immediately after the 12-month landmark period after trajectory-modeling index time.
Statistical analysis
GBTM was used to identify clusters of patients with similar patterns of hematologic laboratory values within 12 months of their index visit. This approach applies a multinomial modeling strategy with maximum-likelihood estimation to identify homogenous groups of distinctive trajectories summarized by a finite set of different polynomial functions of time. Selection of the optimal number of trajectory groups was guided by 3 indices15 : (1) the Bayesian information criterion, with the lowest result indicating better fit; (2) entropy, a standardized measure of a patient’s probability of being in the most likely group with values >.80 indicating good classification quality; and (3) proportion of patients belonging to each trajectory group with recommended values >.05.17 We began with a model consisting of 1 group with a quadratic degree polynomial and then increased the group numbers until the number of groups that best fit the data were identified by using a combination of the specified criteria. Once the optimal number of groups was identified, the shape of each group’s trajectory was determined by fitting each group with a cubic degree polynomial and reducing the polynomial orders until the highest order polynomial for each group remained significant. Using these criteria, we selected a 4-group trajectory model for leukocyte count and a 3-group trajectory model for both hematocrit and platelet count with the optimal order of each group’s polynomial function ranging from 0 to 3. We then used 3 diagnostics to evaluate the adequacy of the selected models17 : (1) the average of the posterior probabilities of group membership for individuals assigned to each group exceeding a minimum threshold of .7, (2) the odds of correct classification based on the posterior probabilities of group membership exceeding a minimum threshold of 5, and (3) the estimated probability of group membership differing by less than 50% from the proportion assigned to that group on the basis of the posterior probability of group membership.
GBTM analysis was implemented with the SAS macro PROC TRAJ.18 The output of PROC TRAJ included the equations for the different trajectories along with the assignment of each patient to 1 of the trajectory groups. Patient characteristics were summarized overall and within each trajectory group. Continuous variables were reported as median (range: minimum-maximum) and compared among trajectory groups by using the Kruskal-Wallis test. Nominal variables were reported as n (%) and compared using χ2or Fisher’s exact test as appropriate.
Landmark data sets were defined for each respective event of interest (thrombosis and evolution) that included only the patients who were event free and still under follow-up 12 months after the trajectory-modeling index time. All subsequent survival analyses were conducted on these landmark data sets. For each hematologic laboratory value, the method of Kaplan-Meier was used to estimate distributions of time to thromboses and evolution, with patients not experiencing each respective event of interest censored at their last follow-up assessment. The log-rank test was used to compare distributions among trajectory groups. Multivariable Cox proportional hazards regression was used to estimate hazard ratios for thrombosis and evolution, comparing the risks of experiencing each respective event among the different trajectory groups within each of the hematologic laboratory indices.
All statistical analyses were performed with SAS, version 9.4 (SAS Institute, Cary, NC). Hypothesis testing was 2-sided and conducted at the 5% level of significance.
Results
GBTM was used to identify clusters of patients who followed similar trajectories for hematologic laboratory values over the course of 1 year after their index time: leukocyte count, hematocrit, and platelet count. The consort diagram for patient inclusion in trajectory and survival analyses is shown in Figure 1.
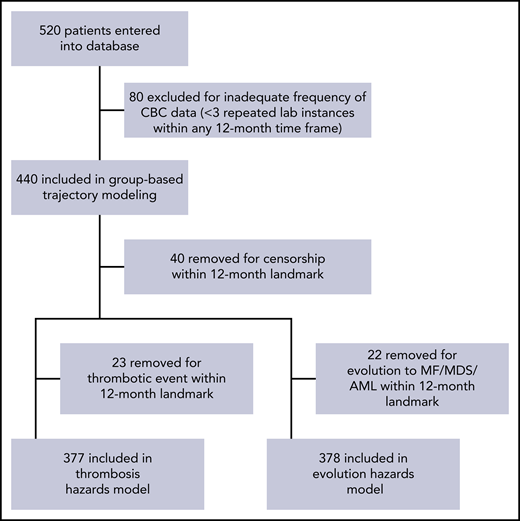
Four leukocyte trajectories were identified, representing patients with stable counts at 5 × 10⁹/L, 10 × 109/L, and 15 × 109/L and oscillating at 35 × 109/L (WBC5, WBC10, WBC15, and WBC35, respectively). Three hematocrit trajectories were then identified, roughly representing levels of 35%, 43%, and 47% (HCT35, HCT43, and HCT47 respectively). Finally, 3 stable platelet trajectories at 125 × 109/L, 300 × 109/L, and 600 × 109 /L (PLT125, PLT300, and PLT600, respectively) were identified (Figure 2). Goodness-of-fit statistics for all trajectories are summarized in the supplemental Table 1 (available on the Blood Web site). Two evaluable subsets of patients (1 for the major outcome of thrombosis and 1 for the composite outcome of disease evolution to MF, MDS, or AML) were constructed and used to plot Kaplan-Meier curves stratified by trajectory membership (Figure 3). The thrombosis subset consisted of 377 patients, with 34 thrombotic events (16 venous, 15 arterial, and 3 superficial venous), with a median follow-up of 48 months. The evolution subset consisted of 378 patients, with 35 evolution events (33 MF, 1 MDS, and 1 AML), also with a median follow-up of 48 months. Trajectories for 24-month landmarks were also constructed and used in subsequent survival models as a sensitivity analysis for the 12-month landmark trajectories; none of the reported results substantially changed, so these analyses are not shown.


Kaplan-Meier plots of trajectories and outcomes of thrombosis and disease evolution.
Kaplan-Meier plots of trajectories and outcomes of thrombosis and disease evolution.
Multivariable Cox proportional hazards models were then constructed to examine the associations between trajectory membership for all 3 hematologic indices and the 2 major outcomes. All models concerning thrombotic events were adjusted for age at diagnosis, sex, duration of disease before institutional contact, history of prior thrombotic event, number of relevant cardiovascular risk factors, and whether the patient was receiving cytoreductive therapy (hydroxyurea, PEG-interferon-α [peg-IFN-α], or ruxolitinib) at any time during the landmark trajectory period. All models concerning disease evolution were adjusted for age at diagnosis, duration of disease before institutional contact, and whether the patient was receiving cytoreductive therapy during the landmark period. Baseline cohort characteristics are summarized in Table 1. A comparison of the baseline characteristics of patients included in trajectory analysis vs those included in subsequent Cox models can be found in supplemental Table 2. The summary and distribution baseline characteristics across trajectory membership can be found in supplemental Table 3.
Relevant baseline characteristics of evaluable patient cohorts constructed to model thrombotic and evolutionary hazards by using GBTM
| Characteristic | Value |
|---|---|
| Thrombosis | |
| Patients, n | 377 |
| Age at diagnosis, y | |
| Median (minimum-maximum) | 58 (20-93) |
| Male, n (%) | 181 (48) |
| Duration of disease prior to contact, mo | |
| Median (minimum-maximum) | 2 (0-358) |
| Prior thrombosis, n (%) | 93 (25) |
| Number of cardiovascular risk factors (median) | 1 |
| Diabetes, n (%) | 38 (10) |
| Hypertension, n (%) | 151 (40) |
| Hyperlipidemia, n (%) | 90 (24) |
| Coronary artery disease, n (%) | 36 (10) |
| History of smoking, n (%) | 97 (26) |
| Follow-up, mo | |
| Median (minimum-maximum) | 48 (12-249) |
| Period of phlebotomy-only during trajectory period, n (%) | 118 (31) |
| On aspirin during trajectory period, n (%) | 340 (90) |
| On hydroxyurea during trajectory period, n (%) | 226 (60) |
| On ruxolitinib during trajectory period, n (%) | 40 (11) |
| On peg-IFN-α2a during trajectory period, n (%) | 34 (9) |
| Evolution | |
| Patients, n | 378 |
| Age at diagnosis | |
| Median (y) | 58 (20-93) |
| Duration of disease (prior to contact), mo | |
| Median (minimum-maximum) | 1 (0-358) |
| Follow-up, mo | |
| Median (minimum-maximum) | 48 (12-193) |
| Period of phlebotomy-only during trajectory period, n (%) | 120 (32) |
| On aspirin during trajectory period, n (%) | 341 (90) |
| On hydroxyurea during trajectory period, n (%) | 223 (59) |
| On ruxolitinib during trajectory period, n (%) | 38 (10) |
| On peg-IFN-α2a during trajectory period, n (%) | 34 (9) |
In our multivariable Cox proportional hazards model examining the association between leukocyte trajectory and thrombosis, no significant association between them was found (P = .4163). There was, however, a significant association between leukocyte trajectory and hazard of disease evolution (P = .0002). Membership in WBC10 did not significantly increase hazard of evolution (P = .1418), whereas membership in WBC15 increased hazard of transformation by 5.51-fold (95% confidence interval [CI], 1.55-19.58; P = .0083), and membership in WBC35 increased hazard of transformation by 24.23-fold (95% CI, 5.0-116.83; P < .0001). In our Cox proportional hazards model examining the association between hematocrit and thrombosis, there was no statistically significant association between hematocrit trajectory and thrombosis (P = .1849). Hematocrit trajectory was also not significantly associated with hazard of disease evolution (P = .5407). Likewise, our models demonstrated no significant association between platelet trajectory and thrombosis (P = .9501) or disease evolution (P = .1670). Findings and distribution of outcome events are summarized in Table 2. In addition, survival models for thrombosis excluding superficial venous thrombotic events can be found in supplemental Table 4.
Distribution of outcomes and hazard estimates per multivariable Cox proportional hazards modeling
| Thrombosis | Evolution | |||||||||
|---|---|---|---|---|---|---|---|---|---|---|
| Event rate | Median time to event (mo) | HR (95% CI)* | P | Overall P | Event rate | Median time to event (mo) | HR (95% CI)† | P | Overall P | |
| Leukocyte trajectory | ||||||||||
| WBC5 | 5/93 (5%) | 28.8 | Reference | 0.4163 | 3/94 (3%) | 72.2 | Reference | .0002 | ||
| WBC10 | 22/190 (12%) | 34.8 | 2.32 (0.86-6.27) | .0957 | — | 16/194 (8%) | 60.2 | 2.55 (0.73-8.89) | .1418 | — |
| WBC15 | 6/80 (8%) | 33.4 | 1.83 (0.54-6.21) | .3340 | — | 13/79 (16%) | 41.1 | 5.51 (1.55-19.58) | .0083 | — |
| WBC35 | 1/14 (7%) | 24.1 | 2.43 (0.26-22.35) | .4333 | — | 4/11 (36%) | 43.0 | 24.23 (5.03-116.83) | <.0001 | — |
| Overall | 34/377 (9%) | 31.9 | — | — | — | 35/378 (10%) | 55.2 | — | — | — |
| Hematocrit trajectory | ||||||||||
| HCT35 | 3/28 (11%) | 34.8 | 0.98 (0.23-4.13) | 0.9771 | .1849 | 1/21 (5%) | 60.2 | 0.53 (0.06-4.56) | .5634 | .5407 |
| HCT43 | 18/256 (7%) | 31.2 | 0.54 (0.25-1.19) | .1267 | — | 29/261 (11%) | 49.3 | 1.38 (0.56-3.43) | .4838 | — |
| HCT47 | 13/93 (14%) | 30.0 | Reference | — | — | 6/96 (6%) | 103.5 | Reference | — | — |
| Overall | 34/377 (9%) | 31.9 | — | — | — | 35/378 (10%) | 55.2 | — | — | — |
| Platelet trajectory | ||||||||||
| PLT125 | 3/32 (9%) | 26.6 | Reference | .9501 | 4/23 (17%) | 36.8 | Reference | .1670 | ||
| PLT300 | 15/159 (9%) | 34.5 | 0.82 (0.24-2.89) | .7629 | — | 12/158 (8%) | 48.2 | 0.45 (0.15-1.39) | .1646 | — |
| PLT600 | 16/186 (9%) | 37.0 | 0.89 (0.25-3.12) | .8532 | — | 19/198 (10%) | 61.8 | 0.34 (0.11-1.04) | .0592 | — |
| Overall | 34/377 (9%) | 31.9 | — | — | — | 35/378 (10%) | 55.2 | — | — | — |
Multivariable hazard ratio (HR) adjusted for age at diagnosis, sex, duration of disease at time of institutional contact, sum of cardiovascular risk factors (diabetes, hypertension, hyperlipidemia, coronary artery disease, and smoking), and whether the patient was receiving cytoreductive therapy (hydroxyurea, peg-IFN-α, or ruxolitinib) at some point during the landmark trajectory-modeling period.
Multivariable HR adjusted for age at diagnosis, duration of disease before institutional contact, and whether the patient was receiving cytoreductive therapy (hydroxyurea, peg-IFN-α, or ruxolitinib) at some point during the landmark trajectory-modeling period.
Discussion
Study limitations
Significant limitations in our study are attributable to its retrospective design. Although all records were reviewed for completeness and coherence of clinical timeline at the coordinating center, reliance on local data entry to provide accurate source information regarding diagnosis, relevant baseline characteristics, and key clinical events was necessary. In the trajectory modeling and Cox proportional hazards analyses, a significant portion of patients who were entered into our database were excluded for lacking the necessary frequency of complete blood counts within a landmark period (≥3 within a 12-month time frame) or for having experienced the event of interest or censorship during that same period. This has the potential to introduce selection bias in several important ways. Patients who are sicker and older may be more likely to maintain established long-term follow-up at a particular center and may be enriched in our study population. The significant number of patients excluded from the Cox model for experiencing an event of interest during the 1-year trajectory-plotting landmark period may represent the most imminently at-risk patients, and their exclusion may significantly bias the effect estimations toward the null. As the event rate after exclusion for both our primary outcomes is low (9% for thrombosis and 10% for evolution), we simply may not possess the ability to detect small but clinically significant associations between trajectories and major outcomes in our data set. We did not collect data on the use of anticoagulant medications (eg, warfarin and direct oral anticoagulants), which, if unevenly distributed across the trajectory groups, may confound their association with thrombosis. Although an association between statin use and reduced incidence of venous thromboembolism has been described in recent years, we did not collect data on statin use and could not therefore control for it.19,20 Bone marrow biopsy specimens for patients who progressed to MF were not accessed or systematically reviewed by an independent hematopathologist. We also acknowledge the significant range of disease durations before institutional contact present in our sample, which may present unknown biases related to patient treatment history that are not fully accounted for in our multivariable analysis. Finally, because we could not practically link our multicenter data set to state-based death registries, information regarding overall mortality of our cohort could not be reliably collected or reported.
Study advantages
Advantages to our study include a multicenter focus, and relatively long period of follow-up (48 months in both patient subsets). The use of GBTM for the analysis of hematologic trajectories is appropriate for several reasons. First, it provides a method of formally identifying latent properties of a retrospective data set and prevents arbitrary categorization of patients using ex ante decision rules that may not accurately fit the structure of the data. In addition, the algorithmic approach of GBTM prevents the investigator from adjusting patient categorization rules post hoc to discover groupings that produce statistically significant associations between exposure and outcome. Most important, the method preserves valuable information contained within the available longitudinal data. Although one could summarize a year’s worth of complete blood count data more simply using a mean or median, this would not be informative with regard to how the change of a particular laboratory value over the period of treatment associates with major outcomes. Had we been able to identify crossover trajectories in our data set, we would have tested associations between leukocyte control and major outcomes. We postulate that the application of our method to larger or more granular data sets may accomplish this, for leukocytosis or other hypothesized prognostic indicators of thrombosis, such as the JAK2V617F variant allele fraction. Finally, the constructed trajectories may be a superior method of representing cumulative exposure to an elevated leukocyte count, hematocrit, or platelet count. This is important to consider, as (particularly arterial) thrombotic risk may not only derive from an instantaneous interaction between a clonal-derived mutant leukocyte and activated clotting factors, but also from cumulative immune-related damage to the vascular endothelial wall.21 An analysis of just the arterial or venous events in our data set was prohibited by the low event rate. Our null results (in a data set with a low event rate consisting of mixed arterial and venous thrombotic events) cannot conclusively favor one mechanism over another, but may provide a framework for an analytic approach in a more robust data set.
Relevance
A recent meta-analysis by Carobbio and colleagues22 highlighted several common deficiencies to retrospectively identify leukocytosis as a prognostic marker for major PV outcomes. First, only 5 of the 40 studies used any form of time-dependent modeling.13,23-25 Of the cited analyses that use time-dependent modeling, at least 2 can be critiqued for how time and repeated measures are used. The post hoc analysis of CYTO-PV by Barbui and colleagues23 constructs a hazard model by stratifying patients on leukocyte count at the time of the thrombotic event or censorship. However, by defining the exposure as measured at the time of the outcome (without using the time-varying covariate to correct for the variable time-based element now included in that exposure definition), their results may be susceptible to guarantee-time bias. In other words, although patients with lower leukocyte counts may experience thrombotic events later, it is also possible that patients who progress further without experiencing an event will develop lower leukocyte counts. Buxhofer-Ausch and colleagues25 accounted for influence of leukocyte count by reducing these values to a mean of all values taken for the duration of follow-up until thrombosis or censoring. This study may be susceptible to a similar bias as just described. By contrast, our use of modeled trajectories over a period of clinical follow-up allows for the retention of a descriptive picture of these hematologic parameters over time and incorporates this information into a survival model, constituting an approach that is not susceptible to these same types of bias.
Even meta-analyses combining many retrospectively derived risk or hazard estimates are not capable of establishing a causal relationship between leukocytosis and thrombosis, or validating leukocyte control as a surrogate end point for the outcomes of thrombosis or disease evolution. These questions may only be answerable with larger scale epidemiologic studies using causal inference methods, or ideally by prospective clinical trials. However, we believe that the methodology used in this study could serve as a blueprint for analyzing observational prospective or larger retrospective data sets that aim to investigate relationships between trends in relevant biomarkers and major outcomes in PV.
Our analysis of leukocyte trajectory on hazard of evolution warrants dissection. A persistent leukocyte count of 35 × 109/L may be suggestive of pathologic transformation to myelofibrosis, although lacking a formal diagnosis until bone marrow biopsy is performed (or lacking the appropriate documentation of diagnosis in a participating site’s electronic medical record). The precision around this effect estimate is low because of the relatively small number of at-risk patients included in this trajectory. A more interesting finding concerns the stepwise increase in evolutionary hazard from WBC10 through WBC35, suggesting that persistent leukocytosis may function as a marker of disease aggressiveness. To our knowledge, this is the largest formal assessment of this association using appropriate time-dependent methods and the first to take advantage of longitudinally available laboratory data. Again, whether therapeutic control of the observed leukocytosis abrogates the hazard of disease evolution could not be determined. The best method for assessing the effect of leukocyte control on the hazard of disease evolution would be through a prospective clinical trial. The results of such a trial would have broad clinical impact, particularly in regard to the management of low-risk patients (younger than 60 years and the absence of prior thrombosis) with persistent leukocytosis.
In conclusion, in a retrospective cohort of 520 patients pooled from 10 institutions across the United States, a landmark approach to group-based trajectory modeling and multivariable Cox proportional hazards regression was used to test the associations between longitudinally measured hematologic laboratory value trajectories and major disease outcomes. The hazard of thrombosis was not significantly associated with any hematologic laboratory value trajectory, although the hazard of disease evolution to MF, MDS, and AML significantly increased with increasing leukocyte trajectory in a stepwise manner. A prospective trial of leukocyte control in otherwise uncontrolled patients with a primary end point of disease evolution may therefore be warranted.
The full anonymized database can be made available electronically to any investigator requesting it by e-mail to the corresponding author.
The online version of this article contains a data supplement.
The publication costs of this article were defrayed in part by page charge payment. Therefore, and solely to indicate this fact, this article is hereby marked “advertisement” in accordance with 18 USC section 1734.
Acknowledgments
This work was supported by an unrestricted educational grant from PharmaEssentia. PharmaEssentia did not participate in the conception of the project, acquisition of data, analysis of the data, or writing of the manuscript.
Authorship
Contribution: L.R. designed research, collected data, analyzed data, and wrote the paper; N.P., J.G., M.L.H., A.T.K., C.O., J.S., A.G.F., R.M.S., R.M., and A.Y. interpreted data and critically revised for important intellectual content; C.P., S.M., L.B., M.C., and M.S. designed research and collected data; K.Z. collected and analyzed data; H.N. collected data; O.S. designed research and collected data; A.K.H., M.J.M., J.N., S.P., R.K., A.D., M.R., M.G., M.H., and P.F.S. collected data; D.T. designed research, collected and analyzed data, and revised for important intellectual content; R.H. interpreted data and revised for important intellectual content; E.M. designed research, designed the analytical plan, analyzed data, wrote the paper, and revised for important intellectual content; J.M. designed research, designed the analytical plan, and revised for important intellectual content.
Conflict-of-interest disclosure: J.M. has received clinical trial funding from Incyte, Roche, Novartis, Merck, CTI Biopharma, Janssen, and Promedior and has served as an advisor to Roche, Celgene, CTI Biopharma, PharmaEssentia, and Incyte. N.P. has consulted for and received honoraria from Alexion, Pfizer, Agios Pharmaceuticals, Blueprint Medicines, Incyte, Novartis, and Celgene; has received clinical trial funding (all to the institution) from Boehringer Ingelheim, Astellas Pharma, Daiichi Sankyo, Sunesis Pharmaceuticals, Jazz Pharmaceuticals, Pfizer, Astex Pharmaceuticals, CTI Biopharma, Celgene, Genentech, AI Therapeutics, Samus Therapeutics, Arog Pharmaceuticals, and Kartos Therapeutics and grant funding from Celgene. M.H. has consulted for Incyte, AbbVie, Partner Therapeutics, Novartis, and Roche and has received research funding from Incyte, Roche, Blueprint, BMS, Constellation, Deciphera, Celgene, and CTI Biopharma. A.K. consults for and has received research funding from Janssen, honoraria from AbbVie and Incyte, and speaker’s fees from Celgene and is on the speakers bureau for Incyte. C.O. has received research funding from Astex and Genentech and is on the board of directors or advisory committees for Astex, Pfizer, BMS, and Shionogi. J.S. has consulted for Incyte, Celgene, Alexion, Sanofi, Novartis, and Otsuka Pharmaceutical; has received honoraria from Incyte, Celgene, Alexion, Sanofi, Novartis, and Otsuka and research funding from Incyte, Celgene, Alexion, Onconova, and Astex Pharma; is on the speakers bureau of Incyte, Celgene, Alexion, and Sanofi; and is a member of the board of directors for Apellis Pharmaceuticals. A.F. is on the speakers bureau for Incyte and Celgene. R.S. has consulted for Gilead and Incyte and is on the ad board for Blueprint Medicines. R.M. has consulted for Novartis, Sierra Oncology, and La Jolla Pharmaceutical and has received research funding from Celgene, Incyte, AbbVie, Samus Therapeutics, Genotech, Promedior, and CTI BioPharma. A.Y. is on the speakers bureau of Agios Pharmaceuticals, Incyte, Seattle Genetics, and Novartis; has received honoraria from Incyte; and has equity ownership in HylaPharm, Dynavax, Cara Therapeutics, and Ardelyx. R.H. receives research funding from Dompe, Novartis, Janssen, Scholar Rock, Summer Road, Elstar, and Merus. The remaining authors declare no competing financial interests.
Correspondence: John Mascarenhas, Division of Hematology/Oncology, Tisch Cancer Institute, Icahn School of Medicine at Mount Sinai, One Gustave L. Levy Pl, Box 1079, New York, NY 10029; e-mail: john.mascarenhas@mssm.edu.
