

Key Points
Dnmt3a loss and IDH2 neomorphic mutation synergistically induce hematopoietic malignancy.
Dnmt3aKO-IDH2 mutant mouse leukemia is sensitive to HDAC inhibition and overproduces prostaglandin E2, to maintain abnormal self-renewal.

Abstract
Mutations in the epigenetic regulators DNMT3A and IDH1/2 co-occur in patients with acute myeloid leukemia and lymphoma. In this study, these 2 epigenetic mutations cooperated to induce leukemia. Leukemia-initiating cells from Dnmt3a−/− mice that express an IDH2 neomorphic mutant have a megakaryocyte-erythroid progenitor–like immunophenotype, activate a stem-cell–like gene signature, and repress differentiated progenitor genes. We observed an epigenomic dysregulation with the gain of repressive H3K9 trimethylation and loss of H3K9 acetylation in diseased mouse bone marrow hematopoietic stem and progenitor cells (HSPCs). HDAC inhibitors rapidly reversed the H3K9 methylation/acetylation imbalance in diseased mouse HSPCs while reducing the leukemia burden. In addition, using targeted metabolomic profiling for the first time in mouse leukemia models, we also showed that prostaglandin E2 is overproduced in double-mutant HSPCs, rendering them sensitive to prostaglandin synthesis inhibition. These data revealed that Dnmt3a and Idh2 mutations are synergistic events in leukemogenesis and that HSPCs carrying both mutations are sensitive to induced differentiation by the inhibition of both prostaglandin synthesis and HDAC, which may reveal new therapeutic opportunities for patients carrying IDH1/2 mutations.
Introduction
In the classic theory of leukemogenesis, transformation requires the acquisition of distinct mutations with different biological outcomes. In this 2-hit model, 1 mutation causes the cells to proliferate (class 1), and the other mutation blocks differentiation (class 2).1,2 Recent studies of hematologic malignancies have found mutations in epigenetic regulators, which has generated interest in the mechanisms through which they promote malignancy. Somatic mutations in epigenetic modifier genes are known to block differentiation and promote malignant hematopoiesis by acting in concert with class 1 and 2 mutations.3-5 Mutations in the class 1 or class 2 categories are mutually exclusive in The Cancer Genome Atlas data sets.6 However, mutations in epigenetic regulators frequently co-occur in a patient. Considering that mutations in epigenetic regulators affect the differentiation of hematopoietic stem and progenitor cells (HSPCs), the co-occurrence indicates that mutations in epigenetic regulators such as DNA methyltransferase 3A (DNMT3A) are less potent than other driving mutations in leukemogenesis. Therefore, they may be selected to induce a preleukemic state in co-occurring pairs. Indeed, these epigenetic regulator mutations are frequently observed in clonal hematopoiesis and carry an increased leukemia risk.7-9
We have shown that mutations in Dnmt3A and Tet2 can promote leukemia development synergistically in a mouse model.10 Mutations in 2 epigenetic modifier genes, DNMT3A and isocitrate dehydrogenase-1 and -2 (IDH1/2), co-occur nonrandomly in 5% to 8% of patients who have either myelodysplastic syndrome (MDS) or acute myeloid leukemia (AML), as well as in >10% of patients with T-cell lymphoma.6,11-13 DNMT3A and IDH1/2 mutations have been shown to co-occur in preleukemic stem cells at the single-cell level, suggesting a synergy in underlying biological pathways.14 The frequent co-occurrence of these mutations led us to hypothesize that they interact to promote the development of leukemia.
DNMT3A is a de novo DNA methyltransferase that methylates CpG dinucleotides. DNMT3A loss in hematopoietic stem cells (HSCs) has been shown to promote stem cell expansion and to inhibit differentiation, leading to the development of hematopoietic malignancies.15-17 DNMT3A is one of the most frequently mutated genes in human AML and is also often mutated in other myeloid and lymphoid malignancies.18 We have shown that the loss of DNMT3A in the mouse can promote the expansion of HSCs similar to the introduction of mutant DNMT3A.16,19,20 Also, Dnmt3a-knockout (KO) mice developed myeloid malignancies in a noncompetitive transplantation setting.17 Mutations in the IDH1/2 gene result in a neomorphic protein overproducing 2-hydroxyglutarate (2-HG), a compound that mimics α-ketoglutarate. 2-HG inhibits the enzymatic activity of Fe(II) 2-dioxygenases such as TET, which normally use α-ketoglutarate as their substrate.21,22 Thus, IDH1/2-mutated cells display DNA hypermethylation and histone lysine hypermethylation because of the inhibition of TET1-3 proteins and Jmjc-containing proteins. The differentiation of IDH1/2-mutated cells is blocked. Despite the contrasting effects that mutations in DNMT3A and IDH1/2 have on DNA methylation, they co-occur in MDS, AML, and T-cell lymphoma, suggesting a mechanistic synergy.
We hypothesized that a co-occurrence of mutations in epigenetic regulators promotes malignancy, and we tested this hypothesis by combining neomorphic IDH2 with DNMT3A loss in mice. Mice with changes in both epigenetic regulators rapidly developed MDS and MDS/myeloproliferative neoplasms and replicated many features of patients with both mutations. By analyzing the impact of these mutations at the epigenetic level, we show for the first time that they potentiated each other by perturbing both histone and DNA methylation, simultaneously promoting stem cell self-renewal and suppressing differentiation. Treatment of these Dnmt3a-Idh2 double-mutant mice with either a histone deacetylase inhibitor or a prostaglandin synthesis inhibitor promoted hematopoietic differentiation and extended their life span. Our data provide significant new insights into how mutations in 2 distinct epigenetic regulators can collaborate to promote leukemia development.
Methods
Bone marrow transplantation and retroviral transduction
Dnmt3af/f and Mx-Cre+;Dnmt3af/f mice were injected with polyinosinic-polycytidylic (pI/pC) acid (Sigma) every 2 days for 12 days, and 5-FU was injected 1 month after the last pI/pC injection. Six days after 5-FU injection, the mice were euthanized, and Sca1+ cells were selected for and cultured as described previously.16 The virus was made by transfecting 293T cells with MSCV-Idh2R140Q-IRES-GFP or MSCV-Idh2-IRES-GFP, together with the pCL-Eco vector. Sca1+ bone marrow cells (0.5 × 10⁵) were plated in 1 mL of Stempro-34 medium (Invitrogen) with mouse TPO (100 ng/mL; Invitrogen), mouse SCF (Invitrogen, 10 ng/mL), and polybrene (4 µg/mL; Sigma). Then, Sca1+ cells were spin transduced at 1100 rpm with 0.5 mL of virus-containing supernatant for 2 hours at room temperature and kept at 37°C for 3 hours. Sca1+ cells were then collected and retro-orbitally injected (1 × 10⁴ cells per recipient) into lethally irradiated (9.5 Gy) 45.1 mice.
Secondary transplantation of Dnmt3aKO-IDH2R140Q (3aKO-140) c-kit+ cells was performed as follows. Bone marrow cells from 3aKO-140–recipient mice were first incubated with a cocktail containing biotinylated anti-mouse CD45.1, CD4, CD8, CD19, Mac1, Gr1, Ter119, and B220 antibodies (all from BD Bioscience). The cells were then incubated with anti-streptavidin magnetic beads. Lin+ and recipient-derived CD45.1+ cells were eliminated by magnetic depletion. Cells were then stained with anti-c-kit PE and anti-Sca1 PE-Cy7 antibody for fluorescence-activated cell sorting on a BD Aria II. Lin–Sca1–c-kit+ cells (0.1 × 10⁵) were transplanted into sublethally irradiated mice (6 Gy).
Reduced representation bisulfite sequencing and analysis
We generated reduced representation bisulfite sequencing (RRBS) libraries, as previously described.23,24
Genomic DNA (100-200 ng) was digested with 10 units of MspI (NEB), which cuts at CCGG sites in a methylation-insensitive manner. Digested fragments were end repaired, A tailed, and ligated to Illumina adaptors. After ligation, libraries were bisulfite-treated using the EpiTect Bisulfite Kit (Qiagen, Valencia, CA). Ligation efficiency was tested by polymerase chain reaction (PCR) using TrueSeq primers and Pfu TurboCx hot start DNA polymerase (Stratagene). After determining the optimized PCR cycle number for each sample, a large-scale PCR reaction (100 µL) was performed as described previously. PCR products were sequenced with Illumina HiSeq2000 sequencing systems.
RNA sequencing and analysis
RNA was isolated with the RNeasy Micro Column (Qiagen). Paired-end libraries were generated by using Illumina TruSeq RNA sample preparation kit. Illumina HiSeq 2000 was used for sequencing, with a paired-end sequencing length of 100 bp. Adapter and base quality trimming were performed as described above. RNA-sequencing (RNA-seq) reads were mapped using TopHat version 2.0.1025 against mouse genome build mm9 using parameters optimized for high sensitivity (–read-realign-edit-dist 0–min-anchor-length 6–microexon-search).
Chromatin immunoprecipitation sequencing
Megakaryocyte erythroid progenitors (MEPs) and 3aKO-140 MEP-like HSPCs were sorted and crosslinked with 1% formaldehyde at room temperature for 10 min, and the reaction was stopped by addition of 0.125 M glycine at room temperature for 5 min. Cross-linked cells were lysed and sonicated to 200- to 500-bp fragments (Bioruptor; Diagenode). Chromatin immunoprecipitation (ChIP)–qualified antibodies (H3K4me3 Millipore 07-473; H3K27ac, ab4729) were added to the sonicated chromatin and incubated at 4°C overnight. Following this, 10 μL of protein A magnetic beads (Dynal; Invitrogen) previously washed in radioimmunoprecipitation assay buffer was added and incubated for an additional 2 hours at 4°C. The bead-protein complexes were washed 3 times with radioimmunoprecipitation assay buffer and twice with Tris/EDTA buffer. Following transfer into new 1.5-mL collection tubes, genomic DNA was eluted for 2 hours at 68°C in 100 µL of complete elution buffer (20 mM Tris [pH 7.5]; 5 mM EDTA, 50 mM NaCl, 1% sodium dodecyl sulfate, and 50 µg/mL proteinase K) and then was combined with a second elution of 100 µL elution buffer (20 mM Tris [pH 7.5], 5 mM EDTA, 50 mM NaCl) for 10 minutes at 68°C. ChIPed DNA was purified by MinElute Purification Kit (Qiagen) and eluted in 22 µL of elution buffer. ChIPed DNA was successfully made into a library with a ThruPLEX-FD Preparation Kit (Rubicon, Ann Arbor, MI). Sequencing was performed according to the manufacturer’s protocol on a HiSeq 2000 (Illumina). Sequenced reads were mapped to the mm9 mouse genome, and peaks were identified by model-based analysis of ChIP-seq data.
HDAC inhibitor assays in vitro and in vivo
3aKO-140 c-kit+ donor-derived bone marrow cells were isolated with CD117 microbeads. For the colony-forming assay, 1 × 10⁴ c-kit+ cells were seeded in Methocult M3434 medium (Stem Cell Technologies) with the addition of a pan-HDAC inhibitor, either vorinostat (Cayman Chemical) or panobinostat (Cayman Chemical). The number of colonies was counted 7 to 10 days after the start of the culture.
For in vivo assessment of HDAC inhibitors, 5 × 10⁴ 3aKO-140 c-kit+ cells were transplanted into sublethally irradiated CD45.1-recipient mice. Starting 1 week after transplantation, mice received one intraperitoneal injection of 10 mg/kg panobinostat or dimethyl sulfoxide (DMSO) for 12 consecutive days. The mice were analyzed for leukemogenesis by blood parameters and engraftment over time.
Metabolome profiling
Secondary recipient mice of Dnmt3a−/−;Idh2R140Q, Dnmt3aWT;Idh2R140Q, Dnmt3aKO, and wild-type (WT) genotypes were euthanized at the same time in the afternoon for circadian integrity, and bone marrow cells from each group of mice were isolated. Recipient-derived 45.1+ cells were depleted by incubating with anti-45.1 biotin antibody (BD Bioscience) and then with anti-streptavidin magnetic bead (Miltenyi Biotec). The 45.1-depleted cells were then incubated with anti-mouse CD117 (c-kit) magnetic beads (Miltenyi Biotec), from which c-kit+ cells were isolated. Five million cells were counted, washed with phosphate-buffered saline once, and snap-frozen on dry ice. The cells were then extracted for metabolites as previously described26 and analyzed by gas chromatography-mass spectrometry and liquid chromatography-mass spectrometry.
Prostaglandin E2 production measurement
c-Kit+ HSPCs from WT, single-mutant, and double-mutant mice were isolated with the same procedure described for metabolome measurement. HSPCs were incubated in RPMI 1640 medium supplemented with 10 ng/mL each of IL3 and IL6, plus 50 ng/mL SCF. The culture medium was collected 24 hours after the incubation of HSPCs. Prostaglandin E2 (PGE2) in the culture medium of HSPCs was measured by an ELISA kit (Cayman Chemical) according to the manufacturer’s protocol.
Results
Acceleration of myeloid malignancies in Dnmt3a−/−;Idh2R140Q mice
We first created a double-mutant mouse model that had a Dnmt3a KO and an Idh2 mutation. We used transplantation and retroviral transduction on both Dnmt3a KO (Dnmt3a−/−) and WT (Dnmt3aWT) backgrounds (supplemental Figure 1A, available on the Blood Web site) to generate hematopoietic stem and progenitor cells (HSPCs) that overexpressed mouse Idh2R140Q, one of the most common IDH1/2 mutations in AML patients. We also confirmed that when mouse Idh2R140Q was introduced retrovirally into 32D cells, those cells overproduced 2-hydroxylglutarate (2-HG)27,28 (supplemental Figure 1B). The engineered HSPCs were transplanted into lethally irradiated recipients to reconstitute hematopoiesis. Idh2WT-overexpressing mice served as a control group (supplemental Figure 1C). We observed an increase in the percentage of double-mutant–derived (CD45.2+ GFP+) cells and a bias toward myeloid cell expansion in the Idh2R140Q-overexpressing group compared with the Idh2WT-overexpressing group (supplemental Figure 1D-E).
At 180 days after transplantation, we observed a range of hematopoietic disorders in the Dnmt3a−/−;Idh2R140Q (3aKO-140) mice that had a median survival (197 days) that was significantly shorter than in any comparison group (Figure 1A). Anemia, thrombocytopenia, and monocytosis (Figure 1B-E) were apparent in the 3aKO-140 mice. An examination of bone marrow samples showed the accumulation of less-differentiated myeloid progenitors and sharply elevated extramedullary hematopoiesis in those mice compared with findings from the Dnmt3aWT;Idh2R140Q- and Idh2WT-overexpressing groups (supplemental Figures S1F, and 2C,E-F). Immature myeloid progenitor cells were also observed in peripheral blood, as was multilineage dysplasia (Figure 1F-I; supplemental Figure 2A-B,D). Of the 3aKO-140 mice examined, 2 of 8 developed overt AML (Figure 1I). In contrast, Dnmt3aWT;Idh2R140Q (WT-140) mice showed less-striking changes characterized by myeloid differentiation bias, dysmegakaryopoiesis, and extramedullary hematopoiesis, but without any lethal events almost 1 year after transplantation (supplemental Figures 1E-F and 2). The Dnmt3a−/−;Idh2WT (3aKO-WT) mice were healthy when examined at 200 days after transplantation (Figure 1A; supplemental Figure 2). 3a-WT mice later developed a series of fatal hematopoietic malignancies, including myelofibrosis, granulocytic leukemia, and MDS (data not shown), consistent with our previous observations.17 Finally, the Dnmt3aWT;Idh2WT (WT-WT) mice showed no evidence of hematopoietic disease at 1 year after transplantation.
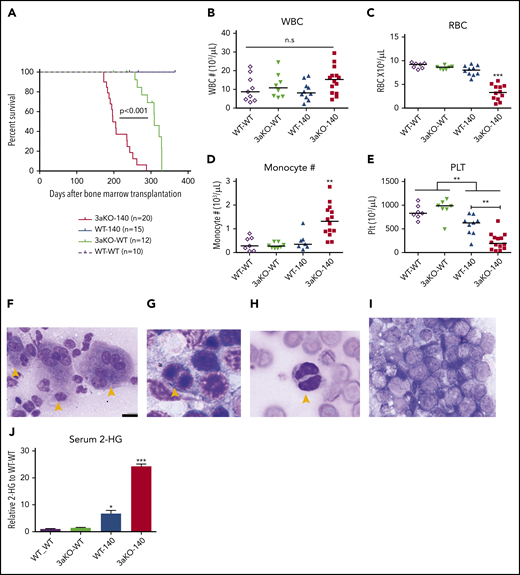
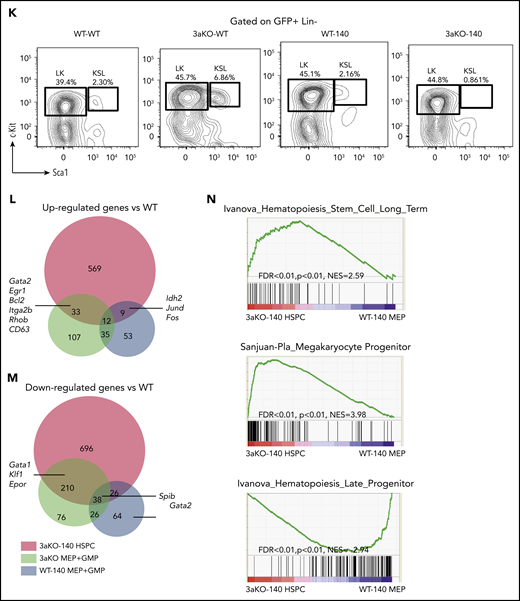
Dnmt3a loss of function and an Idh2 neomorphic mutant interacted to promote myeloid malignancies. (A) Kaplan-Meier survival curves for mice receiving different genetically modified stem cells. P value by log-rank test. (B-E) Blood cell counts in the transplant-recipient groups shown in panel A at 180 to 220 days after transplantation. White blood cells (B), red blood cells (C), monocytes (D), and platelets (E). **P < .01; ***P < .001, by 1-way ANOVA and post hoc Bonferroni test. (F-I) Bone marrow Giemsa stain showing multilineage dysplastic features of Dnmt3a–/–;Idh2R140Q (3aKO-140) mice that developed MDS/myeloproliferative neoplasms (5/8 animals) and MDS (1/8 examined animals). (F) Dysmegakaryopoiesis; yellow arrowheads indicate dysplastic multinucleated and monolobular megakaryocytes. (G) Dysgranulopoiesis; yellow arrowhead indicates pseudo-Pelger-Hüet neutrophils. (H) Dyserythropoiesis; yellow arrowhead indicates a binucleated erythroid progenitor. (I) AML blast in bone marrow of 3aKO-140 recipient (2/8 examined animals developed AML). (F) Bar represents 20 μm. (J) Mass spectrometry measurements of 2-HG in the serum of genetically manipulated mice relative to WT controls. Mean ± standard deviation (n = 3 per group); *P < .05; ***P < .001. (K) Loss of KSL stem cell pool in GFP+ bone marrow cells of recipient mice in the 3aKO-140 group (n = 3 for each genotype, representative flow plots are shown for each genotype). (L-M) Venn diagrams of genes upregulated (L) and downregulated (M) in 3aKO-140 MEP-like HSPCs, Dnmt3aKO MEP+GMPs, and WT-140 MEP+GMPs, relative to WT MEP+GMPs. Examples of overlapping differentially expressed genes from 2 different genotypes are labeled. (N) Stem cell gene and megakaryocyte progenitor gene signatures were enriched in overexpressed transcripts in 3aKO-140 MEP-like HSPCs relative to WT-140 MEP+GMPs; late progenitor genes were depleted in 3aKO-140 MEP-like HSPCs. n.s., not significant.
Dnmt3a loss of function and an Idh2 neomorphic mutant interacted to promote myeloid malignancies. (A) Kaplan-Meier survival curves for mice receiving different genetically modified stem cells. P value by log-rank test. (B-E) Blood cell counts in the transplant-recipient groups shown in panel A at 180 to 220 days after transplantation. White blood cells (B), red blood cells (C), monocytes (D), and platelets (E). **P < .01; ***P < .001, by 1-way ANOVA and post hoc Bonferroni test. (F-I) Bone marrow Giemsa stain showing multilineage dysplastic features of Dnmt3a–/–;Idh2R140Q (3aKO-140) mice that developed MDS/myeloproliferative neoplasms (5/8 animals) and MDS (1/8 examined animals). (F) Dysmegakaryopoiesis; yellow arrowheads indicate dysplastic multinucleated and monolobular megakaryocytes. (G) Dysgranulopoiesis; yellow arrowhead indicates pseudo-Pelger-Hüet neutrophils. (H) Dyserythropoiesis; yellow arrowhead indicates a binucleated erythroid progenitor. (I) AML blast in bone marrow of 3aKO-140 recipient (2/8 examined animals developed AML). (F) Bar represents 20 μm. (J) Mass spectrometry measurements of 2-HG in the serum of genetically manipulated mice relative to WT controls. Mean ± standard deviation (n = 3 per group); *P < .05; ***P < .001. (K) Loss of KSL stem cell pool in GFP+ bone marrow cells of recipient mice in the 3aKO-140 group (n = 3 for each genotype, representative flow plots are shown for each genotype). (L-M) Venn diagrams of genes upregulated (L) and downregulated (M) in 3aKO-140 MEP-like HSPCs, Dnmt3aKO MEP+GMPs, and WT-140 MEP+GMPs, relative to WT MEP+GMPs. Examples of overlapping differentially expressed genes from 2 different genotypes are labeled. (N) Stem cell gene and megakaryocyte progenitor gene signatures were enriched in overexpressed transcripts in 3aKO-140 MEP-like HSPCs relative to WT-140 MEP+GMPs; late progenitor genes were depleted in 3aKO-140 MEP-like HSPCs. n.s., not significant.
These results indicated that the combination of Dnmt3a loss of function and overexpression of the Idh2R140Q mutant promoted earlier and more-severe impairment of hematopoiesis than either mutation alone. We used gas chromatography-mass spectrometry to measure the level of 2-HG in the serum of mice. 3aKO-140 mice showing disease symptoms had an eightfold increase in serum 2-HG compared with the WT-140 group (Figure 1J). This further elevation could account for the higher prevalence of abnormal differentiation and dysplastic features in the bone marrow specimens from 3aKO-140 mice with increased disease burden.
Next, we asked if the combined effect of Dnmt3a−/− and Idh2R140Q extended to the HSPC population. Mice in the 3aKO-140 group lost the c-kit+Sca1+Lin– (KSL) stem cell pool, whereas the Lin–c-kit+Sca1– (LK) progenitors were maintained and showed evidence of expansion (Figure 1K). To determine the malignancy-initiating cell activity in the retained LK population, we transplanted the LK myeloid progenitors together with differentiated cells into secondary, sublethally irradiated recipients. As shown in supplemental Figure 3A-C, only the secondary recipients receiving LK cells developed chronic myelomonocytic leukemia or AML, showing that this population has greater leukemia-initiating capacity. Interestingly, a most of the LK cells in moribund secondary recipients did not express CD16/32 or CD34, suggesting that the phenotypic MEP-like HSPCs in the Dnmt3a−/−;Idh2R140Q secondary recipients contain more malignancy-initiating cells (supplemental Figure 3D). We confirmed that 3aKO-140 MEP-like HSPCs initiate disease and are able to engraft bone marrow in the same way as the KSL cells, demonstrating that MEP-like HSPCs are indeed leukemia-initiating cells (supplemental Figure 3E-F).
DNMT3A loss and IDH2 neomorphic mutation have synergistic effects on the transcriptome
To study the mechanisms by which Dnmt3a loss of function and the overexpression of the Idh2 mutant promote malignant transformation, we focused on the secondary recipients who had chronic myelomonocytic leukemia and could progress to AML. Because the blasts in mice after secondary transplantation were enriched for MEP-like HSPCs, we first performed RNA-seq analysis to compare the transcriptome of MEP-like HSPCs from 3aKO-140 mice and MEPs from WT-140, 3a-WT, and WT-WT mice. 3aKO-140 HSPCs were distinct in their transcriptome profile, yet shared a degree of similarity with their DNMT3a KO progenitors; downregulated genes in particular overlapped between 3aKO-140 and 3a-WT HSPCs (Figure 1L-M). Gene set enrichment analysis showed the activation of long-term stem cell and megakaryocyte progenitor gene signatures and the repression of late progenitor genes in the MEP-like progenitors (Figure 1N), demonstrating that 3aKO-140 HSPCs were arrested in an early differentiation cascade.
Epigenetic changes in the double mutants contribute to altered gene expression
We performed RRBS analysis on the MEP and granulocytic macrophage progenitor (GMP) cells taken from the WT, WT-140, 3aKO, and 3aKO-140 mice. We first analyzed our RRBS data and found it consistent with the 2-HG levels in WT-140 and 3aKO-140 cells, which bear significant hypermethylation relative to WT or 3aKO cells. 3aKO and 3aKO-140 cells bear hypomethylation sites (Figure 2A-B). Thus, we classified the differentially methylated regions (DMRs) as 3aKO-140 hypermethylation, 3aKO hypomethylation, and WT-140 hypermethylation. Interestingly, the 3aKO-140 hypermethylated DMRs were unique in comparison with cells of other genotypes (Figure 2B). 3aKO-140 hypermethylation DMRs were significantly enriched in development-associated genes, and these regions were also enriched in the DNA methylation canyon region (Figure 2C-D). Kyoto Encyclopedia of Genes and Genomes (KEGG) pathway analysis showed the 3aKO-140 DMRs were enriched for cancer-associated pathways (Figure 2E). 3aKO hypomethylation and WT-140 hypermethylation did not show very strong enrichment for certain Gene Ontology terms or for the KEGG pathway, possibly because of the small number of DMRs.
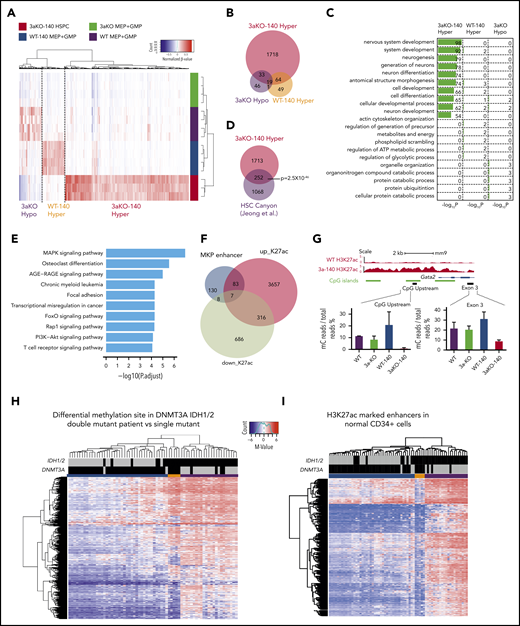
Epigenomic profiling of diseased 3aKO-140 HSPCs. (A) Differentially methylated regions in 4 genotypes from enhanced RRBS data. The 3 types of DMRs are 3aKO-140 Hyper, WT-140 Hyper, and 3aKO Hypo regions. (B) The overlap between the 3 DMRs in panel A. (C) Gene Ontology term analysis of genes associated with the 3 DMRs. (D) The overlap between the 3aKO-140 Hyper region and the HSC DNA methylation canyon. The P value was calculated by genomic distribution test. (E) KEGG pathway analysis of genes associated with enhanced H3K27ac signal in 3aKO-140 HSPC relative to WT. (F) The overlap of altered enhancer regions in 3aKO-140 HSPCs vs WT MEPs with annotated megakaryocyte (MkP) enhancer.50 (G) The detail of the Gata2 enhancer region, where DNA methylation is low in 3aKO-140 HSPCs. (H-I) Heatmaps showing (H) the whole-genome differentially methylated cytosines (DMCs) and (I) DMCs overlapping with normal CD34+ enhancers in AML patients bearing only the DNMT3A mutation, only the IDH1/2 mutation, or both the DNMT3A and IDH1/2 mutations. Patient 450K DNA methylation array data are from The Cancer Genome Atlas. Enhancer regions are defined as H3K27ac-enriched regions from the Encyclopedia of DNA Elements data on human CD34+ bone marrow cells. In the 2 highest bars above the map, black indicates the patient carries a mutation in the labeled gene and gray indicates the patient does not carry a mutation. In the colored bar immediately above the heatmap, blue marks the cluster of patients enriched in DNMT3A mutations; orange marks the patients having both DNMT3A and IDH1/2 mutations; and purple marks the patients enriched in IDH1/2 mutations.
Epigenomic profiling of diseased 3aKO-140 HSPCs. (A) Differentially methylated regions in 4 genotypes from enhanced RRBS data. The 3 types of DMRs are 3aKO-140 Hyper, WT-140 Hyper, and 3aKO Hypo regions. (B) The overlap between the 3 DMRs in panel A. (C) Gene Ontology term analysis of genes associated with the 3 DMRs. (D) The overlap between the 3aKO-140 Hyper region and the HSC DNA methylation canyon. The P value was calculated by genomic distribution test. (E) KEGG pathway analysis of genes associated with enhanced H3K27ac signal in 3aKO-140 HSPC relative to WT. (F) The overlap of altered enhancer regions in 3aKO-140 HSPCs vs WT MEPs with annotated megakaryocyte (MkP) enhancer.50 (G) The detail of the Gata2 enhancer region, where DNA methylation is low in 3aKO-140 HSPCs. (H-I) Heatmaps showing (H) the whole-genome differentially methylated cytosines (DMCs) and (I) DMCs overlapping with normal CD34+ enhancers in AML patients bearing only the DNMT3A mutation, only the IDH1/2 mutation, or both the DNMT3A and IDH1/2 mutations. Patient 450K DNA methylation array data are from The Cancer Genome Atlas. Enhancer regions are defined as H3K27ac-enriched regions from the Encyclopedia of DNA Elements data on human CD34+ bone marrow cells. In the 2 highest bars above the map, black indicates the patient carries a mutation in the labeled gene and gray indicates the patient does not carry a mutation. In the colored bar immediately above the heatmap, blue marks the cluster of patients enriched in DNMT3A mutations; orange marks the patients having both DNMT3A and IDH1/2 mutations; and purple marks the patients enriched in IDH1/2 mutations.
Because the transcriptome of 3aKO-140 HSPCs is distinct from progenitors of other genotypes, we performed ChIP-seq with H3K4me3 and H3K27ac in the WT and 3aKO-140 MEP cells. Consistent with the gene expression profile, we found that most of the megakaryocyte lineage enhancers gained activity in 3aKO-140 cells (Figure 2F). For example, a 2-kb region upstream of Gata2 and a putative enhancer in the third exon were notable for their loss of methylation, consistent with the increased expression of Gata2 in 3aKO-140 MEP-like HSPCs (Figure 2G). Indeed, hypomethylation of the GATA2 upstream region is a recognized characteristic of human AML patients carrying the DNMT3AR882H mutation.29
When we examined a cohort of AML patients from The Cancer Genome Atlas database, we found that patients with mutations of both DNMT3A and IDH1/2 showed an intermediate methylation change between DNMT3A-only and IDH1/2-only patients, as described before30 (Figure 2H). Yet the patients with both mutations had significant hypomethylation in normal HSPC enhancer regions,31 resembling DNMT3A-only mutant patients (Figure 2I). Thus, the Dnmt3a mutation-mediated loss of methylation in hematopoiesis-associated enhancers could partially contribute to the activation of the stem cell gene and to the MkP signature of 3aKO-140 HSPCs.
HDAC inhibition reversed acetylation/methylation imbalance on H3K9 and reduced the leukemia burden in Dnmt3a−/−;Idh2R140Q leukemia
When we tested the alteration of histone modifications in Dnmt3a−/−;Idh2R140Q leukemia cells, we found, as previously reported, that the methylation of histone H3 lysine residues was significantly increased (Figure 3A). We also observed a decrease in histone H3 lysine acetylation (Figure 3A), suggesting that both histone methylation and acetylation were affected. Because 2-HG inhibits only the demethylation of histone lysine residues, we hypothesize that the decrease of histone acetylation is related to the competition between histone methyltransferase activity and histone acetylase activity. Thus, if we use a histone deacetylase inhibitor, we expect the increase of histone acetylation will counteract the overmethylation of histone and rescue the differentiation block.
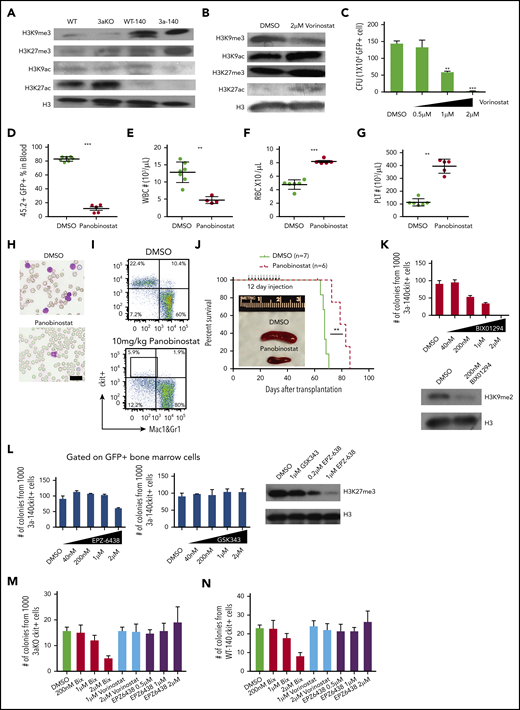
HDAC inhibitor and H3K9 methyltransferase inhibition reversed the epigenetic abnormality and inhibited maintenance of Dnmt3a−/−;Idh2R140Qleukemia. (A) Western blot of histone modification in c-kit+ bone marrow progenitor cells of mice from all genotypes. (B) Global histone modification shows a decrease of H3K9me3 and an increase of H3K9/27ac after HDAC inhibitor treatment in bone marrow cells from 3aKO-140 mice in vitro. (C) HDAC inhibitor treatment (vorinostat) reduced the proliferation of double-mutant cells in a colony-forming assay at day 7. Mean ± standard deviation (SD); the results of 3 independent cultures are presented. *P < .05; **P < .01, by Student t test. (D-G) HDAC inhibitor treatment reduced leukocytosis (D-E) and reversed anemia (F) and thrombocytopenia (G) in the recipients of Dnmt3a−/−;Idh2R140Q leukemic cells. Values are means ± SD (n = 7 and 6 in the vehicle- and inhibitor-treated groups, respectively). **P < .01, ***P < .001, by Student t test analysis. (H) Representative blood smears for vehicle- and panobinostat-treated double-mutant recipient mice. (I) The flow plot of mouse bone marrow treated with panobinostat and DMSO. The mouse bone marrow progenitor (c-kit+, Mac1&Gr1−) is gated. (J) Kaplan-Meier survival curves for mice treated with DMSO and panobinostat (10 mg/kg). **P < .01, by long-rank test. Inset: a reduction of splenomegaly after treatment with panobinostat (10 mg/kg) at 4 weeks after bone marrow transplantation. (K) Response of 3aKO-140 HSPCs to the Ehmt2 inhibitor BIX01294 in in vitro colony-forming assay of 1000 c-kit+ cells (left). Immunoblot for H3K9me2 of HSPCs with DMSO or BIX01294 treatment (right). (L) Response of 3aKO-140 HSPCs to the Ezh2 inhibitors EPZ-6438 and GSK343 in in vitro colony-forming assay of 1000 c-kit+ cells (left and middle). Immunoblot for H3K27me3 of HSPCs with EPZ-6438 or GSK343 treatment (right). (M) The colony forming units of Dnmt3aKO c-kit+ bone marrow cells under G9a inhibitor Bix01294, HDAC inhibitor vorinostat and EZH2 inhibitor. Mean ± SD (n = 3 per group). (N), The CFU of Idh2R140Q c-kit+ bone marrow cells under G9a inhibitor Bix01294, HDAC inhibitor vorinostat and EZH2 inhibitor. Mean ± SD (n = 3 per group).
HDAC inhibitor and H3K9 methyltransferase inhibition reversed the epigenetic abnormality and inhibited maintenance of Dnmt3a−/−;Idh2R140Qleukemia. (A) Western blot of histone modification in c-kit+ bone marrow progenitor cells of mice from all genotypes. (B) Global histone modification shows a decrease of H3K9me3 and an increase of H3K9/27ac after HDAC inhibitor treatment in bone marrow cells from 3aKO-140 mice in vitro. (C) HDAC inhibitor treatment (vorinostat) reduced the proliferation of double-mutant cells in a colony-forming assay at day 7. Mean ± standard deviation (SD); the results of 3 independent cultures are presented. *P < .05; **P < .01, by Student t test. (D-G) HDAC inhibitor treatment reduced leukocytosis (D-E) and reversed anemia (F) and thrombocytopenia (G) in the recipients of Dnmt3a−/−;Idh2R140Q leukemic cells. Values are means ± SD (n = 7 and 6 in the vehicle- and inhibitor-treated groups, respectively). **P < .01, ***P < .001, by Student t test analysis. (H) Representative blood smears for vehicle- and panobinostat-treated double-mutant recipient mice. (I) The flow plot of mouse bone marrow treated with panobinostat and DMSO. The mouse bone marrow progenitor (c-kit+, Mac1&Gr1−) is gated. (J) Kaplan-Meier survival curves for mice treated with DMSO and panobinostat (10 mg/kg). **P < .01, by long-rank test. Inset: a reduction of splenomegaly after treatment with panobinostat (10 mg/kg) at 4 weeks after bone marrow transplantation. (K) Response of 3aKO-140 HSPCs to the Ehmt2 inhibitor BIX01294 in in vitro colony-forming assay of 1000 c-kit+ cells (left). Immunoblot for H3K9me2 of HSPCs with DMSO or BIX01294 treatment (right). (L) Response of 3aKO-140 HSPCs to the Ezh2 inhibitors EPZ-6438 and GSK343 in in vitro colony-forming assay of 1000 c-kit+ cells (left and middle). Immunoblot for H3K27me3 of HSPCs with EPZ-6438 or GSK343 treatment (right). (M) The colony forming units of Dnmt3aKO c-kit+ bone marrow cells under G9a inhibitor Bix01294, HDAC inhibitor vorinostat and EZH2 inhibitor. Mean ± SD (n = 3 per group). (N), The CFU of Idh2R140Q c-kit+ bone marrow cells under G9a inhibitor Bix01294, HDAC inhibitor vorinostat and EZH2 inhibitor. Mean ± SD (n = 3 per group).
We therefore applied an HDAC inhibitor to 3aKO-140 HSPCs to test whether reversing the histone methylation/acetylation imbalance would reactivate specific repressed genes. We found treatment with a pan-HDAC inhibitor led to a reduction of H3K9me3 but not H3K27me3 and an increase in the activating marks H3K9ac and H3K27ac (Figure 3B), as well as a dose-dependent reduction of HSPC self-renewal and proliferation in vitro (Figure 3C). We also found that only class I inhibitors could reduce self-renewal in vitro (supplemental Figure 4A), suggesting the effect of the pan-HDAC inhibitor was mostly related to the inhibition of nuclear HDACs (HDAC 1-3), which mainly deacetylate histones and other nuclear proteins. Importantly, pan-HDAC inhibitor treatment significantly reduced the leukemia burden (Figure 3D-E,H) and ameliorate the leukemia-associated cytopenia (Figure 3F-H) in mice that received transplanted AML cells derived from 3aKO-140 secondary recipients. The HDAC treatment also significantly reduced the malignant HSPC in 3aKO-140 mice (Figure 3H-I; supplemental Figure 4B-C) and prolonged their survival (Figure 3J). Considering the strong dysplasia features of the 3aKO-140 model, this reversal is consistent with the finding that MDS patients with IDH2 mutation achieve a clinical response in the current clinical trials with panobinostat.32
This is also consistent with the observation that HDAC inhibition reverses the H3K9 methylation/acetylation imbalance but not that for H3K27 methylation/acetylation. Thus, we hypothesized that Dnmt3aKO-IDH2 mutant cells are dependent on H3K9 methylation rather than H3K27 methylation. Thus, we tested the inhibitory effect of inhibitors of the mono/di-H3K9-specific methyltransferase Ehmt2 (G9a)33 and of H3K27 methyltransferase Ezh234,35 on the colony-forming ability of 3aKO-140 HSPCs in vitro. We found that 3aKO-140 HSPCs were sensitive to the Ehmt2 inhibitor BIX01294 (Figure 3K), but not to the inhibitors of Ezh2 (Figure 3L).
To verify whether the inhibitory effects of these compounds are specific to 3aKO-140 bone marrow cells, we treated 3aKO-WT and WT-140 bone marrow cells with the methyltransferase and HDAC inhibitors. We found that these cells were not as sensitive as 3aKO-140 bone marrow cells after BIX10294 treatment. Vorinostat and EPZ6438 did not reduce the colony number of 3aKO-IDH2WT and WT-IDH2R140Q bone marrow cells either. These results indicate that the response to these compound treatments is specific to the 3aKO-140 bone marrow cells (Figure 3M-N).
Dnmt3a−/−;Idh2R140Q HSPCs overproduce PGE2 and are sensitive to prostaglandin synthesis and signaling inhibition
Since the oncometabolite 2-HG is overproduced in Dnmt3a−/−;Idh2R140Q cells, we explored the extent to which concurrent DNMT3A loss and IDH2R140Q mutation induces metabolic changes that maintain abnormal self-renewal. We performed metabolomic profiling to identify metabolic pathways that may contribute to the altered synthesis of 2-HG in 3aKO-140 HSPCs. Our analysis with c-kit+ bone marrow cells identified 43 metabolites that were differentially present in malignant Dnmt3a−/−;Idh2R140Q cells relative to cells of other genotypes (Figure 4A). Among the 43 metabolites, we found the precursor of prostaglandin synthesis, arachidonic acid, was especially abundant in 3aKO-140 cells (Figure 4B). We also found upregulated expression of the Δ-6 desaturase FADS2, the rate-limiting enzyme of arachidonic acid synthesis, showing that the arachidonic acid synthesis pathway was activated (supplemental Figure 5A-B).36 This upregulation of FADS2 was also associated with the loss of enhancer DNA methylation, caused by DNMT3A loss, as indicated by the decrease of DNA methylation in 3aKO MEPs (supplemental Figure 5C). PGE2 was only overproduced by 3aKO-140 cells (Figure 4C). ChIP-seq and RNA-seq profiling showed that genes associated with the prostaglandin synthesis pathway were activated in 3aKO-140 HSPCs relative to the WT (Figure 4D), further demonstrating that 3aKO-140 HSPCs activate a megakaryocyte progenitor (MegP) gene expression program (Figure 2B) that alters metabolism.37 PGE2 has been implicated in promoting stem cell self-renewal and cancer stem cell maintenance.38-41 We found that only Ptger3 was overexpressed in 3aKO-140 HSPCs, suggesting a different pathway than the canonical prostaglandin pathway, which is active through PTGER2/4 (supplemental Figure 5D-G). We thus treated 3aKO-140 c-kit+ bone marrow cells with a PGE2 synthesis inhibitor (celecoxib) and PGE2 receptor-specific antagonists (PTGER1, PTGER2, PTGER3, and PTGER4) in vitro (Figure 4F). We found that celecoxib and the PTGER3-specific inhibitor L-798 106 inhibited the growth and promoted the differentiation of 3aKO-140 cells (Figure 4G-H). Similar inhibitory effects were not observed after treatment with PTGER1-, PTGER2-, or PTGER4-specific antagonists (supplemental Figure 5H). Further, the administration of celecoxib in vivo inhibited leukemic engraftment and promoted the differentiation of leukemic cells (supplemental Figure 5I).
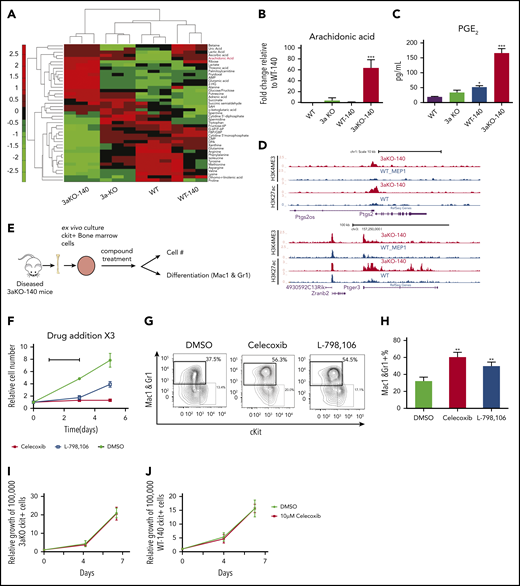
Dnmt3a−/−;Idh2R140QHSPCs overproduced PGE2 and were sensitive to prostaglandin synthesis and signaling inhibition. (A) Metabolomics profiling of 4 genotypes in 5 million donor-derived c-kit+ bone marrow cells. Relative abundance of metabolites is shown in the heat map. (B) Relative arachidonic acid level in c-kit+ bone marrow cells from 3aKO-140, 3aKO and WT relative to WT-140 from panel A. Mean ± standard deviation (SD; n = 3 per group); ***P < .001, compared with WT-140, by Student t test. (C) Amount of prostaglandin E2 secreted into the culture medium by c-kit+ cells from the 4 genotypes. *P < .05; ***P < .01, compared with WT, by 1-way ANOVA and post hoc Bonferroni test. (D) Active chromatin state of 3aKO-140 and WT MEP at the Ptgs2 and Ptger3 loci. (E) Experimental scheme of prostaglandin compound test. (F-H) Growth inhibition (F) and differentiation induction (G-H) in 3aKO-140 cells treated with 10 μM celecoxib and 10 μM L-798 106. Mean ± SD is shown (n = 3 per group). **P < .01, by Student t test. Three biological replicates were performed for each group. Representative flow plot is shown. (I) The growth curve of Dnmt3aKO c-kit+ bone marrow cells under DMSO and 10 μM celecoxib treatment. Mean ± SD (n = 3 per group). (J) The growth curve of WT-IDH2R140Q c-kit+ bone marrow cells under DMSO and 10 μM celecoxib treatment. Mean ± SD (n = 3 per group).
Dnmt3a−/−;Idh2R140QHSPCs overproduced PGE2 and were sensitive to prostaglandin synthesis and signaling inhibition. (A) Metabolomics profiling of 4 genotypes in 5 million donor-derived c-kit+ bone marrow cells. Relative abundance of metabolites is shown in the heat map. (B) Relative arachidonic acid level in c-kit+ bone marrow cells from 3aKO-140, 3aKO and WT relative to WT-140 from panel A. Mean ± standard deviation (SD; n = 3 per group); ***P < .001, compared with WT-140, by Student t test. (C) Amount of prostaglandin E2 secreted into the culture medium by c-kit+ cells from the 4 genotypes. *P < .05; ***P < .01, compared with WT, by 1-way ANOVA and post hoc Bonferroni test. (D) Active chromatin state of 3aKO-140 and WT MEP at the Ptgs2 and Ptger3 loci. (E) Experimental scheme of prostaglandin compound test. (F-H) Growth inhibition (F) and differentiation induction (G-H) in 3aKO-140 cells treated with 10 μM celecoxib and 10 μM L-798 106. Mean ± SD is shown (n = 3 per group). **P < .01, by Student t test. Three biological replicates were performed for each group. Representative flow plot is shown. (I) The growth curve of Dnmt3aKO c-kit+ bone marrow cells under DMSO and 10 μM celecoxib treatment. Mean ± SD (n = 3 per group). (J) The growth curve of WT-IDH2R140Q c-kit+ bone marrow cells under DMSO and 10 μM celecoxib treatment. Mean ± SD (n = 3 per group).
To verify whether the inhibitory effects of these compounds are specific to 3aKO-140 bone marrow cells, we treated 3aKO-WT and WT-140 bone marrow cells with celecoxib in the ex vivo bone marrow expansion assay. We found that celecoxib did not reduce the growth of 3aKO-IDH2WT or WT-IDH2R140Q bone marrow cells either. These results indicate that the response to these compound treatments is specific to the 3aKO-140 bone marrow cells (Figure 4I-J).
Discussion
Overall, we found that Dnmt3a loss of function and the overexpression of an Idh2 neomorphic mutant cooperate to accelerate the onset and increase the severity of myeloid malignancies. The 3aKO-140 combination aberrantly activated a stem cell transcription signature related to the loss of methylation at hematopoietic enhancers (contributed by Dnmt3a loss) and misregulation of histone methylation (contributed by the Idh2 mutation). These epigenetic changes activated a stem cell program and inhibited differentiation, demonstrating the mechanisms of how these 2 mutations cooperate to induce MDS and AML.
Thus, we conclude that there is a synergistic effect of DNMT3A loss and IDH2 neomorphic mutation through which epigenomic and metabolomic alterations lead to leukemogenesis. DNMT3A loss produced the hypomethylation of enhancer regions and the expression of stem cell and MegP genes. The activation of the MegP program promoted overproduction of prostaglandin, rendering the cells sensitive to a prostaglandin synthesis inhibitor. The IDH2 neomorphic mutation resulted in overproduction of 2-HG and promoted the accumulation of repressive histone marks and loss of histone acetylation. The histone methylation/acetylation imbalance resulted in the repression of progenitor genes, which can be reactivated with HDAC or H3K9 methyltransferase inhibitors. In our model, each alteration contributes to different pathways to maintain the malignant state. This suggests the loss of DNMT3A promotes abnormal self-renewal, whereas the IDH2 neomorphic mutation blocks differentiation in parallel.
This work is another strong example of synergistic biological mutations of epigenetic modifiers that co-occur in MDS, AML, and T-cell lymphoma, but DNMT3A and IDH1/2 are not the only pair of epigenetic modifiers co-mutated in myeloid malignancies. Mutations in both ASXL1 and SRSF2 are frequently associated with IDH1/2 in MDS patients,12 suggesting that the establishment of preleukemic MDS may require the cooperation of a sufficient number of mutations.
We previously found that mutations in Dnmt3a and Tet2 are synergistic.10 The double mutant HSC transcriptional profile shows the enhancement of fold change of differentially expressed genes in comparison with WT, similar to the profile of the Tet2 KO. Unlike that synergy, DNMT3A and IDH2 mutations contribute to the development of leukemia more in an additive way. The 3aKO-140 transcriptome profile is more similar to that of 3aKO, whereas the mutant IDH causes a huge alteration in the epigenomic landscape, including DNA hypermethylation and a histone methylation/acetylation imbalance. The IDH mutation also produces significant changes in chromatin modifications, which result in sensitivity to HDAC inhibitor treatment. Other comprehensive study revealed that co-occurring DNMT3A and IDH1 mutation could induce epigenomic antagonism in terms of DNA methylation in both human leukemia and a mouse model.30 Our analysis also showed that in DNA methylation, the effect of these 2 mutations was antagonistic in genomic level (Figure 2), but Dnmt3a is epistatic to Idh2 in the level of enhancer DNA methylation. Nevertheless, with additional alterations in chromatin and the metabolome other than DNA methylation, DNMT3A and IDH2 mutations induce leukemia in synergy. That study focused on the preleukemic state of Dnmt3a/Idh1 double-mutant mice30 ; our study focused more on full-blown leukemia, providing a complementary view.
In terms of therapeutic implications, our mouse model provides a unique opportunity to target double-mutant malignancies using prostaglandin synthesis inhibitors together with inhibitors of mutant IDH1/2 or other chemotherapy drugs for hematopoietic malignancies with both DNMT3A and IDH1/2 mutations. Recent studies have indicated that the metabolome altered by mutant IDH1/2 can be targeted for cancer therapy.42,43 Thus, targeting altered metabolome can be another strategy for of IDH1/2-mutant leukemia as an alternative to the inhibition of mutant IDH; this has also been suggested by another pioneering unpublished study.44
Considering the newly discovered IDH2-inhibitor–resistant secondary IDH2 mutation,45,46 the search for new therapeutic targets under mutant IDH2 background is important. Our findings offer a new lens through which to view the epigenetic impact of 2-hydroxyglutarate overproduction, which disrupts the histone methylation/acetylation balance. Our data also suggest that certain types of solid tumors having WT IDH1/2 but that overproduce D/L-2-HG may be targeted using HDAC inhibitors.47-49 Our data suggest an alternative use for HDAC inhibitors or H3K9 methyltransferase inhibitors; that is, to directly reverse H3K9 methylation caused by D-2-HG or L-2-HG in the absence of IDH1/2 mutations. In addition, we acknowledge that a homozygous deletion of DNMT3A in human disease is exceedingly rare, and our current model therefore by definition is not completely consistent with the situation in human disease. Again, as our data are based on our mouse model, research performed on human samples for the inhibitor treatments would be more conclusive.
In summary, our findings show that the co-occurrence of epigenetic mutations in HSPCs creates a unique epigenetic signature that is sensitive to targeted therapies such as HDAC inhibitor treatment. The synergy of mutations in epigenetic modifiers reveals a leukemogenesis pathway distinct from the traditional proproliferation/blocked differentiation model, and it also offers potential new therapeutic targets for diseases characterized by the overproduction of L/D-2-HG.
The data reported in this article have been deposited in the Gene Expression Omnibus database (accession number GSE60055).
Data associated with this study may be obtain by e-mail to one of the corresponding authors.
The online version of this article contains a data supplement.
The publication costs of this article were defrayed in part by page charge payment. Therefore, and solely to indicate this fact, this article is hereby marked “advertisement” in accordance with 18 USC section 1734.
Acknowledgments
The authors thank John Gilbert and Catherine Gillespie for editing the article, and George Michailidis and Crisitian Coarfa for early bioinformatic analysis of the metabolome.
This work was supported by the Wellcome Trust Foundation (X.Z.), Cancer Prevention and Research Institute of Texas grant RP110028 (M.A.G.) and RR140053 (Y.H.); grants from the National Institutes of Health (NIH), National Institute of Diabetes and Digestive and Kidney Diseases (DK092883 and DK060445), the NIH National Cancer Institute (NCI) (CA183252, CA125123, and CA126752), and the NIH National Human Genome Research Institute (HG007538); The Adrienne Helis Malvin Medical Research Foundation; and the Edward P. Evans Foundation. This project was supported by the Cancer Prevention & Research Institute of Texas (CPRIT) Proteomics and Metabolomics Core Facility (RP170005) (N.P.), NIH/NCI (P30 CA125123), and the Dan L. Duncan Cancer Center. X.Z. is supported by an American Society of Hematology fellowship and a Van Andel Research Institute (VARI) fellowship and is an Edward P. Evans Foundation Young Investigator.
Authorship
Contribution: X.Z. proposed and supervised the project, performed most of the experiments, and drafted the manuscript; X.W. and Y.Q. performed bioinformatic analysis; J.S. and W.L. supervised the bioinformatic analysis. T.Z. performed pathological analysis. P.N., A.S., M.J., A.G., C.R., and Y.H. contributed to the experiments; X.Q.D.W. wrote and revised the manuscript, and performed the experiments; M.A.G. coordinated the project, obtained funding, discussed the data, and edited the manuscript; and all authors participated in discussing data and revising the manuscript.
Conflict-of-interest disclosure: the authors declare no competing financial interests.
Correspondence: Xiaotian Zhang, Center for Epigenetics, Van Andel Research Institute, 333 Bostwick Ave NE, Room 5018, Grand Rapids, MI 49503; e-mail: xiaotian.zhang@vai.org; and Jianzhong Su, Institute of Biomedical Big Data, Wenzhou Medical University, Wenzhou, Zhejiang, China 325027: e-mail: sujz@wmu.edu.cn.
