

Key Points
N-glycosylation sites are acquired early in disease and persist during tumor progression, despite therapy.
Scarcity of N-glycosylation sites-negative subclones and their loss during progression suggest positive clones expand preferentially.

Abstract
Follicular lymphoma B cells undergo continuous somatic hypermutation (SHM) of their immunoglobulin variable region genes, generating a heterogeneous tumor population. SHM introduces DNA sequences encoding N-glycosylation sites asparagine-X-serine/threonine (N-gly sites) within the V-region that are rarely found in normal B-cell counterparts. Unique attached oligomannoses activate B-cell receptor signaling pathways after engagement with calcium-dependent lectins expressed by tissue macrophages. This novel interaction appears critical for tumor growth and survival. To elucidate the significance of N-gly site presence and loss during ongoing SHM, we tracked site behavior during tumor evolution and progression in a diverse group of patients through next-generation sequencing. A hierarchy of subclones was visualized through lineage trees based on SHM semblance between subclones and their discordance from the germline sequence. We observed conservation of N-gly sites in more than 96% of subclone populations within and across diagnostic, progression, and transformation events. Rare N-gly-negative subclones were lost or negligible from successive events, in contrast to N-gly-positive subclones, which could additionally migrate between anatomical sites. Ongoing SHM of the N-gly sites resulted in subclones with different amino acid compositions across disease events, yet the vast majority of resulting DNA sequences still encoded for an N-gly site. The selection and expansion of only N-gly-positive subclones is evidence of the tumor cells’ dependence on sites, despite the changing genomic complexity as the disease progresses. N-gly sites were gained in the earliest identified lymphoma cells, indicating they are an early and stable event of pathogenesis. Targeting the inferred mannose-lectin interaction holds therapeutic promise.
Introduction
Follicular lymphoma (FL) is a biologically and clinically heterogeneous disease that remains incurable. Although the majority of patients follow an indolent course, high-risk groups are prone to early progression or transformation to aggressive lymphoma associated with a dismal prognosis. For these patients, current therapies are suboptimal, and uncovering changes occurring early during disease development is essential to improving prognosis.
Despite the loss of 1 immunoglobulin allele through the t14;18 translocation1 and ongoing somatic hypermutation (SHM) of the immunoglobulin heavy-chain variable region gene (IGHV) that can introduce crippling IGV mutations, all detectable tumor subclones retain functional expression of the surface immunoglobulin throughout disease, resulting in thousands of tumor subclones displaying distinct but clonally related IGHV sequences. This retention suggests a tumor dependence on signaling through the B-cell receptor. Through SHM, replacement mutations introduce amino acid sequence motifs consisting of asparagine (N)-X-serine/threonine, where X can be any amino acid except proline.2-4 These sequences are known as N-glycosylation (N-gly) sites and are found in more than 90% of FL cases.5,6 N-gly sites are rarely found in normal B cells,7 indicative of a pathogenic function. Unusual glycans terminating with high mannose attach to sites and activate B-cell receptor signaling pathways after engagement with lectins.8-12 This novel interaction represents a critical mechanism by which tumor cells survive in the germinal center, accumulating mutations of epigenetic modifiers early during FL pathogenesis.13,14
The behavior of N-gly sites during disease evolution and progression has been investigated by IGHV cloning technique in a number of FL cases5 and in 1 case of contiguous FL and in situ follicular neoplasia (ISFN).15 These studies have indicated conservation of acquired N-gly sites within identified clones. However, clone numbers were limited in these studies, underrepresenting the extent of intraclonal diversity. Furthermore, as analysis has been restricted to a single disease event, behavior of N-gly sites over time has not been addressed and would be critical in determining their role in disease initiation and progression. To address this requires comprehensive IGV analysis of the clonal repertoire taken from subsequent (temporal) biopsies, ranging from a relatively early point in disease manifestation (eg, diagnosis) to a point at which the disease has become genetically and clinically distinct (eg, relapse and transformation). As SHM continues during disease progression and transformation, the stepwise process can be visualized through lineage trees rooted to a putative nonmalignant germline IGV sequence, making them an important tool in B-cell evolutionary studies.
Our goal was to investigate the behavior of N-gly sites during the disease course. We analyzed the incidence and maintenance of sites within the tumor clones of 6 patients taken at different points of disease. This included analysis of events from different anatomical sites. This is the first study that has analyzed the relationship between FL progression and N-gly sites in patients who have undergone different lines of therapy and presented with different clinical courses, reflecting the heterogeneous nature of the disease.
We found that N-gly sites are acquired within early FL clones and are retained in the intraclonal population, despite ongoing SHM. A striking observation is that sites are a universal determinant of both cell expansion and cell fate, as evidenced by the low frequency of N-gly site-negative subclones in and across diagnostic, progression, and transformation events and their disappearance in subsequent events.
Methods
Methods
Three individuals with FL were selected on the availability of genomic DNA derived from sequential tumor lymph node biopsies that had previously undergone somatic variant profiling to reveal a "sparse" or "rich" disease evolution pattern based on degree of genetic semblance.13 Patients 1 and 3 were categorized as sparse, and patient 2 was categorized as rich. Samples were selected on the basis of detection of a clonal IGHV (IGHVDJ) rearrangement through Sanger sequencing (supplemental Methods, available on the Blood Web site). In total, 8 samples were selected, all carrying an IgH-VH3 rearranged major tumor clone (major clone). All samples were obtained after written informed consent in accordance with the Declaration of Helsinki and the London Research Ethics Committee. Approximately 50 ng IGHV genomic DNA amplicons prepared using JH consensus and VH3-FR1 primers were sent for 2 × 250 bp paired-end sequencing, using the Miseq Illumina platform (Genewiz, NJ). As primers bind within the FR1 and JH regions, a portion of these regions were absent from the sequencing data. The sequential steps involved in the analysis of Illumina reads and identification of tumor-related subclones are detailed in the supplemental Methods. Additional tumor-related reads covering the IGHV gene for 2 patients over different disease events were available from our collaborator (patients 4 and 5) and were produced using Roche 454 Life Sciences Genome Sequencer FLX.16 Additional raw IGHV data files produced from the MiSeq platform were obtained from the NCBI database (BioProject PRJNA240336) for patient 6.17 Clones were analyzed for acquired N-gly sites, using the NetN-glyc 1.0 server. Lineage trees based on the SHM profiles of clones were generated using IgTree,18 detailed in the supplemental Methods.
Statistical analyses
Two-way ANOVA was performed using GraphPad Prism (GraphPad Software, La Jolla, CA).
Results
High-throughput sequencing analysis of tumor-related subclones
Sequencing metrics for patients 1 to 3 are found in supplemental Table 1. We generated 0.81 to 1.17 million paired-end reads/sample (average, 1.09 million; supplemental Table 2). In total, we identified 0.12 to 0.46 million (average, 0.29 million) VDJ junctions per sample. The major clone was identified as being the dominant VDJ rearrangement in the sample (Table 1), and tumor-related reads were identified as described in the supplemental Methods. The number of unique subclones that reads encoded for is detailed in Table 1. To ensure detection of all tumor subclones in the different samples, we used VH3 family oligonucleotides in the single sequencing run, rather than tumor-specific primers. Therefore, contaminating sequences from normal B cells were observed for each sample, and the number of unique VDJ rearrangements/sample is stated in Table 1. Sequencing data from patients 4 to 6 in Table 1 were extracted from the original articles.16,17 The relatively greater number of unique VDJ rearrangements detected for patient 6 is a result of the sequencing approach amplifying all VH families.17 There is a heterogeneous level of contaminating B cells, as indicated by the percentage of merged reads expressing the dominant tumor rearrangement, ranging from 53.3% to 99.03% (Table 1; supplemental Table 2).
Summary of VDJ sequencing results for patients 1 to 6
| Patient | Disease event | Dominant VDJ rearrangement | No. of unique VDJ rearrangements | Dominant rearrangement (% of total reads) | No. of unique subclones with dominant VDJ rearrangement |
|---|---|---|---|---|---|
| 1 | Diagnosis | V3-30, D3-16, J6 | 29 | 99.03 | 1690 |
| Transformation | V3-30, D3-16, J6 | 313 | 94.95 | 2727 | |
| 2 | First relapse | V3-11, D3-16, J1 | 105 | 95.04 | 3530 |
| Third relapse | V3-11, D3-16, J1 | 12 | 99.33 | 3032 | |
| Transformation | V3-11, D3-16, J1 | 129 | 99.23 | 3966 | |
| 3 | Second relapse | V3-48, D1-26, J4 | 164 | 88.23 | 4103 |
| Third relapse | V3-48, D1-26, J4 | 261 | 71.10 | 2057 | |
| Transformation | V3-48, D1-26, J4 | 143 | 84.81 | 1592 | |
| 4 | First relapse | V3-48, D3-10, J6 | 101 | 56.60 | 81 |
| Second relapse | V3-48, D3-10, J6 | 324 | 69.70 | 248 | |
| 5 | First relapse | V3-23, D4-23, J6 | 224 | 53.30 | 140 |
| Third relapse | V3-23, D3-3*, J5* | 433 | 70.70 | 371 | |
| 6 | FL diagnosis | V3-23, D5-18, J6 | 7,931 | 82.40 | 2510 |
| tFL diagnosis | V3-23, D5-18, J6 | 2,436 | 89.60 | 3442 | |
| tFL relapse | V3-23, D5-18, J6 | 1,204 | 93.10 | 4749 |
Although samples of patient 5 have different DJ rearrangements according to IMGT, when aligned they show highly similar CDR3 regions and share a t(14:18) breakpoint, indicating a clonal relationship.
For patients 4 and 5, information in table was obtained from Carlotti et al,16 and patient 6 information was obtained from Jiang et al.17
Site conservation is a universal feature of the tumor clonal population
We sequenced the IGHV gene in samples obtained at sequential time points of FL in 6 patients and interrogated the derived tumor sequence for the acquisition of N-gly sites. Details regarding patient samples can be found in supplemental Table 3. All major clones identified across samples contained 1 or more N-gly sites (Table 2). With the exception of patient 5, N-gly sites were conserved across disease events, despite patients undergoing several lines of therapy between biopsies (supplemental Table 3). For patient 1 and the fourth N-gly site of patient 2, sites were conserved in transformation events through nonsilent mutations that affected the amino acid sequence (eg, NFS>NVS). For the remaining sites in patient 2 and sites in patients 3 and 4, the amino acid sequences were conserved across disease events. Conservation of sites is also supported in our extension cohort of serial FL and transformed samples from patients A to E who underwent IGHV Sanger sequencing (supplemental Table 4). Patients’ 5 and 6 sequential samples were derived from different anatomical sites (supplemental Table 3). For patient 5, the 2 disease events have distinct N-gly sites: NFS in the CDR1 region (first relapse event) and NLT in the FR3 region (third relapse event). For patient 6, all events contain the same N-gly site and amino acid motif (NGS; Table 2). To elucidate whether N-gly site acquisition is a clonal event, we interrogated the subclone population by next-generation sequencing. For patients containing a single N-gly site in their major clone, at least 97% of the subclone population within and across disease events maintained the site (Table 2). For patients 2 and 4, who had multiple N-gly sites, no subclone with the complete absence of N-gly sites was detected. For patient 2, the first, second, and third sites were conserved in more than 96% of subclones across events. The fourth site was conserved in 97.2% of clones in the first relapse sample and in 82% and 85% of subclones in the third relapse and transformation samples, respectively. Interestingly, for all patients, no further N-gly site accumulated within or across events that were not found in the major clone. This infers that site acquisition is a conserved event.
N-gly sites identified in the major clone of 6 patients with FL taken at different time points of disease
| Patient | Disease event | No. of N-gly sites | Region in IGHV | AA position of N-gly site | N-gly motif in major clone | Percentage of unique subclones with N-gly site of major clone present |
|---|---|---|---|---|---|---|
| 1 | Diagnosis | 1 | CDR3 | 108 | NFS | 98.31 |
| Transformation | 1 | CDR3 | 108 | NVS | 98.17 | |
| 2 | 1st relapse | 4 | CDR1, FR2, CDR2, FR3 | 30, 39, 56, 85 | NFS, NMS, NIT, NNS | 99.01, 99.01, 98.87, 97.22 |
| 3rd relapse | 4 | CDR1, FR2, CDR2, FR3 | 30, 39, 56, 85 | NFS, NMS, NIT, NNS | 99.31, 96.8, 98.75, 81.83 | |
| Transformation | 4 | CDR1, FR2, CDR2, FR3 | 30, 39, 56, 85 | NFS, NMS, NIT, NNT | 98.54, 98.16, 97.71, 84.95 | |
| 3 | 2nd relapse | 1 | CDR2 | 56 | NIS | 97.47 |
| 3rd relapse | 1 | CDR2 | 56 | NIS | 97.91 | |
| Transformation | 1 | CDR2 | 56 | NIS | 98.18 | |
| 4 | 1st relapse | 2 | FR2, CDR3 | 48, 108 | NKS, NNS | 97.53, 100 |
| 2nd relapse | 2 | FR2, CDR3 | 48, 108 | NKS, NNS | 97.98, 99.6 | |
| 5 | 1st relapse | 1 | CDR1 | 30 | NFS | 97.14 |
| 3rd relapse | 1 | FR3 | 94 | NLT | 99.19 | |
| 6 | FL diagnosis | 1 | CDR3 | 108 | NGS | 98.41 |
| tFL diagnosis | 1 | CDR3 | 108 | NGS | 97.94 | |
| tFL relapse | 1 | CDR3 | 108 | NGS | 96.74 |
Italic text in bold refers to differences in the location or amino acid (aa) sequence of N-gly sites, referred to as N-gly motif, within the major clone across temporal samples. The major clone was determined by the highest count number. The multiple values in patient 2 and 4 relate to the multiple N-gly sites observed. The majority of subclones across patients and disease events retain the N-gly site of the major clones (P < .0001). AA, amino acid. Numbers given under the heading “AA position of N-gly site” refer to the position of the middle AA making up the N-gly site, according to IMGT numeration of the variable region.
SHM diversity within the N-glycosylation site indicates a selective retention of site-positive subclones
Table 3 highlights the number of unique subclones that have a different sequence in the N-gly site region compared with the major clone of the disease event. As the N-gly site is encoded by 9 nucleotides, these subclones differ from the major clone by at least 1 nucleotide within the N-gly site region. There is wide variation in percentage of affected subclones between patients, ranging from 0% to 58.41% of the total subclone population, indicating the (largely) random targeting of SHM within the variable region. For patients 1, 2 (sites 1-3), 3, 4 (site 1), and 5, the majority of affected subclones across disease events maintain the N-gly site, indicating a positive selection (Figure 1a). Analysis of the codon sequences of these positive subclones across patients and events revealed that N-gly sites are retained through either synonymous mutations or nonsynonymous mutations. The profiling of these subclones from patient 3 is used to highlight these 2 means of N-gly site retention in Figure 1b.
Number of unique subclones that have a different codon sequence at the location of the N-gly site to that of the major clone
| Patient | Disease event | No. of unique tumor-related subclones | No of unique tumor subclones with different codon sequence in N-gly site region to the MC (% of total subclones) | Subclones with different codon sequence in N-gly region | |
|---|---|---|---|---|---|
| Percentage of subclones without N-gly site | Percentage of subclones with N-gly site | ||||
| 1 | Diagnosis | 2727 | 107 (3.92) | 1.69 | 2.24 |
| Transformation | 1690 | 110 (6.51) | 1.83 | 4.67 | |
| 2 | First relapse | 3530 | 96 (2.72), 113 (3.20), 2062 (58.41), 226 (6.40) | 0.99, 0.99, 1.13, 2.78 | 1.73, 2.21, 57.28, 3.63 |
| Third relapse | 3032 | 145 (4.78), 239 (7.88), 982 (32.39), 737 (24.31) | 0.69, 3.10, 1.25, 18.17 | 4.09, 4.68, 31.13, 6.13 | |
| Transformation | 3966 | 134 (3.38), 148 (3.73), 1370 (34.54), 747 (18.84) | 1.46, 1.84, 2.29, 15.05 | 1.92, 1.89, 32.25, 3.78 | |
| 3 | Second relapse | 4103 | 385 (9.38) | 2.53 | 6.85 |
| Third relapse | 2057 | 179 (8.70) | 2.09 | 6.61 | |
| Transformation | 1592 | 455 (28.58) | 1.82 | 26.76 | |
| 4 | First relapse | 81 | 28 (34.57), 0 | 2.47, 0 | 32.1, 0 |
| Second relapse | 248 | 14 (5.65), 1 (0.40) | 2.02, 0.40 | 3.63, 0 | |
| 5 | First relapse | 140 | 22 (15.71) | 2.86 | 12.86 |
| Third relapse | 371 | 21 (5.66) | 0.81 | 4.85 | |
| 6 | FL diagnosis | 2510 | 946 (37.69) | 1.59 | 36.10 |
| tFL diagnosis | 3442 | 265 (7.70) | 2.06 | 5.64 | |
| tFL relapse | 4749 | 214 (4.51) | 2.70 | 1.81 | |
The percentage of these subclones that are either motif positive or motif negative are provided. Percentages were calculated from the total number of unique subclones identified. Values were rounded to 2 decimal points.
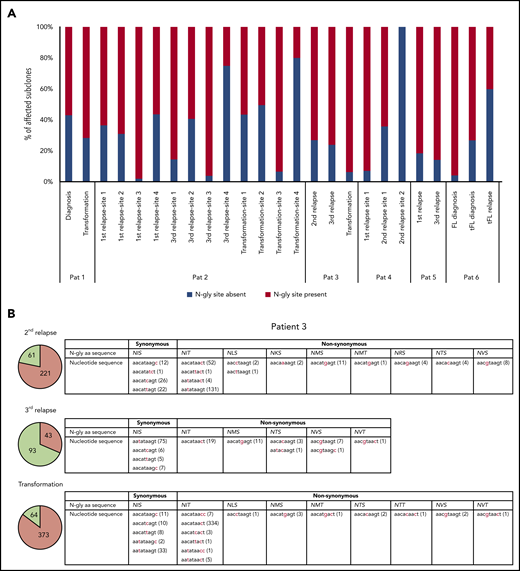
Subclones with distinct codon sequences in the 9-basepair region of the N-gly site region. (A) N-gly site status of subclones with a different codon sequence in N-gly site region to that of the major clone. N-gly site-positive subclones represented here do not display either the same asparagine or serine/threonine encoding nucleotide sequence as that of the major clone. The middle codon for all sequences was checked to ensure for the absence of proline, as this middle amino acid would negatively affect the functionality of the N-gly site. Percentages were calculated from the values in columns 5 and 6 from Table 3. (B) Patient 3 subclones from the 3 disease events are illustrated as an example. The pie charts provide an overview of the distribution of subclones harboring either synonymous (green) or nonsynonymous (orange) mutations compared with the sequence of the major clone. The numbers inside the pie charts are representative of the actual number of subclones. For the second relapse and transformation subclones, the majority of subclones have a different amino acid sequence encoding for the N-gly site (nonsynonymous), whereas the majority of the third relapse subclones maintain the amino acid sequence found in the major clone, which is NIS (synonymous). The tables highlight the variety of amino acid sequences that encode for N-gly sites (eg, NIT, NVT, NIS) found in these subclones and the diverse range of codon sequences that are responsible for both these synonymous and nonsynonymous mutations. Numbers in brackets represent the number of unique subclones presenting with the particular codon sequence.
Subclones with distinct codon sequences in the 9-basepair region of the N-gly site region. (A) N-gly site status of subclones with a different codon sequence in N-gly site region to that of the major clone. N-gly site-positive subclones represented here do not display either the same asparagine or serine/threonine encoding nucleotide sequence as that of the major clone. The middle codon for all sequences was checked to ensure for the absence of proline, as this middle amino acid would negatively affect the functionality of the N-gly site. Percentages were calculated from the values in columns 5 and 6 from Table 3. (B) Patient 3 subclones from the 3 disease events are illustrated as an example. The pie charts provide an overview of the distribution of subclones harboring either synonymous (green) or nonsynonymous (orange) mutations compared with the sequence of the major clone. The numbers inside the pie charts are representative of the actual number of subclones. For the second relapse and transformation subclones, the majority of subclones have a different amino acid sequence encoding for the N-gly site (nonsynonymous), whereas the majority of the third relapse subclones maintain the amino acid sequence found in the major clone, which is NIS (synonymous). The tables highlight the variety of amino acid sequences that encode for N-gly sites (eg, NIT, NVT, NIS) found in these subclones and the diverse range of codon sequences that are responsible for both these synonymous and nonsynonymous mutations. Numbers in brackets represent the number of unique subclones presenting with the particular codon sequence.
For patient 2, the fourth N-gly site was absent in the majority of affected subclones in the third relapse and transformation events, yet remaining N-gly sites may be supporting their survival and expansion, as indicated by their high percentage in the subclone population. Although in patient 6 the affected subclones in the first 2 events were mostly N-gly site positive, the affected subclones of the relapsed tFL event were predominantly site negative. As this is a relatively late disease event, compared with the other patients, the N-gly site may have become redundant in promoting tumor survival. However, it is important to point out that these negative subclones make up 2.7% of the total subclone population (Table 3). Furthermore, site-negative subclones only making up 1% or less of the total count number in samples expressing only a single N-gly site (supplemental Table 5), indicating they are a minor component of the tumor bulk.
N-glycosylation sites in distinct anatomical sites
The distinct anatomical sites for patients’ 5 and 6 serial samples make them important in studies regarding the genealogy of N-gly sites. For both patients, serial disease events were derived from the same precursor B cell, as evidenced by a shared VDJ rearrangement and t(14;18) translocation. For patient 5, the 2 events have distinct N-gly sites (Table 2), whereas for patient 6, all events contain the same N-gly site and amino acid motif (NGS). When comparing the subclones of patient 5, we observe a clear discordance in the SHM pattern of the 2 temporal populations and how this translates into a highly distinct amino acid sequence (supplemental Figure 1). This suggests that for patient 5, there was early divergence of the precursor tumor cell before N-gly site acquirement, whereas for patient 6, the precursor cell diverged after acquiring the N-gly site (Figure 2). Patient 5 demonstrates that N-gly acquirement may not be an event of an early divergence evolution model, instead occurring in anatomical site-specific ancestral cells that have undergone unique SHM processes. However, acquirement occurs early in these site-specific cells, as illustrated by the presence of N-gly sites in 97.14% and 99.19% of unique subclones in the first and third relapse events, respectively (Table 2).
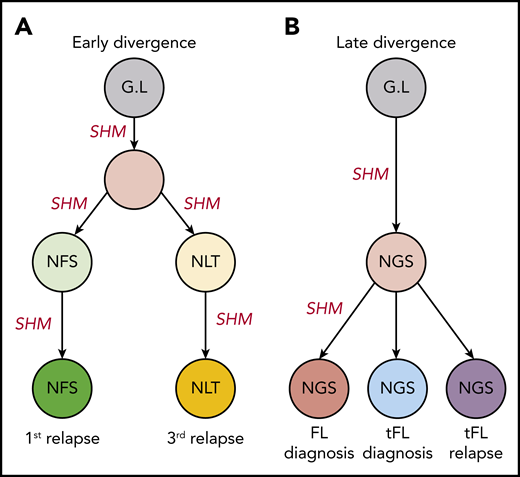
Early and late divergent evolution and N-gly acquirement. (A) Representative of patient 5. N-gly sites are acquired in site-specific precursor cells, explaining the different N-gly sites we observe in the first and third relapse events taken from distinct anatomical sites (Table 2). (B) Representative of patient 6. Here, the N-gly site was acquired in a shared precursor cell before divergence of tumor populations to distinct anatomical sites. G.L, germline. Letters in cells represent the N-gly site amino acid sequences.
Early and late divergent evolution and N-gly acquirement. (A) Representative of patient 5. N-gly sites are acquired in site-specific precursor cells, explaining the different N-gly sites we observe in the first and third relapse events taken from distinct anatomical sites (Table 2). (B) Representative of patient 6. Here, the N-gly site was acquired in a shared precursor cell before divergence of tumor populations to distinct anatomical sites. G.L, germline. Letters in cells represent the N-gly site amino acid sequences.
N-glycosylation site-positive subclones are important in disease progression and migration between anatomical sites
As described here and with the exception of patient 5, N-gly sites are conserved in the clonal population across disease events. When we compared subclone populations, the majority of subclones for each disease event are unique, highlighting the intertumor heterogeneity generated through SHM (Figure 3). The number of shared subclones make up 0.03% to 27.5% of the total tumor subclones identified across disease events. These subclones survive for years, as indicated by the intervals between temporal biopsy acquirements (supplemental Table 3).
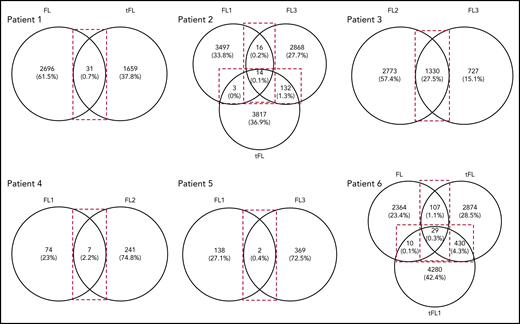
Venn diagrams showing the number of shared and distinct subclones across disease events. Diagrams were generated by comparing the VDJ sequences of subclones in each disease event of a patient (Table 1) to identify the number of shared and unshared subclones. The numbers in the overlaps represent the number of shared subclones between disease events, whereas the numbers outside the overlap represent the number of unique subclones present for the particular disease event. Values in brackets represent the number of subclones as a percentage of the total number of subclones identified across all disease events. These values were rounded to 1 decimal point. For patient 3, the transformation sample was omitted from analysis because of the difference in CDR3 length in comparison with the first and second relapse. FL, FL diagnosis; FL1, first relapse; FL2, second relapse; FL3, third relapse; tFL1, relapsed tFL.
Venn diagrams showing the number of shared and distinct subclones across disease events. Diagrams were generated by comparing the VDJ sequences of subclones in each disease event of a patient (Table 1) to identify the number of shared and unshared subclones. The numbers in the overlaps represent the number of shared subclones between disease events, whereas the numbers outside the overlap represent the number of unique subclones present for the particular disease event. Values in brackets represent the number of subclones as a percentage of the total number of subclones identified across all disease events. These values were rounded to 1 decimal point. For patient 3, the transformation sample was omitted from analysis because of the difference in CDR3 length in comparison with the first and second relapse. FL, FL diagnosis; FL1, first relapse; FL2, second relapse; FL3, third relapse; tFL1, relapsed tFL.
Analysis of shared subclones revealed they are all N-gly site positive. Patient 3 was an exception, as 1.5% of the shared clones were negative (n = 20). Interestingly, most of these negative clones make up a higher percentage of the total tumor count in the successive disease event, suggesting that they confer an advantage (supplemental Table 6). The lack of shared N-gly site-negative subclones in all other patients indicates that progression subclones are dependent on N-gly sites for their long-term survival. Analysis of shared subclones in patients 1 and 2, in which the amino acid composition of N-gly sites changes between disease events in both the major clones and subclone populations (Table 2), reveals that subclones giving rise to transformation tumors were already preexistent as minor subclones in earlier events, gaining clonal dominance after therapy to generate the transformation tumors. This subclone plasticity relies on the conservation of N-gly sites, indicating the important role sites provide subclones involved in disease progression.
Subclones were also shared between biopsy sites, making up 0.4% and 0.3% of the overall subclone population across all disease events for patients 5 and 6, respectively. Similar to the other patients, shared subclones of both patients were all N-gly site positive, with patient 5 subclones containing the site of the first event (NFS motif in the CDR2 region). This indicates that migratory subclones require site presence and could represent a tumor cell feature that is critical for establishing disease in new locations; however, this requires investigation in a larger cohort. The lack of shared subclones containing the N-gly site of the second disease event in patient 5 indicates that this disease event did not arise as a result of a preexisting minor subclone in the first event gaining clonal dominance and repopulating the tumor at another site. This is in contrast to the subclone plasticity we observe in patients 1 and 2, described here.
N-glycosylation sites are acquired early in disease evolution
We can gain insight into tumor evolution by analyzing the degree of SHM in each subclone. The range of SHM for each patient is indicated in Table 4, in which the least and most mutated subclones for each disease event (compared with their germline sequence) were identified by the IMGT High V-QUEST program. The percentage difference in homology between the least and most mutated subclones ranged from 2.0% to 21.7%.
N-gly site status in most and least diverse subclone based on degree of SHM compared with V gene germline sequence
| Patient 1 | Patient 2 | Patient 3 | Patient 4 | Patient 5 | Patient 6 | ||||||||||
|---|---|---|---|---|---|---|---|---|---|---|---|---|---|---|---|
| Least mutated subclone | FL | tFL | FL1 | FL3 | tFL | FL2 | FL3 | tFL | FL1 | FL2 | FL1 | FL3 | FL | tFL | tFL1 |
| Percentage homology to G.L V gene sequence | 96.4 | 98.0 | 88.7 | 88.3 | 94.4 | 84.7 | 86.1 | 95.6 | 89.4 | 89.0 | 98.0 | 89.1 | 97.8 | 93.0 | 92.3 |
| N-gly site presence (Y/N) | Y | Y | Y, Y, Y, Y | Y, Y, Y, N | N, N, N, Y | Y | Y | N | Y,Y | Y, Y | N | Y (FL1 site) | Y | Y | Y |
| Most mutated subclone | |||||||||||||||
| Percentage homology to G.L V gene sequence | 84.3 | 83.9 | 84.7 | 84.3 | 84.3 | 79.0 | 79.4 | 79.6 | 87.4 | 86.9 | 87.5 | 81.5 | 79.4 | 71.3 | 73.5 |
| N-gly site presence (Y/N) | Y | Y | Y, Y, Y, Y | Y, Y, Y, Y | Y, Y, Y, Y | Y | Y | Y | Y,Y | Y,Y | Y | Y | Y | Y | Y |
| Percentage difference in homology between least and most mutated subclones | 12.1 | 14.1 | 4.0 | 4.0 | 10.1 | 5.7 | 6.7 | 16.0 | 2.0 | 2.1 | 10.5 | 7.6 | 18.4 | 21.7 | 18.8 |
Sequences were analyzed for presence or absence of the N-gly motif site or sites found in the major clone.
For patients 1, 4, and 6, N-gly sites were acquired within their least mutated subclones in all their disease events. For patient 6, acquirement of the CDR3 located site was observed after only 4 nucleotide substitutions (97.8% sequence homology to germline V gene; Table 4). However, for the least mutated subclone of the transformed event for patient 3, the N-gly site is not acquired despite the subclone harboring a relatively greater number of point mutations. Despite this heterogeneity, N-gly sites are conserved once acquired, despite ongoing SHM, as evidenced in the most mutated subclones of all patients. Therefore, subclone selection is based on conserving N-gly sites in spite of active mechanisms that have the potential to disrupt this.
Lineage trees specifically based on VDJ sequences were used to visualize the evolutionary intraclonal hierarchy.18 For patients 4 and 5, the complete hierarchy can be visualized in lineage trees (Figures 4 and 5; supplemental Figure 2).
Lineage trees for patient 4 showing the N-gly site status of each subclone. The left panel represents the lineage tree of the first relapse event, whereas the right panel represents part of the lineage tree of the second relapse event. Each subclone is represented by a node; major clones are indicated in larger nodes. Nodes are split into 2 colors to represent the 2 N-gly sites found in the FR2 and CDR3 regions for patient 4 (Table 2). FR2 site is represented in the left half, and CDR3 site is represented in the right half, of the nodes. Nodes differing in color to the major clone represent subclones with different N-gly site codon sequences. Black represents absence of the FR2 or CDR3 site. Major clones between the 2 disease events have a different codon sequence in the FR2 N-gly site, indicated by the difference in color. Nodes in boxes represent shared subclones between events. White nodes represent subclones inferred to exist, but not detected through 454 sequencing. Germline nodes are in gray at the top of the tree, marked G.L. Numbers on branches indicate more than 1 mutation separating 1 node from the other. The full lineage tree of the second relapse event is provided in supplemental Figure 2A. MC, major clone.
Lineage trees for patient 4 showing the N-gly site status of each subclone. The left panel represents the lineage tree of the first relapse event, whereas the right panel represents part of the lineage tree of the second relapse event. Each subclone is represented by a node; major clones are indicated in larger nodes. Nodes are split into 2 colors to represent the 2 N-gly sites found in the FR2 and CDR3 regions for patient 4 (Table 2). FR2 site is represented in the left half, and CDR3 site is represented in the right half, of the nodes. Nodes differing in color to the major clone represent subclones with different N-gly site codon sequences. Black represents absence of the FR2 or CDR3 site. Major clones between the 2 disease events have a different codon sequence in the FR2 N-gly site, indicated by the difference in color. Nodes in boxes represent shared subclones between events. White nodes represent subclones inferred to exist, but not detected through 454 sequencing. Germline nodes are in gray at the top of the tree, marked G.L. Numbers on branches indicate more than 1 mutation separating 1 node from the other. The full lineage tree of the second relapse event is provided in supplemental Figure 2A. MC, major clone.

Lineage trees for patient 5, showing the N-gly site status of each subclone. The left panel represents the lineage tree of the first relapse event, whereas the right panel represents part of the lineage tree of the third relapse event. Black nodes represent nodes that are absent of N-gly site found in the major clone. Nodes differing in color to the major clone represent subclones with different N-gly site codon sequences. The 4 nodes split into 2 colors (black and orange) in the right panel represent subclones that are absent for the N-gly site found in the major clone of the third relapse (NLT) event, but are positive for the N-gly site found in the first relapse event (NFS). Shared subclones are highlighted in boxes. The full lineage tree of the third relapse event is provided in supplemental Figure 2B.
Lineage trees for patient 5, showing the N-gly site status of each subclone. The left panel represents the lineage tree of the first relapse event, whereas the right panel represents part of the lineage tree of the third relapse event. Black nodes represent nodes that are absent of N-gly site found in the major clone. Nodes differing in color to the major clone represent subclones with different N-gly site codon sequences. The 4 nodes split into 2 colors (black and orange) in the right panel represent subclones that are absent for the N-gly site found in the major clone of the third relapse (NLT) event, but are positive for the N-gly site found in the first relapse event (NFS). Shared subclones are highlighted in boxes. The full lineage tree of the third relapse event is provided in supplemental Figure 2B.
For patient 4, the earliest experimentally derived subclones (identified as filled nodes closest to the germline Ig sequence at the top of the tree) are N-gly site-positive. Although patient 4 does not have any truly negative subclones, several subclones lose at least a single N-gly site. Some of these subclones are observed to undergo further SHM and reacquire the lost site (Figure 4), giving rise to several further clones. This is in contrast to patient 5, in whom the loss of the single N-gly site results in the subclone not undergoing further diversification or expansion (Figure 5). One N-gly site-negative subclone in the first relapse event is placed high in the tree and only differs from the germline sequence by 5 bases. This subclone corresponds to the least mutated subclone (98% homology) highlighted in Table 4, indicating this clone never acquired the N-gly site. The other site-negative subclones were descendants of site-positive clones because of ongoing SHM. As these clones are lost from progression samples, we can infer their elimination.
N-glycosylation site-negative clones arise from further SHM of site-positive clones
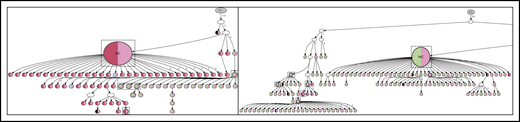
With greater numbers of N-gly site-negative subclones as a result of an increase in overall subclones, patients 1, 3, and 6 lineage trees give a more comprehensive insight into the behavior of site-negative clones in the tumor hierarchy (Figure 6). As patient 2 did not have any truly negative subclones, the analysis was omitted. However, these negative subclones represent a minority within the heterogeneous population. For patient 1, negative clones represented 1.7% and 1.8% of the subclone population in diagnosis and transformation events, respectively. For patient 3, negative clones found in second relapse, third relapse, and transformation represented 2.5%, 2.1%, and 1.8% of the population, respectively. For patient 6, negative clones represent 1.6%, 2.1%, and 2.7% of the subclone population in FL diagnosis, tFL diagnosis, and tFL relapse events. N-gly site-negative clones were found to arise from either a positive or a negative clone, through a single nucleotide variant. Several negative clones can arise from a shared positive ancestor, as depicted through the wide branching. Further SHM in these negative clones does not result in site reacquirement or gain of new sites.
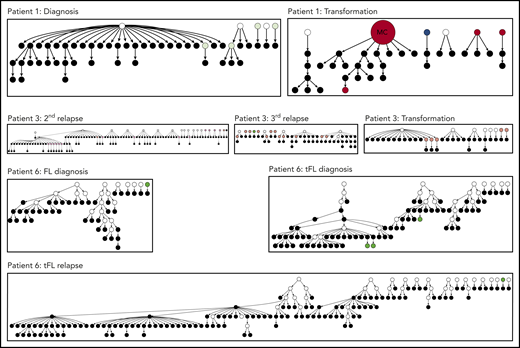
Hierarchy of N-gly site-negative clones in relation to their direct ancestral clone for patients 1, 3, and 6. This diagram represents part of the lineage trees, as the majority of subclones (which are positive) are not shown and the interconnection between clones from a germline sequence is not depicted. Only the negative subclones, their parent clone, and their progenitor clones are depicted here to highlight their generation and contribution to the clonal repertoire within an event. For all patients, black nodes represent N-gly site-negative clones. White nodes represent clones not detected by the sequencing platform, but predicted to exist by the IgTree program. All white nodes are assumed to contain the N-gly site because of a number of other experimentally detected progeny clones being site-positive. Gray nodes in the patient 1 diagnosis event represent N-gly site-positive subclones that contain the same N-gly site-encoding codon sequence to the major clone. Dark red nodes in the patient 1 transformation represent N-gly site-positive subclones that contain the same N-gly site-encoding codon sequence to the major clone of the event. Pink nodes in patient 3 represent N-gly site-positive subclones that contain the same N-gly site-encoding codon sequence to the major clone of the event. Green nodes in patient 6 represent N-gly site-positive subclones that contain the same N-gly site-encoding codon sequence to the major clone of the event. Other colored nodes in trees represent N-gly site-positive clones, which contain a different codon sequence in the N-gly site compared with the major clone of the disease event. The full lineage trees can be requested from the corresponding author.
Hierarchy of N-gly site-negative clones in relation to their direct ancestral clone for patients 1, 3, and 6. This diagram represents part of the lineage trees, as the majority of subclones (which are positive) are not shown and the interconnection between clones from a germline sequence is not depicted. Only the negative subclones, their parent clone, and their progenitor clones are depicted here to highlight their generation and contribution to the clonal repertoire within an event. For all patients, black nodes represent N-gly site-negative clones. White nodes represent clones not detected by the sequencing platform, but predicted to exist by the IgTree program. All white nodes are assumed to contain the N-gly site because of a number of other experimentally detected progeny clones being site-positive. Gray nodes in the patient 1 diagnosis event represent N-gly site-positive subclones that contain the same N-gly site-encoding codon sequence to the major clone. Dark red nodes in the patient 1 transformation represent N-gly site-positive subclones that contain the same N-gly site-encoding codon sequence to the major clone of the event. Pink nodes in patient 3 represent N-gly site-positive subclones that contain the same N-gly site-encoding codon sequence to the major clone of the event. Green nodes in patient 6 represent N-gly site-positive subclones that contain the same N-gly site-encoding codon sequence to the major clone of the event. Other colored nodes in trees represent N-gly site-positive clones, which contain a different codon sequence in the N-gly site compared with the major clone of the disease event. The full lineage trees can be requested from the corresponding author.
Discussion
The high propensity of relapse in patients with FL suggests that current therapies are not successfully targeting the early aberrations needed to propagate disease, leading to acquirement of further mutations that reduce effective treatment options. Therefore, uncovering and targeting features of FL ancestral cells may offer durable outcomes for patients.
We report for the first time the behavior of N-gly sites during disease progression by analyzing the clonal repertoire of temporal FL samples based on IGHV sequencing. Samples ranged from diagnosis to transformation and included a mixed patient cohort with variable clinical disease courses, reflecting the heterogeneous nature of the disease (supplemental Table 3). All patients harbored at least 1 acquired site in their earliest disease event that was conserved in both the heterogeneous subclonal population and the overall tumor mass. N-gly sites were also retained in sequential relapse and transformation samples, although for patients 1 and 2, sites were conserved through nonsynonymous mutations (Table 2). Analysis of the 9 base pair region encoding the N-gly site for each patient revealed a group of subclones harboring a different nucleotide sequence in the site to that of the major clone, as a result of ongoing SHM. However, the majority of these affected subclones maintained the N-gly site for patients 1, 2 (sites 1-3), 3, 4 (site 1), and 5 across disease events through synonymous and nonsynonymous mutations (Figure 1a). Although the acquirement of additional "driver" mutations through natural or therapy-related selection pressures may dampen the tumor’s microenvironment dependency at later stages of disease, the conservation of N-gly sites suggest they retain an important functional significance.
The presence of negative subclones is an expected occurrence, as SHM does not differentiate between seemingly favorable and nonfavorable mutations. Lineage trees have revealed how negative clones are derived from positive clones, suggesting acquirement of sites is an early event. As these negative clones represent only a small percentage of the tumor population, they are likely to be outcompeted by N-gly site-positive clones, perhaps because of loss of the microenvironmental interaction provided via the added mannoses. Negative clones can still undergo SHM, but do not reacquire sites in their progeny and, with the exception of patient 3, are lost from subsequent samples, indicating that they are not selected to undergo expansion or long-term survival. Sanger sequencing of the light chain variable region for patient 3 did not reveal additional N-gly sites in the major clone. However, although we cannot assume that sites in the light chain are not acquired subclonally, and may therefore be present in the negative subclones of patient 3, determining the light chain N-gly site status of IGHV-based subclones is currently impossible.
Patient 5 provided an interesting case for 2 reasons; the different anatomical sites for the 2 events and the discordant SHM within the IGHV between the 2 clonal populations. This discordance suggests an early divergence, in which an ancestral cell with limited SHM migrated from 1 site to another, where selection pressures drove the outward growth of subclones with a specific SHM pattern. However despite IGHV sequence heterogeneity, the acquirement of N-gly sites within each population at different locations illustrates that sites are an essential feature of FL. The sharing of 2 subclones with the N-gly site of the diagnostic sample highlights the trafficking ability of site-positive subclones between anatomical sites, which is also observed in patient 6 (Figure 3). However for patient 6, SHM patterns between events were highly similar, and the CDR3 N-gly site was conserved throughout, suggesting a late divergency between events from a shared ancestral cell. Therefore, N-gly sites are required in both early and late divergency models of evolution.
The conservation of N-gly sites within and across disease events and the lack of accumulation during ongoing SHM suggests they are an early and stable event in FL pathogenesis. Early events are usually determined through their conservation within temporal samples and for patients 1 to 3, whole-genome sequencing/whole-exome sequencing (WGS/WES) had previously identified key genetic aberrations within a putative ancestral cell, known as the common progenitor cell (CPC).19-21 Patients 1 and 3 had a sparse CPC because of the lack of shared genetic aberrations across temporal samples, suggesting an early divergency with episodes arising from more genetically independent pathways. However, despite this mutational heterogeneity between events, N-gly sites are conserved, identifying an important feature of the CPC. This is a significant finding, as the CPC is believed to be the reservoir pool from which successive disease events arise, accounting for the high relapse rates experienced by the majority of patients. The latency between biopsy sampling (supplemental Table 3) suggests an N-gly site-positive CPC that is able to remain dormant for many years before a mutational event leads to a new disease episode. The mannose-lectin interaction enables tumor retention and survival of the CPC, permitting the accumulation of genetic events that lead to overt disease, suggesting a critical priming event in FL manifestation. Although epigenetic deregulation is a considered CPC event, as evidenced in the previous genetic profiling of patients’ 1 to 3 samples, our data imply that it is not solely sufficient for "driving" the disease. Instead, it seems that the N-gly site profile determines which clones are able to expand and survive during disease progression, irrespective of the genetic profile of the subclones. Analyzing the genetic profile of N-gly site-negative subclones will determine the validity of this hypothesis.
Although the t14:18 translocation can be found in healthy circulating B cells that do not go on to become malignant,22-24 N-gly sites in the variable region are restricted to germinal center-derived lymphomas,3 indicating an attractive and tumor-specific therapeutic target that may lead to the loss of a critical CPC-microenvironmental interaction and reduce the frequency of relapse. The presence of N-gly sites in the presumed FL precursor, ISFN15 supports the theory of N-gly sites occurring at an early stage of pathogenesis, being acquired even before disease manifestation. Figure 7 summarizes how N-gly sites affect the evolution of disease.
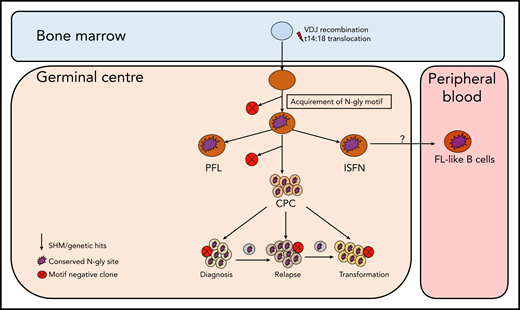
Simplified model of FL evolution and progression based on the high-throughput sequencing of the immunoglobulin heavy chain variable gene and N-gly analysis. After the t14;18 translocation during a likely error in VDJ recombination in the bone marrow, the B cell migrates to the germinal center, where it undergoes SHM. N-gly sites are acquired early on in the process (purple figure) in the presumed precursor lesion, ISFN. As FL-like B cells are believed to represent the circulating counterparts of ISFN, N-gly sites also may be retained in these cells. Precursor cells that do not acquire sites through SHM undergo clonal deletion, assumed by the low frequency of site-negative subclones in the clonal repertoire. Clones maintain conservation of N-gly sites during tumor evolution through ongoing SHM and gain of additional mutations, leading to an ancestral cell pool population, the CPC. With the exception of patient 5, the CPC provides a reservoir from which distinct disease events arise, which retain the N-gly site. At each stage of evolution, SHM results in the emergence of clones that lose N-gly sites because of the largely random nature of the process that does not distinguish between favorable and nonfavorable mutations. However, these represent only a minor mass of the heterogeneous tumor population, and with the exception of patient 3, cannot traffic between events, indicating their insignificance in propagating progression and their likely loss from the clonal repertoire through cell death pathways. PFL, partial involvement by FL.
Simplified model of FL evolution and progression based on the high-throughput sequencing of the immunoglobulin heavy chain variable gene and N-gly analysis. After the t14;18 translocation during a likely error in VDJ recombination in the bone marrow, the B cell migrates to the germinal center, where it undergoes SHM. N-gly sites are acquired early on in the process (purple figure) in the presumed precursor lesion, ISFN. As FL-like B cells are believed to represent the circulating counterparts of ISFN, N-gly sites also may be retained in these cells. Precursor cells that do not acquire sites through SHM undergo clonal deletion, assumed by the low frequency of site-negative subclones in the clonal repertoire. Clones maintain conservation of N-gly sites during tumor evolution through ongoing SHM and gain of additional mutations, leading to an ancestral cell pool population, the CPC. With the exception of patient 5, the CPC provides a reservoir from which distinct disease events arise, which retain the N-gly site. At each stage of evolution, SHM results in the emergence of clones that lose N-gly sites because of the largely random nature of the process that does not distinguish between favorable and nonfavorable mutations. However, these represent only a minor mass of the heterogeneous tumor population, and with the exception of patient 3, cannot traffic between events, indicating their insignificance in propagating progression and their likely loss from the clonal repertoire through cell death pathways. PFL, partial involvement by FL.
For original data, please contact s.krysov@qmul.ac.uk.
The publication costs of this article were defrayed in part by page charge payment. Therefore, and solely to indicate this fact, this article is hereby marked “advertisement” in accordance with 18 USC section 1734.
Acknowledgments
The authors thank Genewiz (New Jersey, US) for performing next generation sequencing. The authors acknowledge the Tissue Bank at Barts Cancer Institute (UK) for providing patient samples and corresponding clinical information.
This work was supported by grants from the Pathological Society of Great Britain and Ireland, Leukaemia UK Charity, Barts Cancer Charity and The Greg Wolf Fund.
Authorship
Contribution: M.O., E.C., S.A., J.O., F.S., M.C., and S.K. performed research and analyzed data; M.O., J.G.G., F.F., F.K.S., M.C., and S.K. designed the research and analyzed the data; S.A. and J.O. provided patient samples and analyzed clinical data; M.O. and S.K. wrote the initial draft of the manuscript; and all authors contributed to the modification of the draft and approved the final submission.
Conflict-of-interest disclosure: The authors declare no competing financial interests.
Correspondence: Sergey Krysov, Centre for Haemato-Oncology, Barts Cancer Institute, John Vane Science Centre, Queen Mary University of London, London EC1M 6BQ, United Kingdom; e-mail: s.krysov@qmul.ac.uk.

This feature is available to Subscribers Only
Sign In or Create an Account Close Modal