

Key Points
Clinically relevant human iNKT cell phenotypes with distinct effector functions were identified.
Dominant iNKT cell heterogeneity in allogeneic hematopoietic stem cell transplanted and type 1 diabetic patients were elucidated.

Abstract
Human invariant natural killer T (iNKT) cells are a rare innate-like lymphocyte population that recognizes glycolipids presented on CD1d. Studies in mice have shown that these cells are heterogeneous and are capable of enacting diverse functions, and the composition of iNKT cell subsets can alter disease outcomes. In contrast, far less is known about how heterogeneity in human iNKT cells relates to disease. To address this, we used a high-dimensional, data-driven approach to devise a framework for parsing human iNKT heterogeneity. Our data revealed novel and previously described iNKT cell phenotypes with distinct functions. In particular, we found 2 phenotypes of interest: (1) a population with T helper 1 function that was increased with iNKT activation characterized by HLA-II+CD161– expression, and (2) a population with enhanced cytotoxic function characterized by CD4–CD94+ expression. These populations correlate with acute graft-versus-host disease after allogeneic hematopoietic stem cell transplantation and with new onset type 1 diabetes, respectively. Our study identifies human iNKT cell phenotypes associated with human disease that could aid in the development of biomarkers or therapeutics targeting iNKT cells.
Introduction
Human invariant natural killer T (iNKT) cells are rare innate-like lymphocytes that recognize lipids presented on CD1d cells with their semi-invariant T-cell receptor (TCR) Vα24-Jα18 and Vβ11 chains.1,2 In comparison with other lymphocyte populations, iNKT cells rapidly mount a potent response with broad effector functions upon activation.3 Despite being present in low frequencies, these cells have been shown to play a role in allogeneic hematopoietic stem cell transplantation (HSCT), cancer immunity,4 and diabetes.
In mice, it has been established that iNKT cells are a heterogeneous population comprising of defined iNKT1, iNKT2, and iNKT17 (following the T helper [Th]1/2/17 paradigm) subsets.5-7 Human iNKT cells, however, have not been studied to the same extent as murine iNKT cells, and the framework for understanding human iNKT cell biology has largely been described by CD4 and CD8 cell surface expression.5,8 For example, human CD4+ iNKT cells produce more interleukin-4 (IL-4) and IL-13 compared with CD4–CD8– (double-negative [DN]) and CD8+ iNKT cells, whereas secretion of interferon-γ (INF-γ) and tumor necrosis factor α (TNF-α) seem to be attributed to all iNKT cells.8
Despite the studies performed in murine disease models that highlight the therapeutic potential of iNKT cells, comparing these results to humans has been complicated. In clinical cohorts of acute graft-versus-host disease (GVHD)9 and type 1 diabetes (T1D),10-13 iNKT cells have so far been assessed with basic T-cell surface markers. Consequently, the data in disease models are to some extent conflicting, and they point to different mechanisms of action.14-17 For example, in mouse models, CD4+ iNKT cells have been proposed to control GVHD by influencing immune regulatory pathways through the production of IL-418 ; however, in clinical data, CD4– iNKT cells have been shown to correlate with reduced incidence of GVHD through cytotoxic deletion of antigen-presenting cells.19 Likewise, in 1 study, T1D patients were associated with IFN-γ–deficient or dysregulated iNKT cells,13 whereas other studies showed T1D patients to be associated with Th1-biased iNKT cells.10,12 These conflicting results are a sample of clinical investigations of iNKT cells and suggests that a more comprehensive framework for understanding human iNKT cells is needed.
To better understand human iNKT cells, we compared iNKT cells from the peripheral blood of patients with and without immune disease by using a high-dimensional, data-driven approach for exploring human iNKT heterogeneity in healthy individuals and in a clinical setting. We then used our findings to associate previously unidentified iNKT cell subsets with distinct and disease-relevant effector functions.
Materials and methods
Patients and disease status
Forty-six HSCT patients and 11 T1D patients provided informed consent in accordance with the Declaration of Helsinki and were enrolled in research and biobanking protocols approved by the Stanford University Institutional Review Board. Patients were clinically scored by treating attending physicians for acute GVHD using the Beardsman criteria.20 Patients were clinically evaluated for T1D by attending physicians, and antibody reactivity was assessed by clinical testing. For normal healthy controls, buffy coats were purchased from Stanford Blood Center (SBC). Patient characteristics are presented in supplemental Tables 1-3, available on the Blood Web site.
Isolation of iNKT cells
For single-cell sequencing, buffy coats from healthy individuals were obtained from SBC, and 30 to 80 mL of blood was obtained by blood draw into heparinized collection tubes from HSCT patients and were analyzed fresh. For bulk sequencing and flow cytometric analysis of patient and healthy donor iNKT cells, frozen peripheral blood mononuclear cells (PBMCs) from the Stanford Blood & Marrow Transplantation Biobank and SBC, respectively, were used. PBMCs were isolated by using a Ficoll density gradient (GE Healthcare, Uppsala, Sweden) and were stored in liquid nitrogen.
iNKT cells were isolated by enrichment from PBMCs using MACS columns and positive selection with anti-iNKT microbeads (Miltenyi Biotec, San Diego, CA) and then purified with fluorescence-activated cell sorting (FACS) (BD FACSAria/FACSAria Fusion; BD Biosciences, San Jose, CA) using the following gates: lymphocytes, single cells, live (aqua–), CD3+CD19–, and iNKT+ (clone 6β11).
Single-cell and bulk RNA sequencing
Fresh iNKT cells were bead-enriched using anti-iNKT microbeads (Miltenyi Biotec) and sorted to >98% purity by FACS (Figure 1A). For single-cell RNA sequencing, the Chromium Single Cell 3′ Library and Gel Bead Kit and Controller (10X Genomics Inc., Pleasanton, CA) were used for barcoding and library preparation (Stanford Functional Genomics Center [SFGF]). The libraries were sequenced on an Illumina HiSeq system (Illumina Inc, San Diego, CA) at SFGF. CellRanger was used to convert the Illumina basecall files (*.bcl) to a gene-barcode matrix with the GRCh37 human genome as the reference, and Seurat21,22 in R was used for analysis according to Seurat’s vignette.
![Gene signatures in patients after allogeneic HSCT with and without acute GVHD and in individuals who did not receive a transplant. (A) Isolation of iNKT cells. Representative plot showing the results of the purification procedure for all sequencing experiments. (B) Concatenated t-distributed stochastic neighbor embedding (tSNE) plot of single-cell messenger RNA-sequencing of iNKT cells from 1 healthy individual who did not receive a transplant (green), 1 patient after HSCT without GVHD (blue), and 1 patient after HSCT with onset of gastrointestinal GVHD (dark red). A heatmap shows selected differential gene expression (log10 scale of unique molecular identifier [UMI] counts) across the 3 cell clusters detected in the tSNE plots, and violin plots show the normalized distribution of expression of genes between the 3 individuals (bottom right). APC, antigen-presenting cell; FITC, fluorescein isothiocyanate.](https://ash.silverchair-cdn.com/ash/content_public/journal/blood/135/11/10.1182_blood.2019001903/3/m_bloodbld2019001903f1.png?Expires=1769797302&Signature=vPdWqC4IRDnjHOHGywmt3JkJhdtsEQI6NZqu1TrvI6ct-DmNk5hC~YKyENB-wdhg5Tl2qSZhtlmL-zQw2vBjUKRgU~pc1Ffm93GBLShmF2WsnXUZIwf3gne6Wl1~l-SLCLeOJXBEh81RsNZZTzy39Lrj8PQa7sQ9Us2uQ5Czrm1QXs4ewVyqeedRcrZ~zN~2Sp0cg~OBuvJdWJ7oTfaYFvciFhwIL0AdEhyDfynpeR5Ae7F852AF1lCHknETtsCcVioqi44bF5Xe5lTcv0nus6fT~7yH5MILxqBjjEPXkSRIBaKr6MfCGJebWbmn0ImOh6XstukVGZSMmf1XhHsz9w__&Key-Pair-Id=APKAIE5G5CRDK6RD3PGA)
Gene signatures in patients after allogeneic HSCT with and without acute GVHD and in individuals who did not receive a transplant. (A) Isolation of iNKT cells. Representative plot showing the results of the purification procedure for all sequencing experiments. (B) Concatenated t-distributed stochastic neighbor embedding (tSNE) plot of single-cell messenger RNA-sequencing of iNKT cells from 1 healthy individual who did not receive a transplant (green), 1 patient after HSCT without GVHD (blue), and 1 patient after HSCT with onset of gastrointestinal GVHD (dark red). A heatmap shows selected differential gene expression (log10 scale of unique molecular identifier [UMI] counts) across the 3 cell clusters detected in the tSNE plots, and violin plots show the normalized distribution of expression of genes between the 3 individuals (bottom right). APC, antigen-presenting cell; FITC, fluorescein isothiocyanate.
Gene signatures in patients after allogeneic HSCT with and without acute GVHD and in individuals who did not receive a transplant. (A) Isolation of iNKT cells. Representative plot showing the results of the purification procedure for all sequencing experiments. (B) Concatenated t-distributed stochastic neighbor embedding (tSNE) plot of single-cell messenger RNA-sequencing of iNKT cells from 1 healthy individual who did not receive a transplant (green), 1 patient after HSCT without GVHD (blue), and 1 patient after HSCT with onset of gastrointestinal GVHD (dark red). A heatmap shows selected differential gene expression (log10 scale of unique molecular identifier [UMI] counts) across the 3 cell clusters detected in the tSNE plots, and violin plots show the normalized distribution of expression of genes between the 3 individuals (bottom right). APC, antigen-presenting cell; FITC, fluorescein isothiocyanate.
Single-cell targeted RNA-seq (scRNA-seq) (genes listed in supplemental Table 4) was performed using a BD Resolve (now Rhapsody) system. The library was prepared according to the manufacturer’s instructions (Stanford Human Immune Monitoring Core) and was sequenced on an Illumina HiSeq system. The BD Resolve Targeted Analysis Pipeline in Sevenbridges (Seven Bridges Genomics, San Francisco, CA) was used for data alignment and quantification, and DataView v1.0 (BD Genomics) in MatLab was used for analysis.
The RNA input for bulk sequencing library construction was isolated from iNKT cells using RNeasy Mini Kit (Qiagen, Venlo, The Netherlands). The libraries were prepared using the SMARTer Stranded Total RNA-seq Pico Input Kit (Takara Bio USA Inc, Mountain View, CA) for samples from healthy individuals and SMART-seq v4 Ultra Low Input RNA Kit (Takara Bio) for patient samples. The libraries were sequenced with an Illumina HiSeq. The Illumina basecall files (*.bcl) were converted to FASTQ files using the Illumina Conversion Software. STAR23 and RSEM24 were used for alignment and quantification of the data from healthy individuals, and TopHat225 and HTSeq26 were used on the data from HSCT patients. The GRCh37 human genome was used as the reference.
Flow cytometry
Antibodies used are described in supplemental Table 5. Data were collected on a BD Symphony, FACSAria, LSR-II, or Fortessa flow cytometer. The Foxp3/Transcription Factor Staining Buffer Set (eBioscience, Thermo Fisher Scientific, Waltham, MA) was used for intracellular staining. Phorbol 12-myristate-13-acetate (20 ng/mL) and ionomycin (1 μg/mL) (Thermo Fisher Scientific), Golgistop (0.67 μL/mL), and Golgiplug (1 μL/mL) (BD Bioscience) were used for cytokine staining assays. The cells were cultured for 4 to 5 hours using RPMI 1640 supplemented with 100 U/mL penicillin, and 100 mg/mL streptomycin (all from Thermo Fisher Scientific), and 5% heat-inactivated human antibody serum (Merck, Darmstadt, Germany) (complete RPMI) in an atmosphere of 5% CO2. Data were analyzed using FlowJo software (FlowJo LLC, Ashland, OR) and Cytobank (Cytobank Inc, Santa Clara, CA).
Cell culture, activation, suppression, and cytotoxicity assays
Enriched iNKT cells from buffy coats (SBC) were stimulated for 24 hours to 14 days with CD3/CD28 Dynabeads (Thermo Fisher Scientific) at a 1:1 ratio, or with autologous irradiated (40 Gy) PBMCs at a 1:10 ratio and 1 μM α-galactosylceramide (αGalCer; AdipoGen, Liestal, Switzerland), OCH (Cayman Chemical), ganglioside GD3 (Avanti Polar Lipids, Inc), α-C-glycoside (National Institutes of Health Tetramer Facility), or GSL-1 (National Institutes of Health Tetramer Facility) together with 100 IU/mL recombinant interleukin-2 (rIL-2) (Hoffman-La Roche, Nutley, NJ) in complete RPMI. The cells were split when confluent, and fresh media was added every 2 to 3 days. At day 10, iNKT cells were re-stimulated with autologous irradiated (40 Gy) PBMCs at a 1:1 ratio. For titration experiments, iNKT cells were cultured with or without IL-2 (0-500 IU/mL) and with CD3/CD28 Dynabeads at defined ratios. For cytokine stimulation, we used 50 ng/mL IL-4, 50 ng/mL IL-12, 100 ng/mL IL-15, and 100 ng/mL IL-18 (Thermo Fisher Scientific). For culture of specific iNKT cell populations, the cells were first sorted for purity by using FACS.
For suppression assays, expanded iNKT cells were mixed with CD3+ microbead-enriched (Stemcell Technologies, Vancouver, BC, Canada) T cells at defined ratios in complete RPMI. The cells were stimulated with CD3/CD28 Dynabeads at a 1:1 ratio. T cells were labeled with CellTrace Violet (Thermo Fisher Scientific) according to manufacturer’s instructions. The labeling media contained 0.1% fetal calf serum (Thermo Fisher Scientific). For CD94 depletion, iNKT cells were negatively enriched for CD94– cells using CD94-phycoerythrin (BioLegend, San Diego, CA) and anti-phycoerythrin microbeads (Miltenyi Biotec).
To determine cytotoxicity, iNKT cells were cultured with CellTrace Violet-labeled CD1d+ Jurkat cells27 (Clone E6-1, American Type Culture Collectio [ATCC]), CD1d– K562 cells (CCL-243; ATCC), or with allogeneic human myeloid dendritic cells (DCs) (SBC) obtained from a EasySep Human Myeloid DC Enrichment Kit (Stemcell Technologies) at a 1:1 ratio in complete RPMI with or without 1 μM αGalCer.
Statistical analysis
The Wilcoxon matched-pair signed-rank test was used for paired samples. The Mann-Whitney U test was used for unpaired groups of samples. For more than 2 paired samples, we used Friedman test with Dunn’s multiple comparisons correction. Tests were performed using GraphPad Prism 8 (GraphPad Software, La Jolla, CA). Values of P < .05 were considered statistically significant. Statistics for single-cell sequencing data were collected from program functions in Seurat21 and BD DataView 1.0. viSNE28 plots were generated using Cytobank. For bulk RNA-seq, CIBERSORT was used to score likeness of the iNKTs in our samples to known immune cell transcriptional phenotypes.29
Results
Bulk and single-cell iNKT gene signatures after HSCT
To assess iNKT transcriptional heterogeneity on the single-cell level and potential changes with HSCT outcome, we used scRNA-seq to sequence iNKT cells isolated from a normal healthy individual, a patient who developed GVHD after HSCT, and a patient with healthy reconstitution after HSCT. We used the antibody clone 6β11 to identify iNKT cells8 (Figure 1A). The scRNA-seq platform captured transcripts by their poly(A)-tail, which provided an unbiased assessment of gene expression. By using linear dimensional reduction followed by a graph-based clustering approach, 3 clusters were identified on the basis of differentially expressed genes (Figure 1B, top). One cluster was identified by CXCR4, another cluster was identified based on HLA-II, and the third cluster was identified by KLRD1, KLRB1, and genes associated with cell-mediated cytotoxicity (Figure 1B, bottom). The healthy individual had cells evenly distributed in all 3 clusters, whereas the patient samples showed a skewed distribution. The patient with healthy reconstitution (labeled as HSCT) had few HLA-II+ cells compared with the aGVHD patient. Independent analysis of each one of the individuals is presented in supplemental Figure 1A-B.
Common immune genes associated with T-cell phenotype such as CD4 and CD8 were not captured well using the scRNA-seq platform (supplemental Figure 1C). Thus, to add a second perspective on exploring single-cell transcriptional iNKT heterogeneity, we evaluated iNKT cells from 2 healthy individuals with a targeted scRNA-seq platform using primers for 312 immune genes (Figure 2A; supplemental Figure 2A-D; supplemental Tables 4 and 6). Interestingly, we found that resting iNKTs seemed homogeneous; however, brief TCR activation induced 2 distinct gene phenotypes based on predefined gene sets for immune populations (Figure 2A): 1 type that is natural killer (NK) cell–like (Figure 2B) and another that is memory T-cell–like (Figure 2C). The NK cell-like cluster was enriched in the chemokines CCL3 and CCL4 and cytotoxic factors GZMB, PRF1, and GNLY, whereas the memory T-cell–like cluster was enriched in IL2 and IL4 expression (Figure 2D). IFNγ and TNFα seemed to be equally expressed by the 2 activated populations. Although we used a targeted approach, CD4 and CD8A were not differentially expressed (supplemental Table 6).
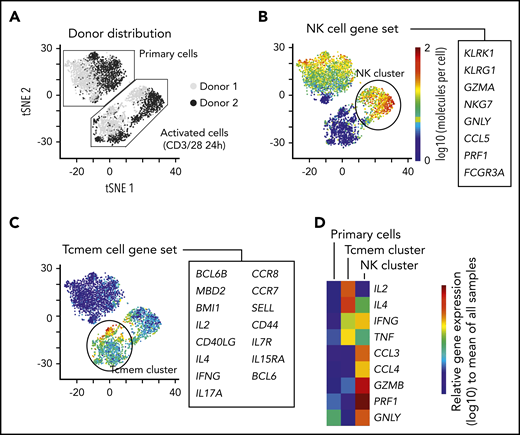
Short-term kinetic assessment of primary iNKT cells with a targeted scRNA-seq approach. (A) Sequencing of 4000 iNKT cells targeting RNA expression of 312 T-cell–associated genes from 2 healthy donors. The cells from each donor were experimentally divided into 2 fractions: primary cells that received no in vitro activation and cells that were activated in vitro with CD3/CD28 Dynabeads overnight. The data have been dimensionally reduced and displayed as a tSNE plot. (B-D) Combined expression of (B) genes associated with an NK-cell phenotype, (C) genes associated with memory T cells (Tcmem), and (D) distribution of gene expression of immunologically relevant effector molecules across the clusters.
Short-term kinetic assessment of primary iNKT cells with a targeted scRNA-seq approach. (A) Sequencing of 4000 iNKT cells targeting RNA expression of 312 T-cell–associated genes from 2 healthy donors. The cells from each donor were experimentally divided into 2 fractions: primary cells that received no in vitro activation and cells that were activated in vitro with CD3/CD28 Dynabeads overnight. The data have been dimensionally reduced and displayed as a tSNE plot. (B-D) Combined expression of (B) genes associated with an NK-cell phenotype, (C) genes associated with memory T cells (Tcmem), and (D) distribution of gene expression of immunologically relevant effector molecules across the clusters.
Moreover, we used bulk messenger RNA (mRNA) sequencing for iNKT cells from healthy donors and from day +30 post-HSCT patients. Among the post-HSCT patients, some had normal immune reconstitution and others would develop GVHD but did not yet have it. Even though GVHD could not yet be detected clinically at this +30-day time point for these patients, the patient groups showed different gene signatures based on CIBERSORT analysis (supplemental Figure 2E).
iNKT cell protein expression in clinical disease
On the basis of our exploratory single-cell expression data and current human iNKT classification, we established high-parametric flow cytometry panels to evaluate iNKT cell phenotypes in healthy individuals in a cohort of post-HSCT patients with and without GVHD and in a cohort of patients with new onset T1D. The most frequently expressed markers in the healthy individual are shown in supplemental Figure 3A.
For the cohort of healthy individuals and HSCT patients, we manually gated on iNKT cell phenotypes and performed principal component analysis (Figure 3A). The healthy individuals distinctly clustered apart from the patients, and the post-HSCT-without-GVHD cluster slightly overlapped with the GVHD cluster. On the basis of driving parameters in the principal component analysis, we focused our analysis on CD94 (the protein name of KLRD1), KLRG1, CD161 (the protein name of KLRB1), and HLA-II expression (Figure 3B). Consistent with our scRNA-seq data, HSCT patients had high proportions of KLRG1+ and CD94+ iNKT cells compared with healthy individuals who had not undergone HSCT (Figure 3C, left). Moreover, HSCT patients at GVHD diagnosis had increased frequencies of HLA-II+ iNKT cells and reduced frequencies of CD161+ iNKT cells (Figure 3C, right). These significant signatures seem to be iNKT specific and do not recapitulate in the CD3+ T-cell compartment (supplemental Figure 3B). To determine whether these iNKT cell phenotypes can be extended to other diseases, we investigated a cohort of patients with new onset T1D (Figure 3D). These T1D patients showed an increased frequency of CD94+ and HLA-II+ iNKT cells and reduced frequency of CD161+ iNKT cells compared with healthy individuals (Figure 3E).
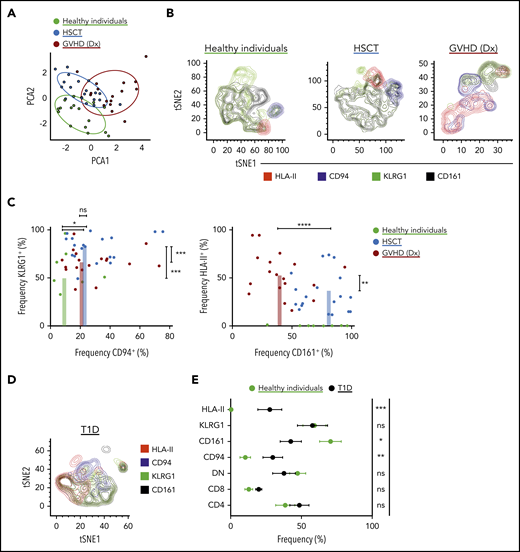
Characterization of iNKT cells in healthy individuals, in patients after receiving allogeneic HSCT, and in T1D patients. (A) iNKT cell phenotypes in peripheral blood were assessed using multiparametric flow cytometry in healthy individuals and in patients after allogeneic HSCT. The markers used for flow cytometry were derived from our scRNA-seq data and from those previously reported in the literature. Subpopulations were manually gated, and principal component analysis (PCA) was performed on the data set. Each dot represents 1 patient and is colored according to that patient’s clinical status. (B) Representative tSNE contour plots in 3 flow cytometric data sets consisting of 3 healthy individuals, 11 patients after HSCT without GVHD, and 3 patients at GVHD diagnosis (Dx). (C) Four parameters were identified from PCA that accounted for most of the variation among the 3 groups, and these parameters were manually assessed and presented in 2D dot plots showing the frequency of expression of each marker in each patient. (D) Representative tSNE contour plots in 1 flow cytometric data set consisting of 3 T1D patients. The parameters here are the same as in panel B. (E) Phenotypic expression of iNKT cells in T1D (n = 11) vs healthy individuals (n = 16). Means ± standard error of the mean (C,E). *P = .05-.01; **P = .009-.001; ***P < .001; ****P < .0001. ns, not significant.
Characterization of iNKT cells in healthy individuals, in patients after receiving allogeneic HSCT, and in T1D patients. (A) iNKT cell phenotypes in peripheral blood were assessed using multiparametric flow cytometry in healthy individuals and in patients after allogeneic HSCT. The markers used for flow cytometry were derived from our scRNA-seq data and from those previously reported in the literature. Subpopulations were manually gated, and principal component analysis (PCA) was performed on the data set. Each dot represents 1 patient and is colored according to that patient’s clinical status. (B) Representative tSNE contour plots in 3 flow cytometric data sets consisting of 3 healthy individuals, 11 patients after HSCT without GVHD, and 3 patients at GVHD diagnosis (Dx). (C) Four parameters were identified from PCA that accounted for most of the variation among the 3 groups, and these parameters were manually assessed and presented in 2D dot plots showing the frequency of expression of each marker in each patient. (D) Representative tSNE contour plots in 1 flow cytometric data set consisting of 3 T1D patients. The parameters here are the same as in panel B. (E) Phenotypic expression of iNKT cells in T1D (n = 11) vs healthy individuals (n = 16). Means ± standard error of the mean (C,E). *P = .05-.01; **P = .009-.001; ***P < .001; ****P < .0001. ns, not significant.
Corticosteroids are the first-line treatment for patients who develop acute GVHD, and some patients are refractory to this treatment. In our cohort of biopsy-confirmed acute GVHD patients at diagnosis who had yet to receive corticosteroids, we examined whether we could delineate those patients who would later be refractory from those who would be responsive to corticosteroid treatment. We found a high proportion of HLA-II+ iNKT cells were associated with patients who would be refractory compared with those who would be responsive to corticosteroids (Figure 4A-B). In addition, in the CD161–HLA-II+ iNKT cell population, patients who would be refractory had increased expression of CXCR3 compared with patients who would respond to corticosteroid treatment (Figure 4C).
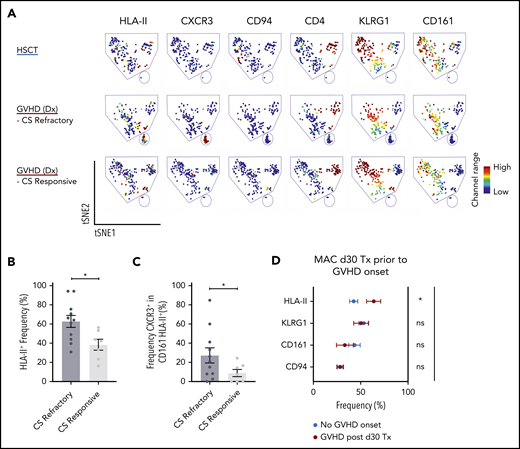
Assessment of iNKT phenotypes that distinguishes treatment responders from nonresponders in acute GVHD patients, and GVHD onset from healthy immune reconstitution in allogeneic HSCT patients. (A) Representative visualization of tSNE (viSNE) plot from patients after HSCT (n = 11) and patients at GVHD diagnosis that later were corticosteroid (CS) responsive (n = 1) or refractory (n = 3). Each column shows the marker expression of a user-defined channel range. The cell number has been normalized to include the same number of cells from each group. (B) Summary of HLA-II expression in iNKT cells (n = 18) at GVHD diagnosis. The patients were retrospectively stratified by corticosteroid response after GVHD diagnosis. (C) Frequency of CXCR3 cells within the CD161HLA-II population in patients at GVHD diagnosis who were retrospectively stratified by corticosteroid response. (D) Phenotypic expression of iNKT cells from 34 patients on day 30 after HSCT with myeloablative conditioning (MAC). The patients analyzed did not display any clinical manifestations of GVHD. After day 30, 10 of the patients would develop GVHD (red) but 24 would not (blue). Tx, Transplantation. Means ± standard error of the mean (B,D). *P = .05-.01. ns, not significant.
Assessment of iNKT phenotypes that distinguishes treatment responders from nonresponders in acute GVHD patients, and GVHD onset from healthy immune reconstitution in allogeneic HSCT patients. (A) Representative visualization of tSNE (viSNE) plot from patients after HSCT (n = 11) and patients at GVHD diagnosis that later were corticosteroid (CS) responsive (n = 1) or refractory (n = 3). Each column shows the marker expression of a user-defined channel range. The cell number has been normalized to include the same number of cells from each group. (B) Summary of HLA-II expression in iNKT cells (n = 18) at GVHD diagnosis. The patients were retrospectively stratified by corticosteroid response after GVHD diagnosis. (C) Frequency of CXCR3 cells within the CD161HLA-II population in patients at GVHD diagnosis who were retrospectively stratified by corticosteroid response. (D) Phenotypic expression of iNKT cells from 34 patients on day 30 after HSCT with myeloablative conditioning (MAC). The patients analyzed did not display any clinical manifestations of GVHD. After day 30, 10 of the patients would develop GVHD (red) but 24 would not (blue). Tx, Transplantation. Means ± standard error of the mean (B,D). *P = .05-.01. ns, not significant.
We next asked whether these markers could classify HSCT patients who do not have clinical features of acute GVHD but would later on acquire acute GVHD and those who would have healthy reconstitution. To address this, we identified a cohort of day +30 post-HSCT patients who had no symptoms of acute GVHD, some of whom would later develop acute GVHD. The patients who would later develop acute GVHD showed a significantly higher frequency of HLA-II+ iNKT cells compared with patients who did not develop acute GVHD (Figure 4D).
Distinction, cytotoxicity, and immunosuppressive capacity of CD94+ iNKT cells
Our scRNA-seq data suggest a cytotoxic cluster of cells. One gene that defined this cluster was KLRD1 (supplemental Figure 1A-B). KLRD1 (CD94) is a killer cell lectin–like receptor that is preferentially expressed on NK cells and interacts with NKG2 molecules.30 Flow cytometric data show that CD94 expression is nearly mutually exclusive with CD4 expression (Figure 5A) but is present in both CD8+ and CD8− iNKT cells (supplemental Figure 3C). To further explore the relationship between CD94 and CD4 expression, we expanded primary CD4+ iNKT cells with IL-2 and CD3/CD28 stimulation and showed that CD94 expression was low, whereas stimulated CD4– iNKT cells upregulated CD94 (Figure 5B).
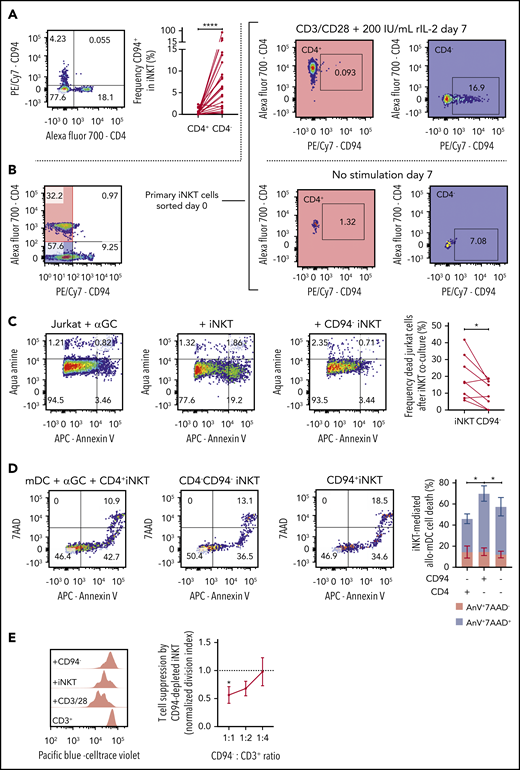
Function of CD94+ iNKT cells. (A) Representative plot of CD4 and CD94 expression in primary iNKT cells (n = 23). (B) Representative plots from experiment showing mutually exclusive expression of CD4 and CD94. Primary iNKT cells were purity sorted by flow cytometry based on the highlighted populations CD4+CD94– and CD4–CD94–. The cells were then cultured for 7 days with or without stimulation with CD3/CD28 Dynabeads and IL-2. Plots on the right show the expression of CD94 gated on the CD4+ and the CD4– population on day 7. (C) Cytotoxicity of iNKT cells. CD1d+ Jurkat cells were incubated with α-galactosylceramide (αGC) overnight (far left). Bulk iNKT cells (left) or CD94-depleted iNKT cells (right) were then added in a 1:1 ratio. CD94-depleted iNKT cells induced significantly less apoptosis in target cells compared with bulk iNKT cells (far right, n = 8). (D) Allogeneic cytotoxicity toward APCs. Allo-myeloid dendritic cells (mDCs) were pulsed with αGC and mixed with iNKT cells sorted by FACS in a 1:1 ratio (n = 6). Cell death was measured using 7-aminoactinomycin D (7AAD) and Annexin V (AnV). The plot (far right) shows frequency of 7AAD+AnnexinV+ mDCs (blue) and 7AAD–AnnexinV+ mDCs (red). CD94+CD4– iNKT cells induced significantly more mDC death than CD94–CD4– and CD94–CD4+ iNKT cells. (E) Immune regulatory function of CD94+ iNKT cells. Purified CD3+ T cells were stimulated with CD3/CD28 Dynabeads for 72 hours. Addition of CD94-depleted iNKT cells in a dose-dependent manner decreased the proliferation of the T cells (n = 6). Means ± standard error of the mean (A,C-E).*P = .05-.01; ****P < .0001.
Function of CD94+ iNKT cells. (A) Representative plot of CD4 and CD94 expression in primary iNKT cells (n = 23). (B) Representative plots from experiment showing mutually exclusive expression of CD4 and CD94. Primary iNKT cells were purity sorted by flow cytometry based on the highlighted populations CD4+CD94– and CD4–CD94–. The cells were then cultured for 7 days with or without stimulation with CD3/CD28 Dynabeads and IL-2. Plots on the right show the expression of CD94 gated on the CD4+ and the CD4– population on day 7. (C) Cytotoxicity of iNKT cells. CD1d+ Jurkat cells were incubated with α-galactosylceramide (αGC) overnight (far left). Bulk iNKT cells (left) or CD94-depleted iNKT cells (right) were then added in a 1:1 ratio. CD94-depleted iNKT cells induced significantly less apoptosis in target cells compared with bulk iNKT cells (far right, n = 8). (D) Allogeneic cytotoxicity toward APCs. Allo-myeloid dendritic cells (mDCs) were pulsed with αGC and mixed with iNKT cells sorted by FACS in a 1:1 ratio (n = 6). Cell death was measured using 7-aminoactinomycin D (7AAD) and Annexin V (AnV). The plot (far right) shows frequency of 7AAD+AnnexinV+ mDCs (blue) and 7AAD–AnnexinV+ mDCs (red). CD94+CD4– iNKT cells induced significantly more mDC death than CD94–CD4– and CD94–CD4+ iNKT cells. (E) Immune regulatory function of CD94+ iNKT cells. Purified CD3+ T cells were stimulated with CD3/CD28 Dynabeads for 72 hours. Addition of CD94-depleted iNKT cells in a dose-dependent manner decreased the proliferation of the T cells (n = 6). Means ± standard error of the mean (A,C-E).*P = .05-.01; ****P < .0001.
To functionally test whether CD94+ iNKT cells promote cytotoxicity, we compared the ability of CD94-depleted vs bulk iNKT cells to induce apoptosis in a leukemic cell line loaded with αGalCer. CD94-depleted iNKT cells were less cytotoxic compared with iNKT cells that contained CD94+ cells (Figure 5C).
Recently, Coman and colleagues19 showed that CD4– iNKT cells had increased cytotoxicity compared with CD4+ iNKT cells. Because CD94 expression in our data is found only in CD4– iNKT cells and is equally distributed in CD8+/− iNKT cells, we asked whether the cytotoxic function observed in CD4– iNKT cells was due to the CD94+ iNKT cells. In an additional killing assay, we sorted CD4–CD94+, CD4+CD94–, and CD4–CD94– iNKT cells and cultured them separately for 24 hours with human myeloid DCs (mDCs) pulsed with 1 μM αGalCer. We observed that CD4–CD94+ iNKT cells promoted a higher mDC death compared with the other 2 populations (Figure 5D). In addition, this CD94+ iNKT-mediated cytotoxicity seems to be CD1d and αGalCer dependent (supplemental Figure 3D). Cytotoxic factors granzyme B (GZMB), perforin, and granulysin were increased in CD94+ iNKT cells (supplemental Figure 3E-G).
The ability of iNKT cells to suppress T-cell proliferation in vitro15 was thought to occur by a balance of pro- and anti-inflammatory subset phenotypes. To assess whether the CD94+ phenotype is more pro-inflammatory or anti-inflammatory, we set up a suppression assay with iNKT cells plated at various ratios to T cells to examine dose-dependent suppression of T-cell proliferation. When we depleted CD94+ iNKT cells from the population, we found that iNKT-mediated suppression increased significantly (Figure 5E).
Phenotype and function associated with primary iNKT cells
We asked how the data-driven discovered markers and markers in the conventional iNKT paradigm associate with function in primary iNKT cells. Primary iNKT cells had low expression of HLA-II (supplemental Figure 3A). iNKT cells had a high PLZF expression compared with CD3+ T cells (supplemental Figure 3B). In line with previous studies,8 we show that CD4+ iNKT cells are the predominant IL-4 producer (supplemental Figure 3G), but they also have a mixed IFN-γ, TNF-α, and GZMB expression. CD4+ iNKTs also express GATA3 (supplemental Figure 3G). Although CD8 and DN subsets had more IFN-γ and TNF-α compared with CD4+ cells, high IFN-γ and TNF-α and poor expression of IL-4 were significantly associated with KLRG1 expression (supplemental Figure 3G-H). KLRG1 is an inhibitory molecule31 with high expression in many lymphocytes. Interestingly, KLRG1 expression is present in both CD4+ and CD4– iNKTs (supplemental Figure 3A). KLRG1+ iNKT cells also express TBET and RORC (supplemental Figure 3G).
The impact of activation on iNKT cell phenotype and function
iNKT cell phenotypes detected in our clinical cohorts are either rare or not seen in iNKT cells derived from normal healthy donors (supplemental Figure 3A). We hypothesized that the iNKT cell phenotype seen with clinical disease might be recapitulated by in vitro activation of primary iNKT cells from normal healthy donors.
HLA-II+ and CD161– iNKT cells did appear with prolonged TCR stimulation in vitro (Figure 6A; supplemental Figure 4A-B). Moreover, we show that the expression of HLA-II and CD161 varies significantly with iNKT ligand affinity (Figure 6A), but only the HLA-II expression varied significantly with the ratio of stimulating ligands (Figure 6B) and concentration of IL-2 (Figure 6C). Importantly, HLA-II+ iNKT cells were most abundant in the setting of high TCR activation and IL-2 availability, an in vitro representation of the high degree of inflammation found in the GVHD environment. The expression of other markers showed potential dependency on the stimulating ligand used, suggesting how lipid presentation and cytokines may influence iNKT cell phenotype and function (supplemental Figure 4A,J). In line with the literature, our data associate KLRG1 with effector cells and CXCR4 as naïve or exhausted32 (supplemental Figure 4H).
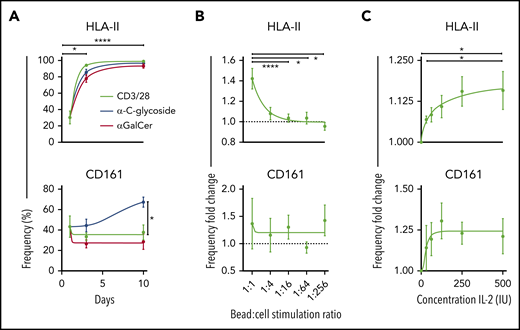
Kinetics of chronically activated iNKT cells. (A) Surface expression of HLA-II (top) and CD161 (bottom) measured on days 0, 3, and 10 after activation with 3 different stimuli (n = 12). (B) Expression frequency fold change of HLA-II (top) and CD161 (bottom) using reducing ratios of stimulation of iNKT cells with CD3/CD28 Dynabeads and 100 IU IL-2 for 3 days (n = 13). Data are normalized against a condition with no CD3/CD28 Dynabeads added. (C) Expression frequency fold change of HLA-II (top) and CD161 (bottom) with 1:10 CD3/CD28 Dynabeads:iNKT stimulation and increasing concentrations of IL-2 for 3 days. Data are normalized against a condition with no IL-2 added (n = 6). Means ± standard error of the mean (A-C). *P = .05-.01; ****P < .0001.
Kinetics of chronically activated iNKT cells. (A) Surface expression of HLA-II (top) and CD161 (bottom) measured on days 0, 3, and 10 after activation with 3 different stimuli (n = 12). (B) Expression frequency fold change of HLA-II (top) and CD161 (bottom) using reducing ratios of stimulation of iNKT cells with CD3/CD28 Dynabeads and 100 IU IL-2 for 3 days (n = 13). Data are normalized against a condition with no CD3/CD28 Dynabeads added. (C) Expression frequency fold change of HLA-II (top) and CD161 (bottom) with 1:10 CD3/CD28 Dynabeads:iNKT stimulation and increasing concentrations of IL-2 for 3 days. Data are normalized against a condition with no IL-2 added (n = 6). Means ± standard error of the mean (A-C). *P = .05-.01; ****P < .0001.
In addition, we stimulated iNKT cells for 10 days in vitro and then determined expression for IFN-γ and IL-4. We found that HLA-II+ iNKT cells had significantly higher IFN-γ and IL-4 expression compared with HLA-II–/lo iNKTs (supplemental Figure 4I). Taking into account CD161 expression, HLA-II+CD161– iNKTs have a significantly higher ratio of IFN-γ:IL-4 expression compared with the other combinations of CD161- and HLA-II–expressing iNKT cells (Figure 7A). Likewise, HLA-II+ iNKT cells had significantly higher expression of cytotoxic markers, but HLA-II+CD161– iNKT cells expressed less than HLA-II+CD161+ iNKT cells. In an evaluation of exhaustion, we found that HLA-II+ iNKT cells showed increased TIM-3 and PD-1 expression; however, NKG2D is preferentially elevated with CD161+ iNKT cells (Figure 7C; supplemental Figure 4K).

Intracellular expression of cytotoxic effector molecules and expression of exhaustion markers in chronically activated iNKT cells. (A) Representative histograms of IFN-γ or IL-4 expression based on CD161 and HLA-II expression (left) and a summary of the ratio of the frequency of IFN-γ to IL-4–positive cells based on CD161 and HLA-II expression (right; n = 7). (B) Mean fluorescence intensity of expression of perforin (Per), granzyme B (Gzm B), and granulysin based on CD161 and HLA-II expression in in vitro expanded iNKT cells (n = 7). (C) Frequency of expression of Tim-3, PD-1, and NKG2D based on CD161 and HLA-II expression in in vitro expanded iNKT cells (n = 7). Means ± standard error of the mean (A-C). *P = .05-.01; **P = .009-.001; ****P < .0001.
Intracellular expression of cytotoxic effector molecules and expression of exhaustion markers in chronically activated iNKT cells. (A) Representative histograms of IFN-γ or IL-4 expression based on CD161 and HLA-II expression (left) and a summary of the ratio of the frequency of IFN-γ to IL-4–positive cells based on CD161 and HLA-II expression (right; n = 7). (B) Mean fluorescence intensity of expression of perforin (Per), granzyme B (Gzm B), and granulysin based on CD161 and HLA-II expression in in vitro expanded iNKT cells (n = 7). (C) Frequency of expression of Tim-3, PD-1, and NKG2D based on CD161 and HLA-II expression in in vitro expanded iNKT cells (n = 7). Means ± standard error of the mean (A-C). *P = .05-.01; **P = .009-.001; ****P < .0001.
In summary, an in vitro FACS evaluation of primary iNKT cells is consistent with what our scRNA-seq showed. HLA-II+CD161– iNKT cells, which are also detected in GVHD and T1D, showed aspects of exhaustion with the continued capability to produce cytokines at a high IFN-γ:IL-4 ratio, consistent with a Th1-skewed cytokine profile.
Discussion
In this study, we present a high-parametric, data-driven exploration of human iNKT heterogeneity in the clinical context of allogeneic HSCT and in new-onset autoimmune T1D. Our data suggest a phenotypic framework that expands understanding of human iNKT biology. A major finding of this study is that there is an increase in HLA-II+CD161– iNKT cells associated with the development and increased severity of acute GVHD. An evaluation of this population ex vivo and in vitro shows that it is capable of driving persistent Th1 inflammation. We also explored the same iNKT populations in T1D and observed a similar increase in patients with new-onset disease.
Our data suggest that iNKT cells are better described as T-cell–like and NK-like, and this pattern is more evident with activation. Although CD4 correlates with the capacity to make IL-4, KLRG1 and CD94 expression better defined Th1 and cytotoxic subsets, respectively, than the classically used CD8 and DN. KLRG1 was expressed in both CD4+ and CD4– cells and was closely associated with the capacity for cells to make Th1 cytokines although not to the exclusion of also making IL-4 if the iNKT cells are CD4+. CD94 was expressed only in CD4– cells and was closely associated with enhanced cytotoxicity and a lack of IL-4 production. In our study, CD94 does not seem to be expressed by CD4+ iNKT cells even after in vitro activation, suggesting that CD94 expression may be developmentally fixed in CD4– iNKT cells. Moreover, CD94+ iNKT cells were associated with allogeneic HSCT and T1D status in humans whereas evaluation of CD8 or DN status showed no association (Figure 3E).
Identifying human iNKT cell phenotypes that better associate with the capacity to make Th1 cytokines and exert cytotoxicity is likely a helpful step forward in understanding how human iNKT cells contribute to diseases such as GVHD. The production of IL-4 has been associated with immunoregulatory functions of mouse iNKT cells and suppressing GVHD after allogeneic HSCT.18,33,34 We found that CD161 expression was increased on iNKT cells in HSCT patients with normal immune reconstitution. Even though CD161 was previously shown to be associated with enhanced Th135 cytokine production, we found Th2 cytokines to be augmented, suggesting how this phenotype could be associated with normal reconstitution after HSCT.
In contrast, the newly defined HLA-II+CD161– iNKT phenotype associated with GVHD and T1D showed exhaustion and has skewed IFN-γ production and decreased expression of cytotoxic factors. This population can be CD4+ or CD4– and is not present in healthy individuals. We found that with strong, chronic in vitro activation, iNKT cells upregulate HLA-II and downregulate CD161 expression (Figure 6A-C). Interestingly, the use of a weaker stimulating ligand (a-C-glycoside) resulted in an upregulation of CD161 even though we did not see any significant differences in CD161 expression with respect to the ratio of CD3/CD28 beads and IL-2 used to stimulate iNKT cells (Figure 6A-C). Together, these results could potentially explain why we see increased HLA-II and reduced CD161 expression in our GVHD patients, because this disease is characterized by a persistent inflammatory state and possibly even a different profile of glycolipids that strongly mediates an immune response.
Studies point toward 2 pathways of regulating acute GVHD: the first in which IL-4 and peripheral tolerance pathways can control expansion15 and the second in which CD4– iNKT cells attack and destroy recipient antigen-presenting cells to control alloreactivity.19 Our data show that healthy immune reconstitution without GVHD correlates with CD161, which maintains IL-4 production. However, we also see that an enrichment for cytotoxic CD94+ cells is present with healthy reconstitution. Thus, our data would support both potential mechanisms that could be working to regulate HSCT. What is conceptually novel and important is that the appearance of a more Th1 polarized but less cytotoxic iNKT phenotype (HLA-II+CD161–) clearly associates with a dysregulated immune state and that the proportion of these cells specifically correlates with GVHD. This reveals a new immunologic state of iNKT cells that provides a correlative science end point and organizational framework for developing strategies to understand how these cells arise, how they contribute to GVHD, and how to avoid them.
In T1D, Th1 skewing of iNKT cells has been observed, but studies to date show conflicting results.10-13,17 Our investigation provides some insight on these discrepancies. In line with the study by Wilson et al,10 we show that HLA-II+ iNKT cells with elevated IFN-γ expression are associated with T1D patients. In addition, cytotoxic CD94+ iNKT cells are increased during the onset of T1D. Although it is unclear whether iNKTs contribute to the pathophysiology of T1D, we have found biomarkers on iNKT cells that are potentially sensitive for discriminating immune activity in the disease.
Because our approach aimed toward elucidating dominant iNKT cell functions in our patient groups, the low number of patients in our study warrants further investigations to elucidate the role of iNKT cells in clinical settings. Our exploratory sequencing approach and low cell number in clinical samples did not provide enough depth to identify rare iNKT gene signatures, including human iNKT cells reported to produce IL-107 and IL-17.36
In summary, we provide information on clinically relevant iNKT cell phenotypes and function, and we identify iNKT cell phenotypes associated with allo- and autoimmunity. This suggests that iNKT profiling could help clarify immune disease status or severity and has implications for therapeutic strategies targeting and/or using iNKT cells as cellular therapy in allogeneic HSCT and other diseases such as T1D.
The publication costs of this article were defrayed in part by page charge payment. Therefore, and solely to indicate this fact, this article is hereby marked “advertisement” in accordance with 18 USC section 1734.
For original data and sharing of R markdown files, please contact Tom Erkers (tom.erkers@ki.se) or Brian J. Xie (bryanxie@stanford.edu). Sequencing data are available on NCBI Sequence Read Archive, Accession: PRJNA563899, PRJNA565590.
The online version of this article contains a data supplement.
Acknowledgments
The authors thank the staff and patients at the Bone Marrow Transplantation and outpatient wards at Stanford University Hospital for kindly providing samples for this study, and the Ash Alizadeh Laboratory for providing bulk sequencing data on iNKT cells in healthy individuals.
This study was supported by National Institutes of Health (NIH) National Human Genome Research Institute Award K08HL119590 (E.H.M.), NIH National Institute of Diabetes and Digestive and Kidney Diseases Award 116074 through the Stanford Diabetes Research Center P30 pilot grant program and Stanford Diabetes Immune Monitoring core, the Swedish Society of Medicine (Grant SLS-684091) (T.E.), and Stanford Translational Research and Applied Medicine Pilot Grant Award. Core facility instruments used at the Stanford Human Immune Monitoring Center were supported by NIH Office of the Director Grant S10OD018220.
Cell sorting and/or flow cytometry analysis was performed on instruments in the Stanford Shared FACS facility, the Stanford Human Immune Monitoring Center, the Stanford BMT Cellular Therapy Facility, and the Judy Shizuru laboratory.
Authorship
Contribution: T.E., E.H.M., and B.J.X. conceived the study and performed formal analysis, project administration, validation, and visualization; T.E., E.H.M., B.J.X., L.J.K., and B.S. curated the data; E.H.M., T.E., R.S.N., H.T.M., and S.S. acquired funding; T.E., B.J.X., L.J.K., B.S., and M.R. conducted the investigation; T.E., E.H.M., B.J.X., K.P.J., and L.J.K. created the methodology; E.H.M., K.P.J., X.J., M.B., S.S., R.S.N., H.T.M., and T.E. provided resources; B.J.X. and T.E. provided the software for analysis; E.H.M., T.E., R.S.N., and S.S. supervised the study; T.E. and E.H.M. wrote the original draft of the article; and T.E., E.H.M., B.J.X., H.T.M., and R.S.N. wrote, reviewed, and edited the final draft of the article.
Conflict-of-interest disclosure: The authors declare no competing financial interests.
Correspondence: Everett H. Meyer, Stanford University, CCSR, Room 2245c, 269 W. Campus Dr, Stanford, CA 94305; e-mail: evmeyer@stanford.edu; and Tom Erkers, Science for Life Laboratory, Tomtebodavagen 23b, 17165 Solna, Sweden; e-mail: tom.erkers@ki.se.

This feature is available to Subscribers Only
Sign In or Create an Account Close Modal