

Key Points
Identification of novel molecular regulators of HSC-niche interactions.
Provision of database to determine molecular interactions between any cell populations of mouse and human origin.

Abstract
A major limitation preventing in vivo modulation of hematopoietic stem cells (HSCs) is the incomplete understanding of the cellular and molecular support of the microenvironment in regulating HSC fate decisions. Consequently, murine HSCs cannot be generated, maintained, or expanded in culture over extended periods of time. A significantly improved understanding of the bone marrow niche environment and its molecular interactions with HSCs is pivotal to overcoming this challenge. We here prospectively isolated all major nonhematopoietic cellular niche components and cross-correlate them in detail with niche cells defined by lineage marking or tracing. Compiling an extensive database of soluble and membrane-bound ligand-receptor interactions, we developed a computational method to infer potential cell-to-cell interactions based on transcriptome data of sorter-purified niche cells and hematopoietic stem and progenitor cell subpopulations. Thus, we establish a compendium of the molecular communication between defined niche components and HSCs. Our analysis suggests an important role for cytokine antagonists in the regulation of HSC functions.
Introduction
Hematopoietic stem cells (HSCs) are currently the only adult stem cell type that is routinely used in the clinic, and HSC transplantation remains the only cure for numerous hematological disorders.1 However, our understanding of how the function of HSCs is maintained under physiological conditions is limited. As a consequence, it has proven to be difficult to expand HSCs in vitro or in vivo,2,-4 and, as a result, the number of histocompatible donor HSCs is often limiting for successful HSC transplantation. In vitro culture of HSCs induces their differentiation, implying that incompletely understood cell-extrinsic cues are required to preserve stem cell identity. In particular, it is thought that HSC function is supported by molecular cross talk with the specialized microenvironment in the bone marrow (BM), the stem cell niche (reviewed in Kumar and Geiger,4 Karamitros et al,5 Crane et al,6 and Yu and Scadden7 ). Currently, we cannot recapitulate the complex niche structures outside of the organism because the precise cellular components of niche structures, their individual numerical contribution, and the molecular signals emanating from distinct niche cells remain incompletely defined.
A number of cell types have been suggested to contribute to the HSC niche. Based on elegant in vivo depletion or expansion experiments and imaging-based approaches, it has been suggested that osteoblasts,8,9 osteoclasts10,11 and other phagocytic cells,12,-14 megakaryocytes,15,-17 arteriole and sinusoidal endothelial cells,18,,-21 nonmyelinating Schwann cells,22 sympathetic neuronal cells,23,24 as well as Nestin+ mesenchymal stromal cells (MSCs)25,26 and cell types with partially overlapping functional properties, like the CXCL12-abundant reticular cells25 and Lepr-cre+ perivascular cells,18 contribute to the HSC niche space in vivo. Targeting molecular regulators in these specific niche cell types results in reduced HSC maintenance or even stem cell attrition. Thus, HSC function appears to be regulated by a complex interplay between several hematopoietic and different nonhematopoietic cell types, but the phenotypic and functional cross-correlation between niche cells and HSCs is largely not known. Most of the nonhematopoietic cellular components of the BM niche are currently defined by genetic lineage-marking or lineage-tracing approaches using reporter mouse lines. However, the precise expression pattern of the specific promoters and the cross-correlation to cell types identified by cell surface markers remains unknown, preventing comprehensive niche analysis in mice that lack the corresponding genetic marking.
Niche cell-type–specific ablation of molecular regulators of HSC function has revealed a strong specificity of the molecular interaction between cell types of the microenvironment and the stem cells in the BM.6,27 However, comparative analysis of niche cells identified by cell surface markers or by lineage-tracing approaches, and information on the molecular nature of their communication with hematopoietic stem and progenitor cells (HSPCs), has been limited. Here, we use various Cre drivers and cell surface marking to dissect the nonhematopoietic cellular components of the HSC niche isolated from the marrow and the bone-associated fraction, the endosteum. We then match the transcriptomes of specific purified niche cell subpopulations and HSPCs28,29 to robustly infer the global landscape of molecular interactions in the HSC niche. By this analysis, we defined potential novel molecular regulators of HSC function and hematopoiesis.
Methods
Mice
The following mice were bred and maintained under specific pathogen-free conditions in the animal facility at the Medical Theoretical Center of the University of Technology (TU) Dresden: C57BL/6J (B6), B6.129X1-Gt(ROSA)26Sortm1(EYFP)Cos/J (R26.eYFP30 ), C57BL/6-Gt(ROSA)26Sortm1(HBEGF)Awai/J (R26.iDTR31 ), B6.129(Cg)-Leprtm2(cre)Rck/J (Lepr-cre32 ), B6.Cg-Tg(Prrx1-cre)1Cjt/J (Prx1-cre,33 Osx1-GFP::Cre; B6.Cg-Tg(Sp7-tTA,tetO-EGFP/cre)1Amc/J (Osx-cre34 ) (all purchased from The Jackson Laboratory); ROSA-tdRFP (R26.tdRFP35 ) mice provided by Hans-Jörg Fehling (Ulm University, Ulm, Germany); Nestin-GFP (Nes-GFP36 ) mice provided by Gregori Enikolopov (Cold Spring Harbor Laboratory, Cold Spring Harbor, NY); B6.FVB-Tg(Cdh5-cre)7Mlia/J (VE-Cadherin-cre37 ) mice provided by Luisa Iruela-Arispe (University of California Los Angeles, Los Angeles, CA); and Cxcl12tm2.1Sjm/J (Cxcl12-DsRed38 ) mice provided by Sean Morrison (The University of Texas Southwestern Medical Center, Dallas, TX). Nes-GFP and Cxcl12-DsRed mice were directly used to examine fluorescence expression within the BM niche. To obtain fluorescence reporter mice for Prx1-cre−, Lepr-cre−, Osx-cre−, and VE-Cadherin-cre mice were backcrossed to homozygous R26.tdRFP or R26.eYFP mice to generate Osx-cre+;tdRFPki/wt, Prx1-cre+;tdRFPki/wt, or Lepr-cre+;tdRFPki/wt or tdRFPki/ki and VE-cadh-cre+;eYFPki/wt mice. For the generation of diphtheria toxin (DT)–sensitive mice, Lepr-cre mice were crossed with R26.iDTR mice. All depletion experiments were performed with mice heterozygous for the R26.iDTR allele (Lepr-cre+;iDTRwt/ki). All animal experiments were performed in accordance with German animal welfare legislation and were approved by the relevant authorities (Landesdirektion Dresden).
DT
Seven- to 26-week-old Lepr-cre+;iDTRwt/ki, Lepr-cre+;iDTRwtwt, or Lepr-cre-;iDTRwt/ki mice were injected for 3 consecutive days IV with 0.5 μg of unnicked DT from Corynebacterium diphtheria (List Biological Laboratories) diluted in sterile phosphate-buffered saline (PBS). On day 4, niche cell depletion was analyzed by flow cytometry.
Isolation of niche cells
Femurs and tibias were flushed with 4 mL of PBS/5% fetal calf serum (FCS) using a 23G needle. Cell suspension was filtered through a 100-μm mesh. Subsequently, bones were briefly crushed in 2 mL of PBS/5% FCS and cut into small pieces. The retained cell suspension was filtered through a 100-μm mesh and was combined with the flushed cell fraction to obtain the central BM = “marrow fraction.” Compact bone pieces were collected in a 2-mL centrifuge tube and further processed to receive the “endosteal cell fraction.” After red blood cell lysis (ACK lysing buffer; Gibco), the marrow fraction was incubated with 1 mL of collagenase type I solution (3 mg/mL collagenase type I [Worthington] in Dulbecco's modified Eagle medium [DMEM] with 10% FCS and 500 μg/mL DNAseI [Sigma]) for 45 minutes at 37°C at continuous mild shaking (20 rpm). In parallel, bone pieces were incubated in 1 mL of collagenase type I solution (as described in this section) for 1 hour at 37°C with harsh shaking at 1400 rpm. After digestion was stopped with 10 mL of PBS/5% FCS, the suspensions were filtered through 100-μm meshes to remove cell clumps and bone pieces and further processed.
Flow cytometry
Hematopoietic and niche cells were stained for 40 minutes on ice as described previously.39,40 Antibody details are provided in supplemental Table 1 (available on the Blood Web site). Shortly before acquisition, CountBright absolute counting beads were added to each sample to quantify the cells. Prior to the sort of all niche cells, lineage-positive (CD45, Terr119, CD3, CD4, CD8, Gr1) were labeled with fluorescein isothiocyanate–conjugated antibodies and depleted using anti–fluorescein isothiocyanate microbeads (Miltenyi Biotec). Samples were acquired and sorted using an LSRII and AriaII cytometer (BD) and data were analyzed using FlowJo software (TreeStar).
In vitro differentiation
Two thousand (osteoblastic progenitors [OPs]) to 10 000 (MSCs and Endos) cells were plated in MesenCult medium in 96- and 24-well plates, respectively, and expanded for 23 to 28 days. After expansion, lineage differentiation protocols were conducted. For osteogenic differentiation, 2 × 10⁴ to 5 × 10⁴ cells per cm2 were plated in each well of a 6-well plate and cultivated in osteogenic differentiation medium (DMEM-low glucose, 10% FCS, 300 μM ascorbic acid, 10−8 M dexamethasone, 10 mM β-glycerophosphate). One-half of the medium was exchanged every second or third day. After 21 days, cells were washed with PBS and fixed with methanol for 10 minutes at −20°C. To stain for calcification of the extracellular matrix, cells were incubated for 10 minutes with 2% (wt/vol) Alizarin Red solution in PBS at pH 4.3, followed by washing with water and drying in air. Adipogenic differentiation was induced by adding adipogenic differentiation medium (DMEM-low glucose, 10% FCS, 10−7 M dexamethasone, 5 μg/mL insulin, 5 µg/mL troglitazone) to cells of 70% to 90% of confluency in 6-well plates. During the culture period of 16 days, one-half of the medium was replaced every third to fourth day. Before staining, cells were washed with PBS and fixed with 4% paraformaldehyde for 15 to 30 minutes at room temperature. Cell-type identity was determined by staining for the accumulation of lipid vesicles using an Oil Red staining. Briefly, cells were washed with 60% isopropanol and stained with freshly prepared filtered (0.22 μm) Oil Red solution (0.3% stock solution of Oil Red in isopropanol mixed 3:2 with water) for 5 minutes, followed by extensive washing with water.
Colony growth
Single lineage-negative (lineage = CD3 CD19 NK1.1 Ter119 CD11b CD11c Gr-1 B220) Kit+Sca-1+ cells were sorted into individual wells of a 96-well U-bottom plate containing 50 μL of Iscove modified Dulbecco medium supplemented with 20% FCS, recombinant murine (rm) stem cell factor (SCF; 50 ng/mL), rm interleukin 3 (IL3; 10 ng/mL), rmIL6 (10 ng/mL), and putative molecular regulators: recombinant human (rh) bone morphogenetic protein 6 (BMP6; 200 ng/mL), rh insulin-like growth factor binding protein 4 (IGF-BP4; 500 ng/mL), rmVCAM1 (500 ng/mL), rmCXCL12 (200 ng/mL), rh E-selectin (E-SEL; 500 ng/mL), rhPECAM1 (500 ng/mL), rh epidermal growth factor–like domain-containing protein 7 (EGF-L7; 200 ng/mL), rm endothelial cell-specific molecule 1 (ESM1; 500 ng/mL), rmCXCL14 (500 ng/mL), rmBMP4 (200 ng/mL), and mouse laminin (1000 ng/mL). On day 8, colonies were counted and size and type were determined by flow cytometry. A minimum of 92 cells were analyzed per condition and experiment. Colony width was measured using photographs of individual colonies and ImageJ software.
RNA sequencing
Next-generation sequencing was performed by the Deep Sequencing Group, Biotechnology Center, TU Dresden. Briefly, complete complementary DNA (cDNA) was synthesized from messenger RNA (mRNA) of sorter-purified HSCs or niche cells (minimum 1000 cells per sample) using the SMARTer Ultra HV kit (Clontech), followed by an amplification of the purified cDNA with Advantage 2 DNA Polymerase (12 cycles; Clontech). After ultrasonic shearing of the amplified cDNA (Covaris S2 ultrasonicator) and treatment with S1 nuclease, samples were subjected to standard Illumina fragment library preparation using indexed adaptors (NEBNext chemicals; New England Biolabs). Sequencing was conducted on the Illumina NextSeq 500 platform, resulting in 75 million to 90 million 75-bp single-end reads per sample. GSNAP (version 2014-12-17) and the gene annotation of Ensembl version 78 were used to align the reads against the mouse reference mm10.
Bioinformatic analysis
RNA-sequencing (RNA-seq) data from the following samples were analyzed: endothelial cells from BM plus bone; PαS cells from bone; MSCs fromBM plus bone. As shown in supplemental Figure 6, MSCs from the BM and MSCs from the bone niche compartments were analyzed separately. The analysis of the RNA-seq data was performed with R software v3.3.2. Read count was performed using GenomicAlignments package v3.2.3, with mouse annotation GRCm38.81 and read counts were normalized with the regularized log2 transformation (rlog) implemented in the R package Deseq2. Transcriptome data sets were corrected for batch effects and principal component analysis (PCA) was computed using FactoMineR package v 3.3.2. For Figure 4 and supplemental Figure 4, the batch effect between niche cell samples was corrected with the ComBat algorithm implemented in the R package SVA. Hierarchical clusterings based on Euclidian distance were performed with the hclust function implemented in R. Heatmap was generated with the rlog-transformed read counts using the Pheatmap package of R. A detailed description of the interaction score method is available in supplemental Document 4. Networks displayed in Figure 6 were created with cytoscape v3.4.0 software.
Statistics
The Student unpaired t test was performed to calculate the statistical significance between individual groups with expected normal distribution (significance: *P < .0332; **P < .0021; ***P < .002; ****P < .0001). Prism 7 software (GraphPad) was used to perform statistical analysis. If not indicated differently, mean and standard deviation is shown in graphs.
Results
Identification of nonhematopoietic niche cells
To isolate nonhematopoietic BM and bone-lining niche cells, bones were flushed and crushed to retrieve the marrow fraction and bone splinters, respectively, and both fractions were subsequently digested to recover niche cells (Figure 1A scheme). Cells were identified by flow cytometry using the marrow (Figure 1B) and bone fractions (Figure 1C): within nonhematopoietic cells (CD45−Ter119−Lin−), CD31hiCD144+ arteriolar endothelial cells were analyzed and CD31−CD144−CD51+ cells further resolved for the expression of platelet-derived growth factor receptor (Pdgfrα) and stem cells antigen-1 (Sca1). Within this fraction, Pdgfrα+Sca1− MSCs, CD31−CD51+Pdgfrα+Sca1+ PαS cells,41 and CD31−CD51+ Pdgfrα−Sca1− OPs were identified. We separately analyzed the digested and flushed marrow fraction and the digested bone fraction containing endosteal cells. The most abundant populations within the marrow were MSCs and OPs followed by endothelial cells (Figure 1D). All isolated CD31hi endothelial cells expressed both CD144 and Sca1 (supplemental Figure 1A-B), and these surface markers were interchangeable for the identification of the same cell population (supplemental Figure 1C). PαS cells were of low abundance and almost exclusively present in the bone fraction. Based on this location specificity, we maintained the name as assigned previously.41 In contrast to the marrow fraction, bone niche cells contained similar frequencies and numbers of endothelial cells, MSCs, PαS, and OPs (Figure 1D-E). Plotting the relative distribution of each niche cell type to marrow and bone fractions confirmed that PαS cells were mainly found in the bone fraction, whereas the majority of MSCs were located within the marrow fraction (Figure 1F). Nonhematopoietic niche cells in the marrow are therefore subdivided into at least 3 populations, whereas the bone niche is resolved into 4 fractions.
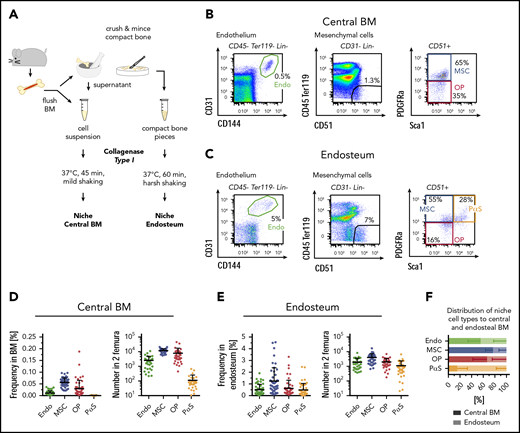
Isolation and identification of BM and endosteal nonhematopoietic niche cells. (A) Scheme of niche cell isolation. BM and bone pieces are treated with collagenase type I to disintegrate tissues. (B-C) Identification of nonhematopoietic niche cells in the marrow fraction (B) and in the endosteum (C) by flow cytometry. Samples were gated on size, singlets, and viable cells (Dapi−). Lin = CD3, CD4, CD8, Gr1, CD11b. (D-E) Frequency (left; n = 47; 29 experiments) and absolute numbers (right; n = 33; 21 experiments) of marrow (D) and endosteal (E) niche cells in C57BL/6J wild-type mice. Absolute numbers for BM: Endo = 2506 ± 2315; MSC = 11 811 ± 3956; OP = 7791 ± 9386; PαS = 113 ± 141. Absolute numbers for bone: Endo = 1867 ± 1688; MSC = 3951 ± 3206; OP = 1944 ± 1419; PαS = 1086 ± 1249. (F) Distribution of niche cell types between the marrow fraction (shaded) and endosteum (bright colors). Calculations are based on absolute cell numbers; n = 50, 30 experiments. Endo, endothelial cells.
Isolation and identification of BM and endosteal nonhematopoietic niche cells. (A) Scheme of niche cell isolation. BM and bone pieces are treated with collagenase type I to disintegrate tissues. (B-C) Identification of nonhematopoietic niche cells in the marrow fraction (B) and in the endosteum (C) by flow cytometry. Samples were gated on size, singlets, and viable cells (Dapi−). Lin = CD3, CD4, CD8, Gr1, CD11b. (D-E) Frequency (left; n = 47; 29 experiments) and absolute numbers (right; n = 33; 21 experiments) of marrow (D) and endosteal (E) niche cells in C57BL/6J wild-type mice. Absolute numbers for BM: Endo = 2506 ± 2315; MSC = 11 811 ± 3956; OP = 7791 ± 9386; PαS = 113 ± 141. Absolute numbers for bone: Endo = 1867 ± 1688; MSC = 3951 ± 3206; OP = 1944 ± 1419; PαS = 1086 ± 1249. (F) Distribution of niche cell types between the marrow fraction (shaded) and endosteum (bright colors). Calculations are based on absolute cell numbers; n = 50, 30 experiments. Endo, endothelial cells.
Cross-correlating nonhematopoietic niche cell types identified by cell surface staining with niche cells identified by genetic lineage marking or tracing
To investigate the specificity of niche cell targeting using genetic mouse tools, the populations identified by commonly used lineage-marking mice were compared with the labeling of niche cell types by cell surface marker staining. All reporter-positive BM or bone niche cells (supplemental Figure 2) were analyzed for the expression of niche-specific/associated cell surface markers (Figure 2A; supplemental Figure 3A top) and, inversely, reporter expression within each niche cell population was determined (Figure 2A; supplemental Figure 3A bottom). The main cell population contained within Nestin-GFP+,26,36 Cxcl12-dsRedki/wt,38 Osx-cre+;tdRFPki/wt,34,35 Prx1-cre+;tdRFPki/wt,33 or Lepr-cre+;tdRFPki/wt32 niche cells were MSCs, suggesting a large overlap of the labeled populations (Figure 2B; supplemental Figure 3B). Of note, the comparison of niche cell composition of reporter-positive cells to the common niche cell composition in wild-type mice revealed that all above-mentioned reporters but Nestin-GFP+ significantly enrich for MSCs in the marrow fraction (supplemental Figure 3D). A significant fraction of endothelial cells was also labeled by Nestin-GFP+ and Cxcl12-dsRed+42 (supplemental Figure 3D). OPs were found to be a subfraction of reporter-positive niche cell populations in all reporter mice, and only Osx-cre+;tdRFPki/wt could significantly enrich for OPs in the endosteal fraction (Figure 2C; supplemental Figure 3D). VE-cadh-cre+;eYFPki/wt37,43 mice predominantly labeled CD45+ hematopoietic cells. However, the large majority of the residual CD45−eYFP+ cells could be identified as endothelial cells (Figure 2B right; supplemental Figure 3D). Importantly, all cell surface marker–positive endothelial cells were labeled eYFP+ (Figure 2C), suggesting that this lineage-tracing tool is most suitable to target the majority of niche endothelial cells in the marrow. Furthermore, this cross-correlation with cell surface marker–positive cells suggests that Prx-1-cre mice are most appropriate to target BM MSCs, whereas Osx-cre mice and Lepr-cre mice only target a subset of 50% of the MSCs identified by surface marker expression (Figure 2C). However, it needs to be taken into account that Prx-1-cre will also induce recombination in all limb-bud mesenchymal lineages.33 The composition and contribution of marker-positive cells in the endosteal cell fraction significantly differed compared with the marrow, with exception of VE-cadh-cre+;eYFPki/wt mice (supplemental Figure 3). In the endosteum, Nestin-GFP was found to label all niche cell types with almost equal efficiency, whereas Cxcl12-dsRed contained a significantly higher proportion of labeled endothelial cells. Prx1-cre labeled MSCs of the endosteum with high efficiency, however, it also effectively labeled endosteal OPs and PαS cells. Lepr-cre showed no significant labeling in any endosteal niche cell population. This expression pattern suggests location-specific targeting by distinct lineage-tracing mice.
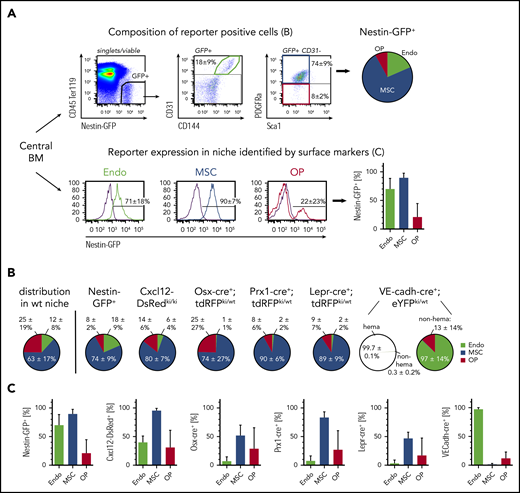
Cross-correlation of surface marker-based niche cell identification with lineage marker/tracer approaches in the BM. (A) Representative gating using Nestin-GFP+ mice to determine the composition of reporter-positive cells (top). Reporter-positive cells were analyzed for surface marker expression identifying endothelial cells (green), MSCs (blue), and OPs (red). Composition of reporter-positive cells is shown as pie charts. The contribution of reporter-positive cells to each niche cell type identified by flow cytometry is shown in bar charts (bottom). (B) Composition of niche cell types identified in BM reporter-positive cells using indicated reporter mouse strains. For comparison, proportional niche cell composition in the marrow fraction of wild-type mice is shown. VE-cadh-cre+;eYFPki/wt mice: 13% ± 5% of hematopoietic cells (hema) are labeled (not shown), and 99.7% of all labeled cells also express CD45 (left circle). Composition of nonhematopoietic–labeled cells (non-hema) is shown in the right circle. (C) Contribution of reporter-positive cells to each niche cell type. Wild-type (wt): n = 50, 30 experiments; Nestin-GFP+: n = 14, 4 experiments; Cxcl12-DsRedki/ki: n = 17, 4 experiments; Osx-cre+;tdRFPki/wt: n = 18, 8 experiments; Prx1-cre+;tdRFPki/wt: n = 17, 6 experiments; Lepr-cre+;tdRFPki/wt: n = 31, 12 experiments; VE-cadh-cre+;eYFPki/wt: n = 9, 2 experiments. GFP, green fluorescent protein.
Cross-correlation of surface marker-based niche cell identification with lineage marker/tracer approaches in the BM. (A) Representative gating using Nestin-GFP+ mice to determine the composition of reporter-positive cells (top). Reporter-positive cells were analyzed for surface marker expression identifying endothelial cells (green), MSCs (blue), and OPs (red). Composition of reporter-positive cells is shown as pie charts. The contribution of reporter-positive cells to each niche cell type identified by flow cytometry is shown in bar charts (bottom). (B) Composition of niche cell types identified in BM reporter-positive cells using indicated reporter mouse strains. For comparison, proportional niche cell composition in the marrow fraction of wild-type mice is shown. VE-cadh-cre+;eYFPki/wt mice: 13% ± 5% of hematopoietic cells (hema) are labeled (not shown), and 99.7% of all labeled cells also express CD45 (left circle). Composition of nonhematopoietic–labeled cells (non-hema) is shown in the right circle. (C) Contribution of reporter-positive cells to each niche cell type. Wild-type (wt): n = 50, 30 experiments; Nestin-GFP+: n = 14, 4 experiments; Cxcl12-DsRedki/ki: n = 17, 4 experiments; Osx-cre+;tdRFPki/wt: n = 18, 8 experiments; Prx1-cre+;tdRFPki/wt: n = 17, 6 experiments; Lepr-cre+;tdRFPki/wt: n = 31, 12 experiments; VE-cadh-cre+;eYFPki/wt: n = 9, 2 experiments. GFP, green fluorescent protein.
In vitro differentiation potential of distinct niche cells
The phenotypic cross-correlation revealed a previously unknown subdivision of MSCs by Lepr-cre tracing (Figure 2C). One-half of the MSC population expressed tdRFP in Lepr-cre+;tdRFPki/wt mice and conditional depletion of Lepr-expressing cells using a DT-inducible mouse line (Lepr-cre+;iDTRki/wt) reduced the number of MSCs by twofold (Figure 3A). Consistent with the expression profile of the Lepr-cre+;tdRFPki/wt reporter, the depletion was confined almost exclusively to MSCs in DT-treated Lepr-cre+;iDTRwt/ki mice. Taken together, these data suggest that Lepr-cre− MSCs may constitute a functionally different MSC subpopulation compared with previously described Lepr-cre+ MSCs. To determine potential functional differences between Lepr-cre+ and Lepr-cre− MSCs, ex vivo–isolated populations were cultivated under adipogenic or osteogenic conditions. Only Lepr-cre+ MSCs contained dual differentiation potential, whereas Lepr-cre− MSCs differentiated mainly into adipocytes in vitro (Figure 3B). In contrast, OPs only possessed osteogenic potential, and endothelial cells harbored no detectable mesenchymal differentiation potential as evidenced by lack of growth under these conditions (Figure 3B). Taken together, in vitro cultivation suggests that niche cells are a heterogenous population that contains at least 2 functionally distinct cell subsets identified by Lepr-cre expression.
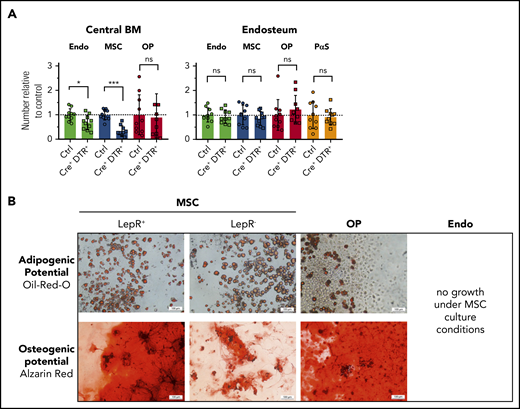
Lepr-cre+cells divide BM MSCs into 2 functionally distinct subpopulations. (A) Lepr-cre+;iDTRki/wt mice were injected with DT for 3 consecutive days and the effect on niche cells was analyzed on day 4. Control (Ctrl), n = 10; Cre+ iDTR+, n = 10; pool of 3 experiments. (B) In vitro differentiation of sorter-purified indicated cells using adipogenic or osteogenic culture conditions. Scale bars, 100 μm. Lepr+/−, n = 2; OP, n = 4; Endo, n = 5. ns, not significant.
Lepr-cre+cells divide BM MSCs into 2 functionally distinct subpopulations. (A) Lepr-cre+;iDTRki/wt mice were injected with DT for 3 consecutive days and the effect on niche cells was analyzed on day 4. Control (Ctrl), n = 10; Cre+ iDTR+, n = 10; pool of 3 experiments. (B) In vitro differentiation of sorter-purified indicated cells using adipogenic or osteogenic culture conditions. Scale bars, 100 μm. Lepr+/−, n = 2; OP, n = 4; Endo, n = 5. ns, not significant.
Expression of receptors and ligands on niche cells and HSPCs
Given the diverse distributions of the different niche cell types in the BM and the endosteum, we wondered whether they interact differentially with HSPCs. To address this question in an unbiased, genome-wide manner, we determined the transcriptome of the different niche cell types (supplemental Figure 4) and of long-term HSCs (LT-HSCs; Lin−Kit+Sca-1+CD48−CD150+), short-term HSCs (ST-HSCs; Lin−Kit+Sca-1+CD34+CD135−), and multipotent progenitor cells (MPPs; Lin−Kit+Sca-1+CD34+CD135+) from wild-type mice. Population identity was confirmed by annotating specific genes and Gene Set Enrichment Analysis using previously published gene sets44 (supplemental Figure 5A-B). To infer putative molecular interactions between the niche cells and the HSPCs from these data, we established a database of receptor-ligand interactions (RLDB). We focused on binary receptor-ligand pairs, including interactions between adhesion molecules and interactions involving proteins from the extracellular matrix and cell surface receptors. The core of the interactions was taken from the Fantom V database of human receptor-ligand interactions,29 using all genes with orthologs in mice. We enriched this database with data from further protein-protein interaction databases, InnateDB,45 IntactDB,46 and EBI-GOA NonIntact,46 using the Gene Ontology terms “cell surface” and “receptor binding.” To minimize detection of false-positives, we excluded interactions without experimental support for their role in cell-to-cell communication. To this end, we removed cell surface enzymes, which modulate receptor and/or ligand activity on the same cell but do not have an established direct role in cell-to-cell communication. Thus, we obtained a database of 1863 receptor-ligand pairs supported by the primary research literature (supplemental Table 2).
Next, we focused on signaling mechanisms from niche cell ligands to HSPCs expressing the corresponding receptors. After correcting for batch effects in the transcriptome data sets, PCA based on the expression of the ligands (579 components) from the database clearly separated the niche cell types (Figure 4A). In particular, the first component, explaining nearly one-third of the variance in ligand expression, separated the BM MSCs from the other cell types. Hierarchical clustering of the samples according to ligand expression confirmed that all samples of a given cell type cluster together and separately from any other niche cell type (Figure 4B). Hence, for each niche cell population, cell-type–specific patterns of ligands are conserved in every sample. Next, we selected ligands from our database reported to play a role in HSC homeostasis. Practically all of these had high mRNA expression (Figure 4C). For instance, Jag1, Vcam1, and Sele (E-selectin) were highly expressed by endothelial cells, whereas MSCs, a population previously described to be overlapping with CXCL12 abundant reticular cells,25 had the highest expression Cxcl12 mRNA. To confirm cell identity on the hematopoietic side, we analyzed receptor expression on HSPCs by hierarchical clustering, and LT-HSC samples were well separated from ST-HSCs and MPPs, confirming the analysis of appropriate cell populations (Figure 4D).
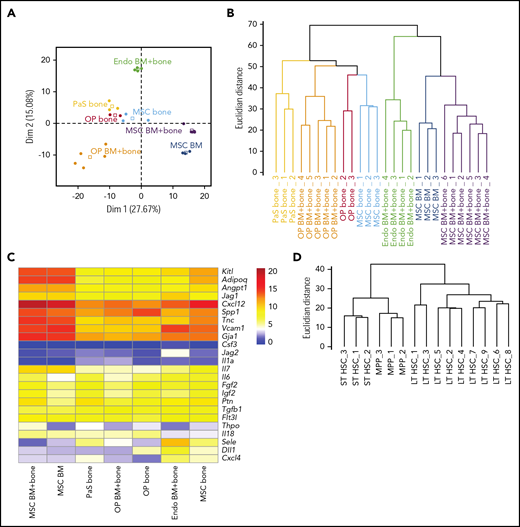
RNA seq data reveals distinct expression of HSPC regulators by different niche cell populations. (A) PCA based on gene expression of the 579 ligands from the receptor-ligand database by niche cells. Dots, individual samples; open squares, barycenters of the different samples for a given cell population. (B) Hierarchical clustering of niche cell samples based on ligand expression. (C) Heatmap shows mean rlog transformed expression values of known HSPC regulators (ligands) in distinct niche cells. (D) Hierarchical clustering of HSPCs based on gene expression of the 555 receptors from the receptor-ligand database.
RNA seq data reveals distinct expression of HSPC regulators by different niche cell populations. (A) PCA based on gene expression of the 579 ligands from the receptor-ligand database by niche cells. Dots, individual samples; open squares, barycenters of the different samples for a given cell population. (B) Hierarchical clustering of niche cell samples based on ligand expression. (C) Heatmap shows mean rlog transformed expression values of known HSPC regulators (ligands) in distinct niche cells. (D) Hierarchical clustering of HSPCs based on gene expression of the 555 receptors from the receptor-ligand database.
Niche cells present distinct ligand profiles to HSPCs
Having observed cell-type–specific global expression patterns of ligands and receptors on niche cell types and HSPCs, respectively, we set out to infer functionally important receptor-ligand pairs. We reasoned that if the ligand gene is highly expressed in a niche cell and the receptor gene highly expressed in an HSPC, then they are likely to be involved in a functional interaction. However, normalized read counts as such are a poor indicator of the functional importance of a gene. For example, Cxcl12 mRNA has a 7.5-fold higher expression than Jag1 mRNA in MSCs whereas both cytokines have been previously shown to be expressed by this cell population and to be critical for HSC homeostasis (supplemental Figure 5C). However, within the context of the overall distribution of gene-expression values within our data set, these cytokines are highly expressed genes. This suggests that the rank of a particular expression value within a data set, rather than the expression values, conveys information on the functional importance of the gene.
To determine the relative importance of ligands and receptors, we developed a score that rates the interactions based on the ranks of the expression values of the receptors and ligands (Figure 5A). For this purpose, each niche cell ligand from our database was ranked according to its mean expression values, and in the same way the receptors were ranked for each HSPC population. Then for each interaction, and each niche/HSPC pair, an interaction score between 0 and 1 was computed as the sum of the rank of receptor and ligand, normalized by the maximum sum (supplemental Table 3). This database was named RLDB and is available online (https://github.com/hoefer-lab/CellInteractionScores). Extensively documented key interactions between MSCs and LT-HSCs appeared in the top 3% of interactions, including KIT ligand (Kitl) with KIT (Kit), TIE2 (Tek) with ANGPT1 (Angpt1), CXCL12 (Cxcl12) with CXCR4 (Cxcr4), as well the VLA-4 (integrin β1 [Itgb1]/Itga4) integrin complex with VCAM1 (Vcam1) (Figure 5B). Moreover, for the entirety of receptor-ligand interactions, the interaction score correlated very well with both the expression of the ligand and of the corresponding receptor, although the ligands had overall higher expression values (Figure 5C). Thus, the interaction score gives equal weight to the expression of ligands and of receptors. We then asked to what extent the stimuli received by the HSPCs may originate from the niche cells analyzed. The vast majority of receptors expressed in HSPCs had a cognate ligand expressed by at least 1 niche cell (Figure 5D). However, there were notable exceptions (indicated by the numbers in Figure 5D), including receptors for the proinflammatory cytokines interferon γ and IL-21 that render HSPCs sensitive to stimuli from immune cells.
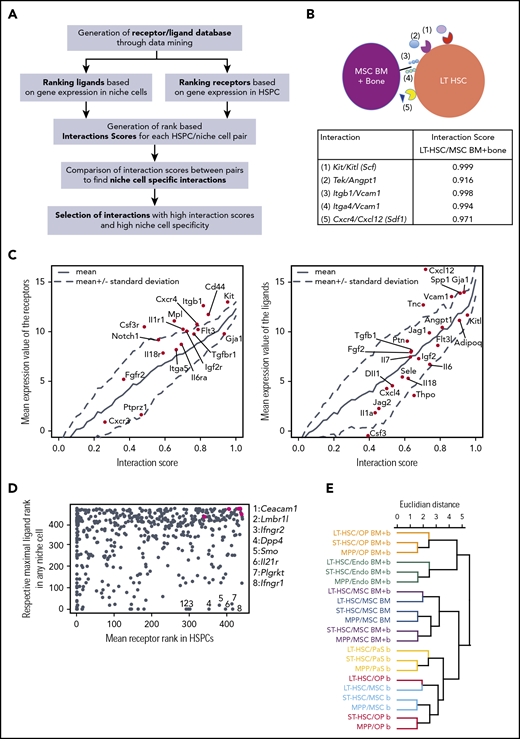
Interaction analysis retrieves well-known and novel molecular interaction partners in the context of HSPC homeostasis. (A) Interaction analysis pipeline. (B) Example of interactions and respective interaction scores for the LT-HSC/MSC (BM plus bone) pair. (C) Left panel, Relationship between mean expression of receptors in HSPCs and scores of interactions involving indicated ligands. Right panel, Relationship between mean expression of ligands in niche cells and scores of interactions involving indicated receptors. (D) Plot shows mean receptor rank within HSPCs (x-axis) vs the highest rank of the respective ligands in any niche cell (y-axis), green dots are, from left to right, Tek, Cxcr4, Itga4, Itgb1, Kit. (E) Hierarchical clustering of HSPC/niche cell pairs based on interaction scores.
Interaction analysis retrieves well-known and novel molecular interaction partners in the context of HSPC homeostasis. (A) Interaction analysis pipeline. (B) Example of interactions and respective interaction scores for the LT-HSC/MSC (BM plus bone) pair. (C) Left panel, Relationship between mean expression of receptors in HSPCs and scores of interactions involving indicated ligands. Right panel, Relationship between mean expression of ligands in niche cells and scores of interactions involving indicated receptors. (D) Plot shows mean receptor rank within HSPCs (x-axis) vs the highest rank of the respective ligands in any niche cell (y-axis), green dots are, from left to right, Tek, Cxcr4, Itga4, Itgb1, Kit. (E) Hierarchical clustering of HSPC/niche cell pairs based on interaction scores.
Hierarchical clustering of the niche/HSPC pairs based on the Euclidian distance between interaction scores showed a clear ordering according to the niche component (Figure 5E). Within each major cluster dictated by niche cell type (color code in Figure 5E), the interactions formed by LT-HSCs clustered apart from the interactions formed by both ST-HSCs and MPPs in all cases. These findings suggest that each niche cell type presents a distinct quantitative ligand profile to the HSPCs.
Cell-to-cell interactomes
To study this phenomenon in more detail, we focused on endothelial cells and MSCs, selecting interactions that involve ligands with particularly high expression in 1 of these 2 niche cell types (Figure 6). Among these top niche cell-specific predicted interactions, we found several previously described ones, such as CXCR4/CXCL12 (CXCR4/SDF1) and KIT/KITL (KIT/SCF) associated with MSC, or NOTCH1/JAG1, CD44/Selectin E or Selectin L/Selectin E associated with endothelial cells. Furthermore, the 2 niche cells expressed distinct components of the extracellular matrix that can interact with the same cell adhesion molecule on HSPCs, such as collagen (endothelial cells) and laminin β1 (MSCs) interacting with integrin β1 (HSPCs). Our analysis was also informative on receptor-ligand interactions, which have been shown to participate in HSPC homeostasis but for which the cellular source of the ligand has not been defined (eg, Axl/Gas647 with GAS6 expressed by MSCs). Finally, our findings point to a role for ligand antagonists in the regulation of HSPCs. MSCs express high levels of both CXCL12 and its antagonist CXCL14. Moreover, together with the expression of BMP4, BMP5, and BMP6, MSCs also expressed Follistatin-1 (Fstl-1), a transforming growth factor β superfamily antagonist known for its inhibition of BMP ligands. These MSC-specific ligands were particularly strongly expressed by MSCs isolated from the BM (supplemental Figure 6), however, BM and bone MSCs also showed distinct receptor expression (supplemental Table 4). In endothelial cells, we found high and specific expression of both Jag1, a notch ligand, and of Egfl7, a Notch2 antagonist. Thus, our global analysis of niche-cell–specific molecular interactions with HSPCs identifies putative novel receptor-ligand pairs between niche cells and HSPCs. It also points toward a complex network in which both positive and negative ligand stimuli are balanced to maintain the function of HSCs.
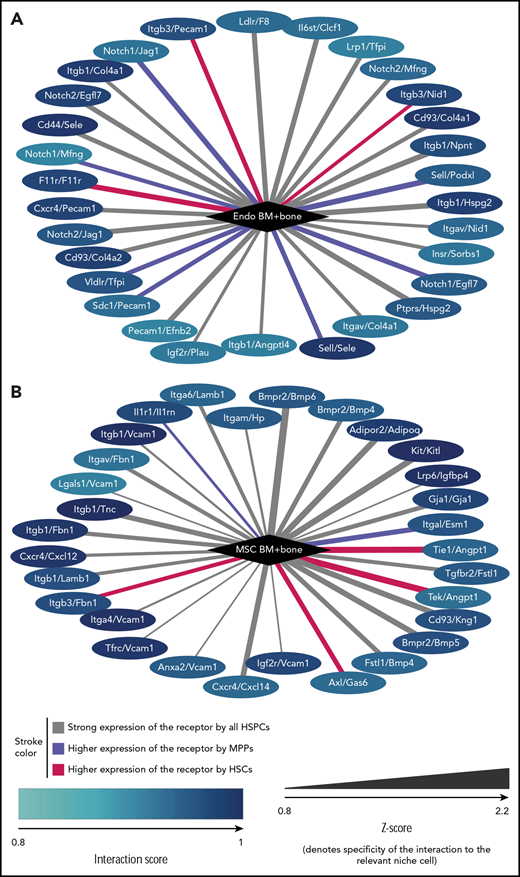
Receptor/ligand interactions. Receptor/ligand interactions most specifically associated with endothelial cells from BM plus bone (A) and MSCs from BM plus bone (B). Node color encodes the interaction score of the specified niche cell with the type of HSPC for which the score is highest. Edge color visualized whether the highest interaction score is with HSCs (red), with MPPs (blue), or whether the score is approximately equal for all HSPCs (gray). Edge thickness denotes the specificity of the interaction score to the niche cell type (Z-score). Note that Kitl and CXCL12 are also known as SCF and SDF1, respectively.
Receptor/ligand interactions. Receptor/ligand interactions most specifically associated with endothelial cells from BM plus bone (A) and MSCs from BM plus bone (B). Node color encodes the interaction score of the specified niche cell with the type of HSPC for which the score is highest. Edge color visualized whether the highest interaction score is with HSCs (red), with MPPs (blue), or whether the score is approximately equal for all HSPCs (gray). Edge thickness denotes the specificity of the interaction score to the niche cell type (Z-score). Note that Kitl and CXCL12 are also known as SCF and SDF1, respectively.
Effects of predicted molecular interaction partners on HSPC function
To provide a first direct test for biological effects of the predicted molecular interactions, we cultivated HSPCs (sorter-purified Lineage−Kit+Sca-1+BM cells) in the presence of selected putative regulators: BMP6, IGF-BP4, VCAM1, CXCL12, E-SEL, PECAM1, EGF-L7, ESM1, CXCL14, BMP-4, or LAMININ (Figure 7A). We found an increase in colony frequencies through the addition of CXCL12 and a reduction by the addition of IGF-BP4, VCAM1, or E-SEL. Moreover, individual colony size was reduced by the addition of E-SEL (Figure 7B), a known regulator of HSC dormancy.21 These results provide evidence for functional consequences of identified molecular regulators on HSPC function.
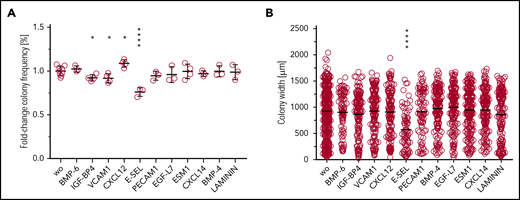
In vitro colony growth in the presence of putative novel regulators of HSC growth. (A) Frequencies of growth factor–responsive cells after 8 days of culture in the presence of SCF, IL-3, and IL-6 and the indicated test agent are shown. (B) Average size of colonies in indicated conditions.
In vitro colony growth in the presence of putative novel regulators of HSC growth. (A) Frequencies of growth factor–responsive cells after 8 days of culture in the presence of SCF, IL-3, and IL-6 and the indicated test agent are shown. (B) Average size of colonies in indicated conditions.
Discussion
Over the last decades, most studies have concentrated on cell-extrinsic regulation of HSC function. An entirely new research field recently emerged from the studies on the embryonic and fetal niches and bone microenvironment (reviewed by Gao et al27 ). Furthermore, there is accumulating evidence for a significant contribution of marrow niche dysregulation to the emergence and progression of leukemia,48,49 which underlines the need to define distinct niche cell types and the molecular signals emanating from them. However, the cross-correlation between niche cells identified by histology using lineage tracing or marking mouse mutants vs phenotypic identification by flow cytometry has not been resolved, thus hampering an in-depth understanding of niche-HSC communication. Furthermore, despite the agreement on the existence of a molecular cross-communication between niche cells and HSCs or progenitors50 and the availability of a large transcriptome data set on niche cells isolated via lineage-tracing approaches,51 a comprehensive data resource focusing on confirmed molecular interactions between several niche cell types identified by cell surface markers and LT-HSCs has been lacking. To this end, we used an antibody-based prospective niche and HSPC isolation for retrieval of the cells. Moreover, we cross-correlate in detail cell surface marker phenotypes with niche cell identification using lineage-tracing/marking reporter mice. By this means, we provide evidence for a previously unknown heterogeneity in the MSC population using a functional assay. Furthermore, we provide a database of receptor-ligand interactions supported by the primary research literature, RLDB, and use it to predict novel molecular interactions between niche cells and HSPCs.
In vivo–imaging approaches have suggested that steady-state HSCs are tightly anchored within their niche and only display minimal oscillatory movements.52 This suggests that strong adhesion may be essential to bring HSCs within close proximity to a unique set of niche-derived membrane-bound and soluble molecular factors that regulate HSC fate decisions. Importantly, distinct cell types contribute uniquely to the generation of this molecular microenvironment. For example, lack of SCF from LepR+ MSCs or from endothelial cells but not from other niche cell types impaired the maintenance of long-term repopulating HSCs.18,38 Also, depleting CXCL12 from Prx+ mesenchymal cells but not from endothelial or osteolineage niche cells impairs HSC function.53 The idea of a specific molecular microenvironment was extended from HSCs to progenitor cells and, consistently, the depletion of CXCL12 from osteolineage cells specifically compromised progenitors of the lymphoid lineage.38,53 In the context of such approaches, it is important to note that most likely there is an overlap of the targeted cell types using different “cre” mouse lines in these studies. In fact, niche cell functional heterogeneity has been suggested previously, and molecular overlap between different niche cell types based on lineage-tracing/marking approaches has been shown.51 Using a cross-correlation of phenotypic niche cell identification to lineage-tracing or -targeting approaches is 1 way to deconvolute that overlap. We here define precisely the cellular origins of the molecular landscape regulating HSC function in situ. We and others51 provide evidence that niche cell populations differ in molecular signaling and function depending on their location within the bone. Bone MSCs are more resistant to myeloablation and although their ligand-receptor interactions with HSCs partially overlap with BM MSCs, both MSC populations display very unique transcriptional profiles, suggesting unique roles in HSC regulation. Consistently, bone-lining niche cells play a particular role supporting HSCs after myeloablation and BM transplantation.51 Interactome analysis based on RLDB can thus serve as a tool to predict novel molecular regulators of the complex cross talk between HSCs and individual niche cell components and identify their precise cellular source, both of which remain key questions in HSC research.
To estimate the relevance between receptor-ligand pairs from transcriptome data, we have developed a tool to calculate the cell-to-cell interaction score. Our method considers each cell-cell interaction as a quantitative variable dependent on the relative expression values of the receptor and the ligand. Our method works readily and robustly across different data sets and cell types because the expression values are encoded by their rank. The rank-based comparison generates a global and balanced picture of cell-to-cell interactomes without overemphasizing genes with extremely high expression values (eg, Cxcl12 in MSCs). These sets of interaction scores can be analyzed with standard tools of statistical learning (eg, PCA, clustering) to extract cell-type–specific features of the cell-to-cell interactome. Here, we find a high degree of niche-cell specificity of the interactomes with HSPCs. Besides known interactions, our approach also predicted novel interactions that could be tested experimentally. Our data highlights the relevance of niche-derived extracellular matrix components that were predominantly predicted to interact with integrins on HSCs. One prominent example, Fibrilin-1, an extracellular matrix protein highly expressed by all analyzed niche populations, regulates HSC numbers based on increased transforming growth factor β signaling in the niche.54 Another example is the interaction between Itgβ1 and Tenascin-C, which occurred as 1 of the highest interaction scores for MSC-HSC interactions from both locations. Itgβ1 is an essential receptor for HSC homing to the BM,55 and small molecule α9β1/α4β1 integrin antagonists are sufficient to efficiently mobilize murine and human HSCs in animal models.56 Its putative interaction partner Tenascin-C contributes to the retention of HSPCs in the BM,57 suggesting a crucial role for this interaction for HSC lodgment in the niche. Future examination of the functions of these putative regulators will ultimately require their manipulation in vivo.
Interestingly, our analysis reveals coexpression of both ligands and their antagonists by specific niche cells. This coexpression suggests the existence of a fine-tuning mechanism for niche cell stimuli presented to HSPCs. Although our study with well-defined and purified niche cell subpopulations was designed to identify putative cell interactions robustly, avoiding technical dropouts that are abundant in single-cell transcriptome analyses, single-cell studies58 could follow this up to investigate whether a ligand and its antagonist are expressed on the same niche cell or on different subpopulations.
Computational tools are available on a public repository for general usage, at https://github.com/hoefer-lab/CellInteractionScores; please cite this publication as the source.
The online version of this article contains a data supplement.
The publication costs of this article were defrayed in part by page charge payment. Therefore, and solely to indicate this fact, this article is hereby marked “advertisement” in accordance with 18 USC section 1734.
Acknowledgments
The authors are grateful to Joerg Fehling for providing Td-rfp mice, Luisa Iruela Arispe for providing VE-Cadherin-cre mice, Grigori Enikolopov for providing Nestin-GFP mice, and Sean Morrison for providing Cxcl12-DsRed mice. The authors thank the staff of the animal house at the Medical Theoretical Center for great care of mouse husbandry.
This work was supported by the German Research Foundation (DFG) through FOR2033-A03, TRR127-A5, WA2837/6-1, and WA2837/7-1 (C.W.).
Authorship
Contribution: N.M., G.I.P., M.G., M.R., and S.M.K. planned, performed, and interpreted experiments; A.J. and T.H. performed bioinformatics and analysis; A.D. performed next-generation sequencing; R.A.J.O. and K.A. provided crucial advice; C.W. conceived the study, designed experiments, and analyzed data; and C.W. and T.H. wrote the manuscript.
Conflict-of-interest disclosure: The authors declare no competing financial interests.
The current affiliation for N.M. is Wellcome-MRC Cambridge Stem Cell Institute, Cambridge, United Kingdom.
The current affiliation for M.R. is Epigenetics Programme, Babraham Institute, Cambridge, United Kingdom.
Correspondence: Claudia Waskow, Leibniz Institute on Aging–Fritz Lipmann Institute (FLI), Beutenbergstr 11, 07745 Jena, Germany; e-mail: claudia.waskow@leibniz-fli.de; or Thomas Höfer, Theoretical Systems Biology, German Cancer Research Center, Im Neuenheimer Feld, 69120 Heidelberg, Germany; e-mail: t.hoefer@dkfz-heidelberg.de.

This feature is available to Subscribers Only
Sign In or Create an Account Close Modal