

Key Points
ISAPL modeling identified 2 distinct groups of patients with APL with significant differences in clinical outcomes.
ISAPL modeling might be a viable alternative for identifying patients that should be monitored and treated differently.

Abstract
By combining the analysis of mutations with aberrant expression of genes previously related to poorer prognosis in both acute promyelocytic leukemia (APL) and acute myeloid leukemia, we arrived at an integrative score in APL (ISAPL) and demonstrated its relationship with clinical outcomes of patients treated with all-trans retinoic acid (ATRA) in combination with anthracycline-based chemotherapy. Based on fms-like tyrosine kinase-3–internal tandem duplication mutational status; the ΔNp73/TAp73 expression ratio; and ID1, BAALC, ERG, and KMT2E gene expression levels, we modeled ISAPL in 159 patients (median ISAPL score, 3; range, 0-10). ISAPL modeling identified 2 distinct groups of patients, with significant differences in early mortality (P < .001), remission (P = .004), overall survival (P < .001), cumulative incidence of relapse (P = .028), disease-free survival (P = .03), and event-free survival (P < .001). These data were internally validated by using a bootstrap resampling procedure. At least for patients treated with ATRA and anthracycline-based chemotherapy, ISAPL modeling may identify those who need to be treated differently to maximize their chances for a cure.
Introduction
In the context of all-trans retinoic acid (ATRA) and anthracycline-based chemotherapy, the clinical outcomes of patients with acute promyelocytic leukemia (APL) may have more heterogeneity than expected, mainly outside well-controlled clinical trials.1,-3 Although highly successful initiatives, such as the International Consortium on Acute Promyelocytic Leukemia (IC-APL) study, have significantly improved the treatment outcomes of patients who live in low- and middle-income countries (LMICs),4 these results are still inferior to those reported in high-income countries (HICs),5 reinforcing the idea that the prognosis of APL is not as favorable in LMICs as is frequently assumed.
Recent results from clinical trials in which arsenic trioxide (ATO) plus ATRA and minimal chemotherapy were used in patients with standard-risk (ie, low- and intermediate-risk6 ) disease suggest that many factors associated with unfavorable prognosis can be reduced by adopting these ATO-based protocols.7,-9 However, most patients who live in LMICs do not benefit from these recent improvements, mainly because ATO is not approved for frontline therapy. At least for the near future, alternative strategies for predicting outcomes in patients treated with ATRA and chemotherapy should be developed and evaluated. In this study, we assessed a combination of recurrent gene mutations with aberrant expression of genes previously associated with poor prognosis in both APL10,,,,,,-17 and acute myeloid leukemia (AML),18,,,-22 and proposed an integrative score in APL (ISAPL) for successfully predicting outcomes.
Design and methods
Patients
From October 2006 through June 2015, diagnostic bone marrow samples from 183 adult patients with APL who were enrolled in the IC-APL study were analyzed. Details of the diagnosis, eligibility criteria, and treatment protocol have been published elsewhere.4 According to the IC-APL protocol, patients were diagnosed based on the identification of the APL-specific genetic lesion, by conventional karyotyping and molecular methods.23 Monitoring for complete response to treatment or minimal residual disease was performed by reverse transcription polymerase chain reaction (PCR) at the end of the third cycle of consolidation. Subsequently, periodic evaluations were performed every 3 months during maintenance and for 2 years after completion of treatment.4 Written informed consent was obtained from all patients, according to Declaration of Helsinki recommendations. The local research ethics board of each participating center approved the study.
DNA extraction and screening for FLT3-ITD mutations
Genomic DNA was extracted using the Puregene kit (Gentra System), according to the manufacturer’s protocol. Screening for the fms-like tyrosine kinase-3–internal tandem duplication (FLT3-ITD) mutations was performed by PCR, according to the method of Kiyoi et al,24 followed by electrophoresis on 3% agarose gel stained with ethidium bromide. Internal and external validation of FLT3-ITD mutation screening are described elsewhere.12 In parallel, we explored the FLT3 allelic ratio in patients with the FLT3-ITD mutation, according to the 2017 European LeukemiaNet recommendations for AML.25,26
Gene expression profile
Real-time quantitative PCR assays using patient-derived complementary DNA were performed in duplicate on MicroAmp optical 96-well plates, using a 7500 Real-Time PCR System (Applied Biosystems). Transcript levels of TP73 isoforms (TAp73, assay ID: Hs00232088_m1; and ΔNp73 assay ID: Hs01065727_m1) and of KMT2E (assay ID: Hs00218773_m1) and BAALC genes (assay ID: Hs00227249_m1; all from Applied Biosystems) were determined as previously described.10,11,16 Expression levels of the ERG (assay ID: Hs01554635_m1), ID1 (assay ID: Hs00357821_g1), PIM2 (assay ID: Hs00179139_m1), PRAME (assay ID: Hs01022301_m1), and WT1 genes (assay ID: Hs01103751_m1; all from Applied Biosystems) were determined with TaqMan Gene Expression Assays, according to the manufacturer’s instructions. The comparative cycle threshold (Ct) method was used to determine the relative expression levels of ERG, ID1, PIM2, PRAME, and WT1, with the ABL FusionQuant Standard Kit (Ipsogen) as the endogenous control. The gene expression profile was calculated relative to a reference complementary DNA (NB4 cell line, an APL cell line), and results were expressed as 2−ΔΔCt. Details can be found elsewhere.10
Dichotomization strategy and samples categorization
Patients presenting with FLT3-ITD mutations were designated as mutated and patients without FLT3-ITD mutations as nonmutated. Those with FLT3-ITD–mutated status were further stratified based on the FLT3 allele ratio.26 For continuous variables, we used 2 different strategies to define optimal cutoffs: first, we divided the total cohort into quartiles (Qs) according to the expression level of each gene. Based on the survival curves (using overall survival [OS] as a primary end point), we grouped quartiles with similar event probabilities. Next, we confirmed these findings by using survival receiver operating characteristic curve analysis27 and the concordance index.28 When no cutoff could be determined by these 2 strategies, patients with expression values lower than the median were classified as having low expression. According to these criteria, patients were dichotomized at the median expression of the PIM2 and PRAME genes, the lowest 25% expression of the ERG and WT1 genes (ie, those assigned to the first quartile [Q1]), and the highest 75% expression of the ID1 gene (ie, those assigned to Q4). The gene expression profile and dichotomization strategies for the ΔNp73/TAp73 expression ratio and the KMT2E and BAALC genes have been described.10,11,16
Statistical analysis and clinical end points
Details of the statistical analysis and clinical end points are described elsewhere.29 To cross-validate our findings, we performed a nonparametric bootstrap procedure, with 1000 resamplings of the original cohort allowing replacement.28,30,-32 The function calculates all clinical end points at 3 different time points (1, 2, and 5 years) for both categories (low- and high-risk ISAPL). The bootstrap resampling procedure also estimated the respective 95% confidence interval (CI), computing the bias-corrected and accelerated bootstrap intervals. We had tested the hypothesis that the mean of both bootstrap sampling distributions was different by using either the Welch 2-sample Student t test when the distributions were normal in a quantile-quantile plot inspection or the Wilcoxon rank-sum test when not normal. All P values were 2-sided with a significance level of 0.05. All calculations were performed with Stata Statistic/Data Analysis, version 12 (Stata Corporation), and R 3.3.2 (The Comprehensive R Archive Network project; www.r-project.org) software.
Assignment of weights to prognostic markers
Integer weights for the risk score were derived from the Cox proportional hazard model, identical to that reported by Damm et al,33 using OS as the end point and including values of P < 0.05 in the model. Variables considered for inclusion in the model were FLT3-ITD mutational status; the gene expression profile of the ΔNp73/TAp73 ratio; and the transcript levels of the KMT2E, BAALC, ID1, and ERG genes. Other candidates, such as PIM2, WT1, PRAME, and IDH1, were not associated with lower OS and were not included in the score. Hazard ratios (HRs) for OS were calculated for each variable separately. The HR was converted to integer weights according to the following: variables with HR ≤ 1 were excluded from the analyses, variables with HR > 1 or ≤ 1.5 were assigned a weight of 1, variables with HR > 1.5 and ≤ 2.5 were assigned a weight of 2, and variables with HR > 2.5 were assigned a weight of 3. The final score was the sum of these integer weights.
Results
ISAPL modeling in APL
Complete data for ISAPL modeling were available for the entire cohort. Nevertheless, 24 patients (13%) were lost to follow-up before the assessment of remission status and thus were excluded from the induction outcome analysis. For the remaining 159 patients, univariate Cox proportional hazard analysis revealed that FLT3-ITD mutational status (HR, 2.88; 95% CI, 1.55-5.35; P = .001), high ΔNp73/TAp73 expression ratio (HR, 4.43; 95% CI, 1.83-10.7; P = .001), high expression of the ID1 (HR, 3.41; 95% CI, 1.42-8.22; P = .006) and BAALC genes (HR, 2.68; 95% CI, 1.04-6.92; P = .041), and low expression of the ERG (HR, 2.65; 95% CI, 1.15-6.42; P = .03) and KMT2E genes (HR, 3.26; 95% CI, 1.18-8.99; P = .022) were associated with lower OS and were therefore used to generate the ISAPL (Table 1). Of note, the FLT3 allelic ratio was also considered for inclusion in ISAPL modeling (HR, 1.8; 95% CI, 1.18-2.75; P = .006). We opted to use FLT3-ITD mutational status instead of FLT3 allelic ratio because the number of samples available at diagnosis was higher in the former group. It is important to note that the final score remained unchanged when the FLT3-ITD mutational status or either FLT3 allelic ratio was used.
Variables used for the determination of the ISAPL
| Variables analyzed | Dichotomization strategy | Cox proportional hazard modeling | Integer weight* |
|---|---|---|---|
| HR (95% CI); P | |||
| FLT3-ITD status: mutated vs nonmutated | Not applicable | 2.88 (1.55-5.35); .001 | 3 |
| KMT2E gene expression: low vs high | Q1-Q2 vs Q3-Q4 | 3.26 (1.18-8.99); .022 | 3 |
| BAALC gene expression: high vs low | Q3-Q4 vs Q1-Q2 | 2.68 (1.04-6.92); .041 | 3 |
| ΔNp73/TAp73 ratio: high vs low | Q4 vs Q1-Q3 | 4.43 (1.83-10.7); .001 | 3 |
| ID1 gene expression: high vs low | Q4 vs Q1-Q3 | 3.41 (1.42-8.22); .006 | 3 |
| ERG gene expression: low vs high | Q1 vs Q2-Q4 | 2.65 (1.15-6.42); .03 | 3 |
| WT1 gene expression: low vs high | Q1 vs Q2-Q4 | 6.78 (0.9-50.7); .061 | — |
| PRAME gene expression: high vs low | Q3-Q4 vs Q1-Q2 | 1.02 (0.42-2.45); .96 | — |
| PIM2 gene expression: high vs low | Q3-Q4 vs Q1-Q2 | 1.23 (0.5-2.96); .644 | — |
Integer weights for the risk score were derived from the Cox proportional hazard model, using overall survival as the end point.
Clinical and laboratory features
According to the receiver operating characteristic, the curve analysis (area under the curve, 0.76; 95% CI, 0.66-0.84), the median value of ISAPL modeling (median value, 3; range, 0-10; sensitivity, 86%; 1 − specificity, 51%) was used to dichotomize patients into 2 groups (low-risk, <3; high-risk, ≥3). Descriptive analyses were performed for the baseline features (Table 2). The median age was 35 years (range, 18-82) with 82 men (45%). According to Programa para el Estudio de la Terapéutica en Hemopatía Maligna/Gruppo Italiano Malattie EMatologiche dell’Adulto (PETHEMA/GIMINA) criteria for predicting relapse,6 31% and 50% of the patients assigned to the low- and high-risk groups, respectively, were deemed high risk (P = .037).
Baseline characteristics
| ISPAL modeling | ||||||||||
|---|---|---|---|---|---|---|---|---|---|---|
| Characteristics | All patients (N = 159) | Low risk (n = 80) | High risk (n = 79) | P* | ||||||
| n | % | Median (range) | n | % | Median (range) | n | % | Median (range) | ||
| Sex | — | — | — | — | — | — | — | — | — | .008† |
| Female | 101 | 55.2 | — | 61 | 64.9 | — | 40 | 44.9 | — | — |
| Male | 82 | 44.8 | — | 33 | 35.1 | — | 49 | 55.1 | — | — |
| Age, y | — | — | 35.6 (18.3-82.5) | — | — | 37.7 (18.3-82.5) | — | — | 34.9 (18.4-66.5) | .517 |
| 18-40 | 89 | 56.7 | — | 44 | 55.7 | — | 45 | 57.7 | — | — |
| 41-60 | 56 | 35.7 | — | 26 | 32.9 | — | 30 | 38.5 | — | — |
| ≥60 | 12 | 7.6 | — | 9 | 11.4 | — | 3 | 3.8 | — | — |
| Unknown | 26 | — | — | 15 | — | — | 11 | — | — | — |
| ECOG performance status | — | — | — | — | — | — | — | — | — | .483 |
| 0 | 78 | 54.5 | — | 40 | 55.6 | — | 38 | 53.5 | — | — |
| 1 | 33 | 23.1 | — | 16 | 22.2 | — | 17 | 23.9 | — | — |
| 2 | 14 | 9.8 | — | 9 | 12.5 | — | 5 | 7 | — | — |
| ≥3 | 18 | 12.6 | — | 7 | 9.7 | — | 11 | 15.5 | — | — |
| Unknown | 40 | — | — | 22 | — | — | 18 | — | — | — |
| Leukocyte counts, ×109/L | — | — | 5.37 (0.8-128.5) | — | — | 3.4 (0.22-102.7) | — | — | 9.9 (0.8-128.5) | .027† |
| <5 | 77 | 48.7 | — | 45 | 56.3 | — | 32 | 41 | — | — |
| 5-10 | 17 | 10.8 | — | 10 | 12.5 | — | 7 | 9 | — | — |
| 10-50 | 47 | 29.7 | — | 20 | 25 | — | 27 | 34.6 | — | — |
| ≥50 | 17 | 10.8 | — | 5 | 6.3 | — | 12 | 15.4 | — | — |
| Unknown | 25 | — | — | 14 | — | — | 11 | — | — | — |
| Platelet counts, ×109/L | — | — | 25.5 (7-230) | — | — | 26 (4-230) | — | — | 25 (7-157) | .314 |
| <40 | 123 | 77.8 | — | 59 | 73.8 | — | 64 | 82.1 | — | — |
| ≥40 | 35 | 22.2 | — | 21 | 26.3 | — | 14 | 17.9 | — | — |
| Unknown | 25 | — | — | 14 | — | — | 11 | — | — | — |
| Relapse-risk group‡ | — | — | — | — | — | — | — | — | — | .037† |
| Low risk | 24 | 15.2 | — | 16 | 20 | — | 8 | 10.3 | — | — |
| Intermediate risk | 70 | 44.3 | — | 39 | 48.8 | — | 31 | 39.7 | — | — |
| High risk | 64 | 40.5 | — | 25 | 31.2 | — | 39 | 50 | — | — |
| Unknown | 25 | — | — | 14 | — | — | 11 | — | — | — |
| Hemoglobin, g/dL | — | — | 8.7 (3.2-21.8) | — | — | 8.6 (3.4-21.8) | — | — | 8.7 (3.2-14.9) | .939 |
| <10 | 118 | 74.7 | — | 57 | 71.3 | — | 61 | 78.2 | — | — |
| ≥10 | 40 | 25.3 | — | 23 | 28.7 | — | 17 | 21.8 | — | — |
| Missing | 25 | — | — | 14 | — | — | 11 | — | — | — |
| Creatinine, mg/dL | — | — | 0.8 (0.8-4.3) | — | — | 0.8 (0.4-2.8) | — | — | 0.81 (0.4-4.3) | .48 |
| <1.4 | 146 | 94.8 | — | 78 | 98.7 | — | 68 | 90.7 | — | — |
| ≥1.4 | 8 | 5.2 | — | 1 | 9.6 | — | 7 | 9.3 | — | — |
| Unknown | 29 | — | — | 15 | — | — | 14 | — | — | — |
| Uric acid, mg/dL | — | — | 3.9 (1.1-10.3) | — | — | 3.8 (1.1-8.1) | — | — | 4.1 (2-10.3) | .227 |
| <7 | 132 | 89.8 | — | 66 | 90.4 | — | 66 | 89.2 | — | — |
| ≥7 | 15 | 10.2 | — | 7 | 9.6 | — | 8 | 10.8 | — | — |
| Unknown | 36 | — | — | 21 | — | — | 15 | — | — | — |
| Fibrinogen, mg/dL | — | — | 160 (10-898) | — | — | 163 (10-898) | — | — | 159 (0.5-549) | .86 |
| <170 | 80 | 53.7 | — | 40 | 52.6 | — | 40 | 54.8 | — | — |
| ≥170 | 69 | 46.3 | — | 36 | 47.4 | — | 33 | 45.2 | — | — |
| Unknown | 34 | — | — | 18 | — | — | 16 | — | — | — |
| Albumin, g/dL | — | — | 3.9 (2.2-5.42) | — | — | 3.9 (2.2-5.42) | — | — | 3.9 (2.4-5) | .754 |
| <3.5 | 27 | 22.3 | — | 12 | 20 | — | 15 | 24.6 | — | — |
| ≥3.5 | 94 | 77.7 | — | 48 | 80 | — | 46 | 75.4 | — | — |
| Unknown | 62 | — | — | 34 | — | — | 28 | — | — | — |
| His morphologic subtype | — | — | — | — | — | — | — | — | — | .328 |
| Hypergranular | 148 | 93.7 | — | 76 | 96.2 | — | 72 | 91.1 | — | — |
| Microgranular | 10 | 6.3 | — | 3 | 3.8 | — | 7 | 8.9 | — | — |
| Unknown | 25 | — | — | 15 | — | — | 10 | — | — | — |
| PML break point | — | — | — | — | — | — | — | — | — | .383 |
| BCR1 | 76 | 62.3 | — | 40 | 62.5 | — | 36 | 62.1 | — | — |
| BCR2 | 2 | 1.6 | — | 2 | 3.1 | — | — | — | — | — |
| BCR3 | 44 | 36.1 | — | 22 | 34.4 | — | 22 | 37.9 | — | — |
| Unknown | 61 | — | — | 30 | — | — | 31 | — | — | — |
ECOG, Eastern Cooperative Oncology Group; PML, promyelocytic leukemia.
Missing values were excluded in the calculation of P.
Statistically significant difference (P < .05).
Classification according to PETHEMA/GIMIMA criteria.6
Induction outcome
Patient follow-up was last updated in September 2018. Overall, 131 of 159 (82%) patients achieved complete hematological remission (CHR). Of the 28 remaining patients who failed to achieve complete remission, 21 experienced early death (ie, within 30 days after diagnosis; early-mortality rate, 13%). The main causes of death during induction were hemorrhage (11 patients, 52%), followed by infection (9 patients, 43%) and central nervous system thrombosis (one patient, 5%). The early-mortality rate was significantly higher in patients with high risk (23%) than in those with low risk (4%; P < .001). CHR rates according to ISAPL modeling were 91% and 73% for low- and high-risk patients, respectively (P = .004). In univariate logistic regression analyses, ISAPL modeling results were significantly associated with CHR (odds ratio [OR], 0.26; 95% CI, 0.17-0.66; P = .005). These results were consistent with those of the multivariate analysis (OR, 0.23; 95% CI, 0.1-0.63; P = .004), considering age, risk category, and gender as confounders (Table 3).
Univariate and multivariate analyses
| End points and model variables | Univariate analysis | Multivariate analysis | ||||||||
|---|---|---|---|---|---|---|---|---|---|---|
| HR | OR | 95% CI | P | HR | OR | 95% CI | P | |||
| CHR | ||||||||||
| ISAPL modeling: high vs low | — | 0.26 | 0.17 | 0.66 | .002 | — | 0.22 | 0.1 | 0.6 | .003 |
| Relapse-risk group: low vs intermediate vs high | — | 0.67 | 0.39 | 0.86 | .006 | — | 0.88 | 0.45 | 1.69 | .705 |
| Age at diagnosis: continuous variable | — | 0.4 | 0.2 | 0.79 | .008 | — | 0.39 | 0.2 | 0.78 | .008 |
| OS | ||||||||||
| ISAPL modeling: high vs low | 5.1 | — | 2.22 | 11.6 | <.001 | 6.1 | — | 2.46 | 15.4 | <.001 |
| Relapse-risk group: low vs intermediate vs high | 2.86 | — | 1.75 | 4.66 | <.001 | 1.91 | — | 1.1 | 3.41 | .027 |
| Age at diagnosis: continuous variable | 1.5 | — | 1.05 | 2.26 | .047 | 2.4 | — | 1.36 | 4.22 | .002 |
| DFS | ||||||||||
| ISAPL modeling: high vs low | 2.86 | — | 1.1 | 7.88 | .04 | 2.19 | — | 1.77 | 6.23 | .038 |
| Relapse-risk group: low vs intermediate vs high | 3.25 | — | 1.51 | 7 | .003 | 2.89 | — | 1.14 | 7.27 | .024 |
| Age at diagnosis: continuous variable | 1.14 | — | 0.57 | 2.28 | 0.704 | 1.14 | — | 0.45 | 2.89 | .78 |
| EFS | ||||||||||
| ISAPL modeling: high vs low | 3.96 | — | 2.05 | 7.65 | <.001 | 4.05 | — | 2 | 8.19 | <.001 |
| Relapse-risk group: low vs intermediate vs high | 2.69 | — | 1.77 | 4.1 | <.001 | 1.93 | — | 1.17 | 3.18 | .009 |
| Age at diagnosis: continuous variable | 1.34 | — | 0.93 | 1.93 | .105 | 1.77 | — | 1.1 | 2.9 | .02 |
HRs and ORs >1 or <1 indicate an increased or decreased risk, respectively, of an event for the first category listed. Relapse-risk group: classification according to PETHEMA/GIMEMA criteria.6
DFS, disease-free survival; EFS, event-free survival.
With a median follow-up time among survivors of 32 months (range, 1-101 months), the estimated 5-year OS rate was 78% (95% CI, 71% to 82%). Patients assigned to the high-risk group exhibited a significantly lower 5-year OS rate (55%; 95% CI, 40% to 68%) than patients assigned to the low-risk group (91%; 95% CI, 81% to 95%; P < .001; Figure 1A). The Cox proportional hazards model showed that the results of ISAPL modeling were independently associated with poor OS (HR, 5.77; 95% CI, 2.33-8.27; P < .001; Table 3).
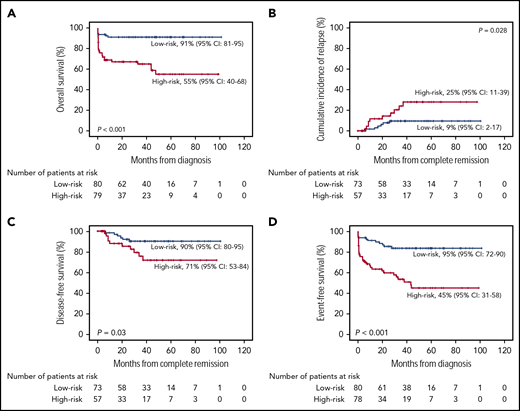
Patient survival. The probability of OS (A), CIR (B), DFS (C), and EFS (D) in patients with APL, according to ISAPL modeling.
Patient survival. The probability of OS (A), CIR (B), DFS (C), and EFS (D) in patients with APL, according to ISAPL modeling.
Postremission outcomes
Of the 131 patients who achieved CHR, 16 (12%) relapsed. Considering nonrelapse death as a competing cause of failure, the 5-year cumulative incidence of relapse (CIR) was 12% (95% CI, 7% to 17%). CIR rates for low- and high-risk patients were 9% (95% CI, 2% to 17%) and 25% (95% CI, 11% to 39%), respectively (P = .028; Figure 1B). The estimated 5-year disease-free survival (DFS) and event-free survival (EFS) rates were 87% (95% CI, 80% to 92%) and 70% (95% CI, 63% to 76%), respectively. Patients with a high ISAPL had a significantly lower DFS rate (71%; 95% CI, 53% to 84%) in comparison with patients with a low score (90%; 95% CI, 80% to 95%; P = .03; Figure 1C). This result was consistent with the multivariate proportional hazards analysis (HR, 2.25; 95% CI, 1.8-6.29; P = .012; Table 3). In agreement, the EFS rate was significantly lower in high-risk patients (45%; 95% CI, 31% to 58%) than in those with low risk (83%; 95% CI, 72% to 90%; P < .001; Figure 1D). Accordingly, ISAPL modeling results were associated with a shorter EFS, in an independent manner (HR, 3.97; 95% CI, 1.98-7.97; P < .001; Table 3).
Considering the PETHEMA/GIMEMA criteria for predicting relapse,6 the most frequently adopted in Europe and Latin America, we opted to evaluate the impact of ISAPL modeling separately in patients with low-, intermediate-, and high-risk disease. We also considered baseline features unrelated to disease, such as gender and age, to test possible interaction with our genetics score. Our results demonstrate that results of ISAPL modeling interacted with gender in outcome prediction (HR, 11.5; 95% CI, 1.54-84.9; P = .017), but not with age (HR, 1.04; 95% CI, 0.98-1.11; P = .162) or risk of relapse (HR, 2.24; 95% CI, 0.37-13.48; P = .375).
Internal data validation
The final prediction model was internally validated by using a bootstrap resampling procedure. The analysis was performed by using 1000 repetitions from the original database to assess model bias. Internal validation successfully resulted in an area under the curve (0.75; 95% CI, 0.64-0.83) very similar to that described for the original data. In addition, the resampling procedure yielded a mean and 95% CI virtually identical to the original data for all clinical end points. Although the pairwise hypothesis testing demonstrated significant differences across the distribution means, the procedure was found to be unstable for 1-year DFS and CIR rates because these end points were too close to the upper and lower survival probability boundaries, respectively. All results are summarized in Table 4.
Summary outcomes of patients according to the ISAPL modeling, considering the original data and bootstrap resampling
| Clinical end points | 1 y, % of mean (95% CI) | 2 y, % of mean (95% CI) | 5 y, % of mean (95% CI) | ||||||
|---|---|---|---|---|---|---|---|---|---|
| Low ISAPL | High ISAPL | P | Low ISAPL | High ISAPL | P | Low ISAPL | High ISAPL | P | |
| OS | — | — | <.001* | — | — | <.001* | — | — | <.001* |
| Original data | 91 (82-95) | 67 (55-76) | — | 91 (82-96) | 67 (55-76) | — | 91 (82-95) | 55 (40-68) | — |
| Bootstrap resampling | 91 (83-96) | 67 (56-77) | — | 91 (83-96) | 67 (56-77) | — | 91 (83-96) | 55 (38-67) | — |
| DFS | — | — | <.001† | — | — | <.001* | — | — | <.001* |
| Original data | 98 (90-100) | 88 (74-95) | 92 (82-97) | 85 (70-93) | — | 90 (78-95) | 72 (53-84) | — | |
| Bootstrap resampling | 98 (92-100) | 88 (74-96) | 92 (82-97) | 85 (71-94) | — | 90 (81-96) | 72 (51-84) | — | |
| EFS | — | — | <.001* | — | — | <.001* | — | — | <.001* |
| Original data | 91 (82-95) | 63 (51-73) | — | 85 (75-91) | 60 (47-70) | — | 83 (73-90) | 45 (31-58) | — |
| Bootstrap resampling | 91 (81-96) | 63 (52-75) | — | 85 (76-92) | 60 (48-71) | — | 84 (74-90) | 44 (32-60) | — |
| CIR | — | — | <.001† | — | — | <.001* | — | — | <.001* |
| Original data | 2 (0-8) | 10 (3-21) | — | 7 (2-17) | 13 (4-23) | 9 (2-17) | 25 (11-39) | — | |
| Bootstrap resampling | 1 (0-9) | 11 (4-22) | — | 8 (3-17) | 14 (4-25) | 9 (4-19) | 25 (14-43) | — | |
Welch 2-sample Student t test.
The Wilcoxon-Mann-Whitney test was used because of the instability caused by extreme values.
Discussion
Others and we have previously demonstrated that a relatively large number of genes are aberrantly expressed or frequently mutated in APL.10,-12,16,34,,-37 Most important, these genetic findings may be prognostically relevant in a clinical setting in which ATRA and anthracycline-based chemotherapy constitute the basis for induction therapy. In the current study, we hypothesized that if these molecular prognostic markers were applied together in a composite prognostic risk score, the resulting information could be more accurate than the use of single molecular markers. Such an approach has already been used in both AML33,38,-40 and myelodysplastic syndromes,41 although scoring systems for prognosis prediction in APL have not been explored to the same extent. To the best of our knowledge, the first study to propose a molecular risk score in APL was reported by Hecht et al. Although the sample size was limited (79 patients), the authors demonstrated that BAALC, ERG, and WT1 expression levels integrated into a score could offer a promising approach to monitoring patients with APL treated with ATRA and high doses of cytarabine.42,43 In our study, we extended this panel and demonstrated that gene mutations and aberrant gene expression combined could be a useful tool to better predict treatment outcomes in patients with APL, at least for those treated with ATRA in combination with chemotherapy. Our ISAPL modeling resulted in the identification of 2 highly distinct groups of patients with significant differences in remission rate, relapse, and survival.
There are 2 main reasons for the choice of these genetic markers in the present model. First, we included the genetic markers previously associated with prognosis in both APL and AML, to construct the ISAPL algorithm. In fact, standardized assays are already available for prognostication regarding patients with intermediate cytogenetic AML by using some of these genetic markers.44 Second, several of these candidates have been functionally evaluated by others and us,-48 to understand the biological significance described in the clinical setting. For instance, we have demonstrated that ΔNp73 exerts a critical role in cell survival, providing resistance to drug-induced apoptosis.45 Adhering to the same experimental strategy, researchers in several studies have demonstrated that FLT3-ITD mutations46 and overexpression of PIM247 and BAALC48 cooperate in the induction of a leukemic phenotype. Recently, Esnault et al demonstrated in APL mouse models that FLT3-ITD mutations severely blunt ATRA response. On the other hand, the combination of ATRA and ATO fully rescued the therapeutic response in FLT3-ITD APLs, restoring promyelocytic leukemia/retinoic acid receptor-α (PML/RARA) degradation, PML nuclear body reformation, P53 activation, and APL eradication.49 Our study further reinforces the biological importance of FLT3-ITD mutations rather than the FLT3 allelic ratio in the context of APL. In agreement with this finding, our data further suggest that the aberrant expression (low or high) of KMT2E, BAALC, and ΔNp73, both in vitro (using NB4/NB4-R2 cell lines as target cells) and in vivo (through murine bone marrow cells transplantation model from hCG-PML/RARA transgenic mice), modulates granulocytic differentiation pathways and directly affects the responsiveness of APL leukemic cells to ATRA-based therapy (A.R.L.-A., unpublished data). If our hypotheses were confirmed, these data could help to explain the molecular basis for a limited but successful response to ATRA-based therapy.
Despite these promising results, certain issues have to be considered before molecular monitoring can be used in APL, including the establishment of universal controls and the uniform definition of cutoff values. Currently, validation data in an independent patient cohort may constitute a problem in APL because of the increasing difficulty to identify patients treated with ATRA and chemotherapy around the globe. In our study, we opted to use a bootstrap resampling procedure to validate our data. In brief, this method allows assignment of measures of accuracy to sample estimates by sampling a dataset with random replacements.31,32 Although we acknowledge that this procedure may not be the best solution, it may represent a reasonable alternative to cross-validation data in cases of cohorts that lack validation. Two other questions could be applied: (1) how quickly the ISAPL modeling would be available for the medical team and (2) the financial cost of the molecular scoring process and its feasibility in LMICs. Considering that the time from diagnosis to treatment initiation is one of the most important steps for successful induction of therapy in acute leukemias, it is crucial that ISAPL modeling or other schemes for APL risk stratification42 be available to the medical team shortly after diagnosis. In our experience, with proper infrastructure, financial support, and an experienced technical team, a reference laboratory would be able to determine all genetic markers for ISPAL modeling within 24 to 48 hours. Moreover, it is likely that other prognostic markers would be identified and functionally evaluated. If so, they could be included in the model easily, if the preestablished inclusion criteria were properly met.
In addition, the progressive decline in sequencing costs over time and the possibility of obtaining high-quality gene quantification in most samples suggest that, in the near future, such an approach will become more widely available and could be incorporated into the routine practice of most clinical laboratories, even in countries with socioeconomic heterogeneity and limited financial resources, such as in Brazil. It may also lead to a decrease in prices of ATO administration (considering both intravenous and oral formulations), but we acknowledge that our modeling or any other prognostic risk score for APL42 may not apply to a different frontline treatment approach, such as ATO-based protocols.7,-9 However, for the time being, the ATRA-ATO combination is not approved as a frontline therapy for patients with APL in Latin America, and this scenario may endure for some years to come. Taking into consideration that measurable residual disease monitoring is of utmost importance in APL, ISAPL modeling could be useful in identifying patients who would benefit from a more frequent evaluation of PML-RARA transcripts in bone marrow aspirate samples and, if molecular relapse is detected earlier, the results of a second-line treatment with ATO-based protocols, combined or not with autologous hematopoietic stem cell transplantation, are encouraging.
These lines of evidence argue in favor of continuum initiatives that will improve the current scenario in LMICs. The very successful implementation of the IC-APL represents the most important of these efforts: even working with limited resources, significant improvements were achieved in quality of care and treatment outcome of patients with APL.4 The resulting outcomes showed the feasibility of obtaining better results over historical controls,1 although still inferior to those reported in HIC.5 ISAPL modeling appears to be a viable alternative for identifying patients who need to be monitored and treated differently. Our molecular score could be considered when designing clinical trials that specifically target high-risk APL patients or could be extrapolated to another more challenging leukemia subset, such as AML. We believe that a better understanding of the molecular limitation of patientresponse to ATRA and anthracycline-based chemotherapy could serve as the basis for future initiatives aimed at changing the current scenario for APL treatment in LMICs.
Presented at the Seventh International Symposium on Acute Promyelocytic Leukemia, Rome, Italy, 25 September 2017, and was a tomy’s (Teva’s Orphan Hematological Malignancies award for Young hematologists) finalist.
The publication costs of this article were defrayed in part by page charge payment. Therefore, and solely to indicate this fact, this article is hereby marked “advertisement” in accordance with 18 USC section 1734.
Acknowledgments
The authors are grateful to all members of the International Consortium on Acute Promyelocytic Leukemia of the American Society of Hematology for sharing data, providing relevant scientific suggestions, and editing the manuscript.
This work was supported by Fundação de Amparo a Pesquisa do Estado de São Paulo (FAPESP; grant 1998/14247-6) and Conselho Nacional de Desenvolvimento Científico e Tecnológico (CNPq; grant 573754/2008-0).
Authorship
Contribution: A.R.L.-A. conceived and designed the study, performed the experiments, analyzed and interpreted the data, performed the statistical analyses, and drafted the article; J.L.C.-S., D.A.P.-M., and L.C.K. updated the clinical data, performed the experiments, collected the data, and reviewed the paper; D.R.S. performed the bootstrap resampling analyses, reviewed the statistical analysis, and reviewed the paper; R.A.M.M., R.B., K.P., R.P., E.C.N., E.M.F., A.B.G., F.K., M.d.L.C., I.B., and V.R. provided the samples, updated the clinical data, and reviewed the paper; A.K., M.S.T., R.C.R., R.D., A.G., B.L., P.J.M.V., F.L.-C., M.A.S., N.B., and E.M.R. designed the treatment protocol and reviewed the paper; and E.M.R. gave the final approval of the submitted version.
Conflict-of-interest disclosure: The authors declare no competing financial interests.
Francesco Lo-Coco died on 3 March 2019.
Correspondence: Eduardo M. Rego, Hematology Division, Department of Internal Medicine, Faculdade de Medicina, University of Sao Paulo, Prédio dos Ambulatórios, 1° andar, Av. Dr. Enéas Carvalho de Aguiar, 155, São Paulo, SP 05403-000, Brazil; e-mail: eduardo.rego@fm.usp.br.

This feature is available to Subscribers Only
Sign In or Create an Account Close Modal