

TO THE EDITOR:
Recently, biallelic (“double hit”) TP53 inactivation, occurring in 2% to 4% of newly diagnosed multiple myeloma (MM) patients, was identified as an ultimate high-risk feature of MM, being associated with median survival of <2 years.1-3 We and others have shown that the incidence of TP53 mutations4-6 and deletion of the arm p13 of chromosome 17 (del17p)7 increases with the progression of the disease. The implications of monoallelic TP53 lesions for the clinical outcome remain controversial,1,8,9 but clonal selection and evolution is a common feature of myeloma progression,10-15 and patients with TP53 wild-type (WT) or monoallelic inactivation may present a double hit on relapse. Here, we addressed the hypothesis that sequential acquisition of TP53 hits lead to a gain of proliferative fitness of MM cancer cells, inducing the expansion and domination of the affected clones within the patient’s bone marrow. To test this hypothesis, we established fluorescence-marked isogenic AMO-1 MM sublines with WT, mono-, and biallelic TP53 events and co-cultivated these cells in different in vitro competition assays. In our model, we were able to observe clonal evolution and estimate competitive advantages of both mono- and biallelic TP53 variants. Strikingly, we demonstrate that subclones with TP53 double hits outcompete and overgrow other TP53 variants. Reflecting these results, a meta-analysis including publicly available data sets confirms single- and double-hit myelomas to be significantly enriched in relapsed patients.4,5,7,12,16-18
The TP53 WT MM cell line AMO-1 was used to engineer mono- or biallelic TP53 altered variants by CRISPR/Cas9 and sleeping beauty techniques as previously described14,19,20 (supplemental Figure 1, available on the Blood Web site). To track respective cells using flow cytometry, we stably transfected mutant and WT TP53 subclones with genes for enhanced green fluorescent protein or red fluorescent protein (LSS-mKate2)21 fluorescent proteins (Figure 1A). This allowed for direct quantification and comparison of cell fitness, impacted by the different TP53 lesions induced, independently of other factors such as treatment, genetic background, basal proliferation rate, or metabolism.
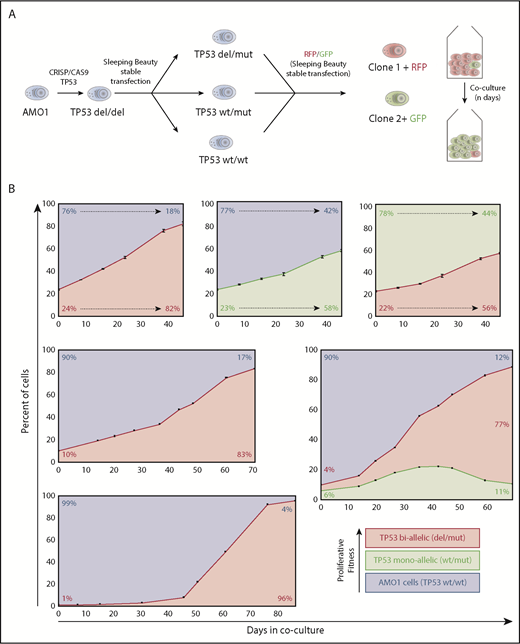
Hierarchy of TP53 alterations in myeloma. (A) Experimental approach to produce mono- and biallelic TP53 fluorescence-tagged clones. (B) Clonal competition assays of TP53 biallelic (red), TP53 monoallelic (yellow), and TP53 WT AMO1 cells (purple). Top-row experiments were performed in triplicate. The initial percentage of the subclone(s) at day 0 and at the end of the experiment is included in each figure. The share of the different clones based on the fluorescence signals of enhanced green fluorescent protein and/or LSS-Kate2 red fluorescent protein was determined every 4 to 14 days (black dots/bars). Error bars for the top-row figures represent the standard deviation based on 3 independent experiments.
Hierarchy of TP53 alterations in myeloma. (A) Experimental approach to produce mono- and biallelic TP53 fluorescence-tagged clones. (B) Clonal competition assays of TP53 biallelic (red), TP53 monoallelic (yellow), and TP53 WT AMO1 cells (purple). Top-row experiments were performed in triplicate. The initial percentage of the subclone(s) at day 0 and at the end of the experiment is included in each figure. The share of the different clones based on the fluorescence signals of enhanced green fluorescent protein and/or LSS-Kate2 red fluorescent protein was determined every 4 to 14 days (black dots/bars). Error bars for the top-row figures represent the standard deviation based on 3 independent experiments.
In a first set of experiments, we co-cultivated TP53 double-hit cells with WT/WT cells at a ratio of 1:3. At day 21, the double-hit clone significantly expanded and reached 50% of the cell population (Figure 1B, top left). Likewise, the monoallelic TP53 variant in a similar experimental setup outcompeted WT cells, but the time required to represent the majority of cells in the coculture was longer (38 days). When mono- and biallelic TP53 inactivated clones competed with each other at a ratio of 1:3, it took 35 days until the biallelic clone dominated the cell culture (Figure 1B, top right). Taken together, an increasing proliferative capacity to outcompete other subclones was observed from TP53 WT to monoallelic loss to biallelic deficiency.
Next, we investigated the effects of the initial clonal burden on the course of our model. Setting TP53 biallelic cells in competition to WT cells, at an initial share of 1:3, it took the mutant clone 21 days to reach a share of 50% of the culture; at an initial ratio of 1:9, it took 45 days; and at 1:99, it required up to 58 days (Figure 1B, left). These results demonstrate that the dynamics underlying the cell fitness competition are dependent on the amount of tumor subclone within the experiment. This might explain in part the positive correlation of deep responses and prolonged progression-free survival in MM patients. In fact, an almost linear progression was observed in our model with a high input of the more malignant clone (Figure 1B, top-side graphs), whereas a sigmoidal growth trajectory, with an R2 of 0.995, was observed in our experimental settings with low initial burden of biallelic tumor cells (Figure 1B, bottom right). Interestingly, our observations correspond very well with previously published mathematical models describing tumor growth in other cancers.22,23 Our model provides a practical approach to better assess and compare fitness induced by different genetic alterations in vitro. This is particularly well illustrated by an experiment in which a triple combination competition assay with initial numbers of 90% TP53 WT/WT cells, 6% monoallelic, and 4% of biallelic TP53-lesion clones. Initially, clonal dynamics led to increase of both TP53-deficient clones (double and monoallelic hit) at the expense of TP53 WT/WT cells, but by day 40, the growth advantage inherent to the biallelic clone outcompeted the single-hit model and finally inverted the growth dynamics of the monoallelic clone. Such multiple clone competition dynamics have previously been modeled in silico by Baldow et al, and in fact, our in vitro experiments correspond very well with their predictions.24 Taken together, we provide first evidence of survival benefits through monoallelic TP53 events without the selection pressure of therapy over TP53 WT cells. This advantage is then even further increased by double hits to TP53.
Mechanistically, we hypothesized this increased proliferative capacity to be the result of a dysfunctional p53 signaling pathway due to the mutated TP53 gene. To exclude that other proliferation genes are involved in the growth advantage observed in our model, we applied bulk RNA sequencing to compare the whole transcriptome of the WT vs the CRISPR manipulated cells. This analysis revealed a clear difference in the transcriptomes: ∼900 genes and 14 signaling pathways from the KEGG database were differentially regulated in TP53 mutant compared with the WT cells (supplemental Tables 1 and 2). Interestingly, all 14 signaling pathways were downregulated in TP53 mutant cells. Among these pathways, we also detected the p53 signaling pathway as significantly downregulated together with the ubiquitin ligase MDM2, which is key in limiting the p53 growth-suppressive function in general and in stabilizing the expression of the oncogenic p53 mutant in particular (Figure 2). The significantly downregulated signaling pathways included chemokine signaling, oxidative phosphorylation, and antigen processing and presentation. These differences on the transcriptomic level well reflect the biology of ultra-high-risk disease, frequently presenting with extramedullary disease, increased glucose uptake on positron emission tomography, and reduced susceptibility to immunotherapies. Vice versa, the top upregulated pathway in TP53 mutated cells was Hippo signaling, mainly representing increased cell division and proliferation, again paralleling the results from clonal competition assays. Together, our RNA-sequencing analysis supports the concept of an increased fitness level of TP53 mutated cells and confirms our engineered AMO-1 knockout cells as a model system to study the impact of the TP53 mutations on myeloma biology.
![Figure 2. Differential gene and pathway expression analysis of TP53 mutant compared with WT AMO-1 cells. (A) Principal-component analysis (PCA) projections of transcriptomes of AMO-1 (TP53 WT) and AMO-1–derived TP53 mutant cells (TP53 del/mut). The variability of the data set along principal component 1 (PC1) is 94% and along principal component 2 (PC2) is 4%. (B) Volcano plot indicating differentially expressed genes in TP53 mutant relative to TP53 WT AMO-1 cells. 499 significantly downregulated genes are shown in blue and 393 significantly upregulated genes in red (cutoff: log2 fold change of 1 and .05 adjusted P value). (C) Analysis of TP53 messenger RNA expression levels (transcripts per million [TPM]) shows similar expression values in AMO-1 (TP53 WT) and AMO-1–derived TP53 mutant cells (TP53 del/mut). (D) Gene set enrichment analysis (GSEA) of KEGG pathways (MsigDB) significantly regulated in TP53 mutant relative to TP53 WT AMO-1 cells. For all pathways shown, a false discovery rate q-value of <0.25 was chosen as cutoff for exploratory data analysis. (E) Gene set enrichment analysis enrichment plot for the p53 signaling pathway (KEGG) indicates a downregulation in TP53 mutant cells. (F) Bar plot for all differentially expressed genes of the p53 signaling pathway (KEGG). Log2 fold changes of genes downregulated in TP53 mutant cells are shown in blue and upregulated genes in red. Error bars indicate the standard error estimate for the log2 fold change in TP53 mutant relative to TP53 WT AMO-1 cells.](https://ash.silverchair-cdn.com/ash/content_public/journal/blood/134/10/10.1182_blood.2019000080/3/m_bloodbld2019000080f2.png?Expires=1765954943&Signature=Ir2XMi~L3Qi6GPUvlpc3fQrhhaU1x03h2ml3Jl4vNf3NeyuG-sGCuUWjnVITeHwwU5st-Ek1~Dj5xPO-65cU3zAMnzZLebMBQkzG-XzSLxbnL-AruF4OEc-S1IYOTAwsG8YtM3dVuSQ9HEVIVoA0JvUA3IpcEig-5o6n-FjS44amCO2ymanWqY6ph-M1lMJxDp5B6fjK63Mo7r2r9R-G21mK8Mhoxh1wy7Gpjamva7uW0e7b8HFMFTqIIqiwhj4Xs3BtZTJm2BqM-l7bQpJ7BRsKugkVwYAeaZ8NmBagYRTiB0J0B7~XR8pJIsCYpw81r-OPnvcwK4MSGe-4WoKJRw__&Key-Pair-Id=APKAIE5G5CRDK6RD3PGA)
Differential gene and pathway expression analysis of TP53 mutant compared with WT AMO-1 cells. (A) Principal-component analysis (PCA) projections of transcriptomes of AMO-1 (TP53 WT) and AMO-1–derived TP53 mutant cells (TP53 del/mut). The variability of the data set along principal component 1 (PC1) is 94% and along principal component 2 (PC2) is 4%. (B) Volcano plot indicating differentially expressed genes in TP53 mutant relative to TP53 WT AMO-1 cells. 499 significantly downregulated genes are shown in blue and 393 significantly upregulated genes in red (cutoff: log2 fold change of 1 and .05 adjusted P value). (C) Analysis of TP53 messenger RNA expression levels (transcripts per million [TPM]) shows similar expression values in AMO-1 (TP53 WT) and AMO-1–derived TP53 mutant cells (TP53 del/mut). (D) Gene set enrichment analysis (GSEA) of KEGG pathways (MsigDB) significantly regulated in TP53 mutant relative to TP53 WT AMO-1 cells. For all pathways shown, a false discovery rate q-value of <0.25 was chosen as cutoff for exploratory data analysis. (E) Gene set enrichment analysis enrichment plot for the p53 signaling pathway (KEGG) indicates a downregulation in TP53 mutant cells. (F) Bar plot for all differentially expressed genes of the p53 signaling pathway (KEGG). Log2 fold changes of genes downregulated in TP53 mutant cells are shown in blue and upregulated genes in red. Error bars indicate the standard error estimate for the log2 fold change in TP53 mutant relative to TP53 WT AMO-1 cells.
Differential gene and pathway expression analysis of TP53 mutant compared with WT AMO-1 cells. (A) Principal-component analysis (PCA) projections of transcriptomes of AMO-1 (TP53 WT) and AMO-1–derived TP53 mutant cells (TP53 del/mut). The variability of the data set along principal component 1 (PC1) is 94% and along principal component 2 (PC2) is 4%. (B) Volcano plot indicating differentially expressed genes in TP53 mutant relative to TP53 WT AMO-1 cells. 499 significantly downregulated genes are shown in blue and 393 significantly upregulated genes in red (cutoff: log2 fold change of 1 and .05 adjusted P value). (C) Analysis of TP53 messenger RNA expression levels (transcripts per million [TPM]) shows similar expression values in AMO-1 (TP53 WT) and AMO-1–derived TP53 mutant cells (TP53 del/mut). (D) Gene set enrichment analysis (GSEA) of KEGG pathways (MsigDB) significantly regulated in TP53 mutant relative to TP53 WT AMO-1 cells. For all pathways shown, a false discovery rate q-value of <0.25 was chosen as cutoff for exploratory data analysis. (E) Gene set enrichment analysis enrichment plot for the p53 signaling pathway (KEGG) indicates a downregulation in TP53 mutant cells. (F) Bar plot for all differentially expressed genes of the p53 signaling pathway (KEGG). Log2 fold changes of genes downregulated in TP53 mutant cells are shown in blue and upregulated genes in red. Error bars indicate the standard error estimate for the log2 fold change in TP53 mutant relative to TP53 WT AMO-1 cells.
Thus far, no comparable models investigating clonal dynamics of TP53-affected MM tumor subclones have been published by other groups. Aiming validation of our AMO1-derived early insights, we successfully established single- and double-hit TP53 mutants in MM1.S cells. This cell line represents one of few additional, commercially available WT TP53 cell lines. Regrettably, we faced complex growth kinetics in MM1.S due to its semiadherent growth pattern of the cells. Thus, our work remains limited to a single-cell line model, and additional effort is needed to establish alternative in vitro models to further explore the impact of altered TP53 in MM. Yet, we provide first evidence that the increase of TP53 mono- and biallelic alterations in relapsed MM is driven by an increased proliferative fitness of the affected subclone independently of other factors, including selective pressure from anti-MM therapy or the microenvironment. Similar results were obtained in vitro with mutations in genes of drug resistance (survival fitness).25 This underscores the power of clonal competition assays to decipher the effect of genomic lesions in tumors to better understand their impact on progression and disease relapse in MM.
The online version of this article contains a data supplement.
Acknowledgments
This work was supported by the Deutsche Forschungsgemeinschaft (KFO216), the IZKF Würzburg, and the CDW Stiftung. U.M. was supported by a grant from the German Excellence Initiative to the Graduate School of Life Sciences, University of Würzburg. M.G. was supported by the CRIS Cancer Foundation. L.R. and K.M.K. were supported by the Würzburg Mildred Scheel Nachwuchszentrum of the German Cancer Aid.
Authorship
Contribution: T.S., K.M.K., and S.B. designed the research; U.M., N.M., C.V., M.R., P.A., and S.B. performed the experiments; all authors were involved in the analysis and interpretation of the data; K.M.K, L.R., T.S., and S.B. wrote the manuscript; and all authors approved the manuscript.
Conflict-of-interest disclosure: The authors declare no competing financial interests.
Correspondence: K. Martin Kortüm, Department of Internal Medicine II, University Hospital of Würzburg, Oberdürrbacherstr.6, 97070 Würzburg, Germany; e-mail: kortuem_m@ukw.de.

This feature is available to Subscribers Only
Sign In or Create an Account Close Modal