

Key Points
Depleting RUNX1 or editing-out RUNX1 eR1, or treatment with BET protein antagonist, induces lethality in AML expressing mtRUNX1.
EMs of RUNX1 depletion induce more lethality in HPCs expressing germline mtRUNX1 from FPD AML than HPCs from FPD.

Abstract
RUNX1 transcription factor regulates normal and malignant hematopoiesis. Somatic or germline mutant RUNX1 (mtRUNX1) is associated with poorer outcome in acute myeloid leukemia (AML). Knockdown or inhibition of RUNX1 induced more apoptosis of AML expressing mtRUNX1 versus wild-type RUNX1 and improved survival of mice engrafted with mtRUNX1-expressing AML. CRISPR/Cas9-mediated editing-out of RUNX1 enhancer (eR1) within its intragenic super-enhancer, or BET protein BRD4 depletion by short hairpin RNA, repressed RUNX1, inhibited cell growth, and induced cell lethality in AML cells expressing mtRUNX1. Moreover, treatment with BET protein inhibitor or degrader (BET–proteolysis targeting chimera) repressed RUNX1 and its targets, inducing apoptosis and improving survival of mice engrafted with AML expressing mtRUNX1. Library of Integrated Network–based Cellular Signatures 1000–connectivity mapping data sets queried with messenger RNA signature of RUNX1 knockdown identified novel expression-mimickers (EMs), which repressed RUNX1 and exerted in vitro and in vivo efficacy against AML cells expressing mtRUNX1. In addition, the EMs cinobufagin, anisomycin, and narciclasine induced more lethality in hematopoietic progenitor cells (HPCs) expressing germline mtRUNX1 from patients with AML compared with HPCs from patients with familial platelet disorder (FPD), or normal untransformed HPCs. These findings highlight novel therapeutic agents for AML expressing somatic or germline mtRUNX1.
Introduction
RUNX1 is a master-regulator transcription factor involved in normal and malignant hematopoiesis.1-3 RUNX1 encodes for the sequence-specific, DNA-binding subunit of the core binding factor (CBF) complex.3 Binding to its cofactor CBFβ promotes the DNA binding and stability of RUNX1.3,4 RUNX1 has a highly conserved, DNA-binding “Runt” homology domain (spanning amino acids 50-177) and a more C-terminal transcription activation domain (spanning amino acids 291-371).2,5 RUNX1 super-enhancer (>170 kb) with its enhancer epicenter (+24-kb enhancer or eR1) is highly conserved, spans the entire intron 1 of RUNX1, and is located between its P1 and P2 promoters.6-8 The eR1 is occupied by multiple transcription factors, including TAL1, GATA2, RUNX1, PU.1, and LMO2, as well as by the BET protein (BETP) BRD4,2,7,8 controlling transcription of RUNX1.9,10 RUNX1 also cooperates with other transcription factors (eg, Ets1, PU.1, CEBPα, TAL1, LMO2) and with co-factors (eg, the histone acetyltransferase EP300) at target gene enhancers and gene promoters to regulate transcription.3,11-13 RUNX1 target genes include IL-3, GM-CSF, c-FMS, TCR-α, PU.1, MPL, MPO, MYC, and multiple ribosomal genes.14-17 Consistent with this, lack of RUNX1 causes defective hematopoiesis and is embryonic lethal.2,17 In addition to chromosomal translocations involving the RUNX1 locus,3,18,19 somatic, heterozygous RUNX1 mutations also occur in myelodysplastic syndromes (MDS) (∼10%) and chronic myelomonocytic leukemia (CMML) (up to 37%), as well as in secondary (post-MDS or post–myeloproliferative neoplasm [MPN]) or de novo (∼10%) AML.20-25
The majority of mutant RUNX1 (mtRUNX1) are missense mutations, large deletions, or truncation mutations in the “Runt” homology domain or in the transactivation domain.3,20,21 Behaving mostly as loss-of-function mutations, they confer relative resistance to standard chemotherapy and are associated with an unfavorable prognosis in AML.20,22,23 Loss-of-function mtRUNX1 expands hematopoietic stem-progenitor cells and myeloid progenitors, with impaired differentiation and resistance to genotoxic stress, attenuated unfolded protein response, and decreased ribosome biogenesis.14 In AML, RUNX1 mutations often co-occur with mutations in FLT3, MLL-PTD, DNMT3A, ASXL1, CEBPA, NRAS, KIT, and IDH1/2.21,22,26 Germline, monoallelic, and intragenic mutations and deletions in RUNX1 cause the highly penetrant (∼40%) autosomal dominant familial platelet disorder (FPD), with a propensity to evolve into myeloid malignancy (FPD-MM).20,26-28 Previous reports showed that wild-type RUNX1 (wtRUNX1) activity is necessary to sustain leukemia caused by RUNX1-RUNXT1, CBFβ-SMMHC, and MLL-ENL or MLL-AF9.26,29-31 However, in AML expressing mtRUNX1, the effects of knockdown of RUNX1 have not been determined. The present studies show that short hairpin RNA (shRNA)-mediated knockdown of mtRUNX1 and wtRUNX1 inhibited in vitro and in vivo AML growth and survival of immune-depleted mice engrafted with AML cells expressing mtRUNX1. Our findings also show that BETP inhibitor (BETi) or degrader (proteolysis targeting chimera [PROTAC])32 depletes BRD4 occupancy at the RUNX1 eR1, consistent with which editing-out of the RUNX1 eR1 was also lethal to mtRUNX1 expressing AML cells. Expression-mimickers (EMs) were discovered by querying the Library of Integrated Network–based Cellular Signatures (LINCS) 1000-CMap (connectivity mapping) with the RNA sequencing (RNA-Seq) signature of RUNX1-knockdown in mtRUNX1-expressing AML cells.33,34 These EMs include narciclasine (natural plant alkaloid), fenbendazole (benzimidazole anthelmintic), cinobufagin (bufanolide steroid), and anisomycin (antibiotic).35-38 Treatment with the EMs depleted RUNX1 and its target gene expression levels, as well as induced in vitro and in vivo lethality in AML cells expressing somatic or germline mtRUNX1 vs normal or FPD hematopoietic progenitor cells (HPCs).
Materials and methods
Cell lines and cell culture
Human AML cell lines Mono-Mac-1 (MLL-AF9), OCI-AML5, and OCI-AML2 cells were obtained from the DSMZ. HEL92.1.7 and THP1 cells were obtained from the ATCC. Mono-Mac-1, HEL92.1.7, and THP1 cells were cultured in RPMI-1640 media with 20% fetal bovine serum and 1% penicillin/streptomycin. OCI-AML5 and OCI-AML2 cells were cultured in minimum essential medium alpha with 20% fetal bovine serum and 1% penicillin/streptomycin. OCI-AML5 cells were supplemented with 10 ng/mL of granulocyte-macrophage colony-stimulating factor (PeproTech).
Primary AML blast cells
Patient-derived (PD) mtRUNX1 and wtRUNX1 expressing AML cells and normal cord blood samples were obtained with informed consent as part of a clinical protocol approved by the Institutional Review Board of The University of Texas, M.D. Anderson Cancer Center. Samples were processed, and next-generation sequence analysis was performed as previously described.32
RNA isolation and quantitative polymerase chain reaction
Assessment of apoptosis by annexin V staining
Colony growth assay
After the designated treatments, cells were harvested, and colony growth assays were performed as previously described.39
Chromatin immunoprecipitation and real-time PCR
OCI-AML5 cells were treated with OTX015 or ARV-771 for 8 to 16 hours. Chromatin immunoprecipitation (ChIP) and quantitative PCR (qPCR) were performed as previously described.39
Detailed methods for RNA-Seq analysis, ChIP sequencing (ChIP-Seq) analysis, ATAC sequencing (ATAC-Seq) analysis, reverse phase protein array analysis, and in vivo studies performed in mice are provided in the supplemental Methods (available on the Blood Web site).
Results
Presence of mtRUNX1 and comutations confer inferior median survival in patients aged <60 years with AML exhibiting mtRUNX1
Using next-generation sequencing, we determined the incidence of RUNX1 mutations in 655 patients with relapsed or newly diagnosed, de novo and secondary AML (post-MPN and post-MDS) managed at the M.D. Anderson Cancer Center from July 2013 to June 2016. Of the 141 patients with AML harboring a RUNX1 mutation, 84 were documented as de novo AML, 47 as post-MDS secondary AML, and 10 as post-MPN secondary AML (supplemental Figure 1A). Supplemental Table 1 shows the site of the mutations in RUNX1 in the 141 patients with AML harboring RUNX1 mutation. The most frequent comutations with mtRUNX1 observed in decreasing frequency were in ASXL1, FLT3-ITD, TET2, DNMT3A, IDH1/2, RAS, PTPN11, JAK2, P53, and EZH2 genes (supplemental Figure 1B). The Circos plot depicting mutations and comutations with mtRUNX1 in this M.D. Anderson Cancer Center cohort is shown in supplemental Figure 1C. Patients aged <60 years with AML expressing mtRUNX1 exhibited significantly inferior median survival (18.4 months) than those without mtRUNX1 (48.4 months) (P < .001) (supplemental Figure 1D). However, the presence of mtRUNX1 did not significantly affect the median survival in patients aged >60 years (P > .1). These findings are consistent with those reported by others in patients with AML of comparable demographic and disease characteristics.21-23
RUNX1 knockdown inhibits growth and induces apoptosis of AML cells expressing mtRUNX1
We next transduced 2 separate shRNAs targeting RUNX1 into OCI-AML5 cells. These cells express mtRUNX1, along with co-mutations in ASXL1, EZH2, IKZF2, and PTPN11 (supplemental Figure 1E-F). The 2 shRNA target sequences in RUNX1 are shown in supplemental Figure 1G and do not distinguish between mutant versus wild-type transcripts of RUNX1 in the AML cells studied here. RUNX1 shRNA treatment significantly inhibited RUNX1 messenger RNA (mRNA) and protein levels, as well as reduced the mRNA and/or protein expression of RUNX1 target genes, including MYC, MYB, PU.1, and BCL2, as well as of myeloperoxidase (MPO); cell cycle inhibitor p27 levels were concomitantly upregulated in OCI-AML5 cells (Figure 1A-B). Reversed phase protein array analysis also showed that shRNA to RUNX1 downregulated 52 proteins and upregulated 31 proteins, which included reduction in p-RB, c-Myc, BCL-2, and NOTCH1 levels, with concomitant induction of p27 levels in OCI-AML5 cells (supplemental Figure 2A). Consistent with this finding, knockdown of RUNX1 induced myeloid differentiation, including an increase in the percentage of cells expressing CD11b and CD86 (supplemental Figure 2B-D). shRNA to RUNX1 also repressed RUNX1 expression, induced phenotypic markers of differentiation, and induced apoptosis of mtRUNX1-expressing Mono-Mac-1 cells (supplemental Figure 2E-F). Although shRNAs to RUNX1 repressed RUNX1 mRNA and protein levels to a similar extent in OCI-AML2, THP1, and HEL92.1.7 cells, all expressing wtRUNX1 (supplemental Figure 2G-H), they induced significantly more apoptosis in OCI-AML5 and Mono-Mac-1 (Figures 1D; supplemental Figure 2E,I).
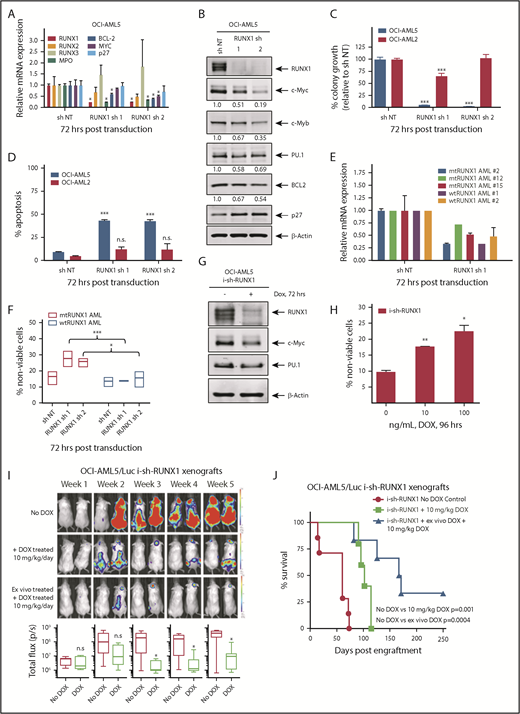
Depletion of RUNX1 by shRNA diminishes RUNX1 target gene expression and induces greater in vitro lethality in mtRUNX1-expressing than wtRUNX1 AML BPCs, as well as attenuates leukemia engraftment and significantly prolongs survival of mice bearing luciferase-expressing OCI-AML5 xenografts. (A) Relative mRNA expression of RUNX1, RUNX2, RUNX3, MPO, BCL-2, and MYC in OCI-AML5 cells transduced with non-target shRNA (sh NT) or RUNX1 shRNA for 72 hours. Expression of each mRNA was normalized to GAPDH and to sh NT. (B) Immunoblot analysis of OCI-AML5 cells transduced with sh NT or RUNX1 shRNA for 72 hours. The numbers beneath the bands represent densitometry analysis. (C) Colony growth of OCI-AML5 and OCI-AML2 cells transduced with sh NT or RUNX1 shRNA for 72 hours. ***P < .005 compared with sh NT–transduced cells. (D) Percent apoptosis in OCI-AML5 and OCI-AML2 cells transduced with sh NT or RUNX1 shRNA for 72 hours. ***P < .005 compared with sh NT-transduced cells. (E) qPCR analysis for RUNX1 expression in PD mtRUNX1 AML cells (n = 3) and wtRUNX1 AML (n = 2) transduced with sh NT or RUNX1 shRNA for 72 hours. Relative mRNA expression was normalized to GAPDH and compared with sh NT expression levels. (F) PD CD34+ mtRUNX1 (n = 3) and wtRUNX1 AML (n = 2) samples were transduced with sh NT or RUNX1 shRNA for 72 hours. The percentage of nonviable cells was determined by using flow cytometry. *P < .05, ***P < .005 relative to sh NT cells. (G) Immunoblot analysis after 72 hours of 100 ng/mL doxycycline (DOX) treatment in OCI-AML5 cells expressing a DOX-inducible shRNA against RUNX1. (H) OCI-AML5 i-sh-RUNX1 cells were induced with the indicated concentrations of DOX for 96 hours. At the end of treatment, cells were stained with propidium iodide, and the percent nonviable cells were determined according to flow cytometry. Columns, mean of 3 experiments; bars, standard error of the mean. *P < .05, **P < .01 relative to no-DOX treatment. (I) Bioluminescent imaging of mice after infusion of OCI-AML5/GFP-Luc cells transduced with DOX-inducible RUNX1-shRNA (i-sh-RUNX1) and treated daily with 10 mg/kg of DOX. Mice were also infused with OCI-AML5/GFP-Luc cells that had been ex vivo treated with DOX for 72 hours, then treated daily with 10 mg/kg of DOX to further suppress leukemia engraftment. The box plots beneath show the total bioluminescent flux for the mice treated with DOX vs no DOX over 5 weeks of treatment. (J) The survival of the mice in the 3 cohorts is represented by a Kaplan-Meier survival plot. n.s., not significant.
Depletion of RUNX1 by shRNA diminishes RUNX1 target gene expression and induces greater in vitro lethality in mtRUNX1-expressing than wtRUNX1 AML BPCs, as well as attenuates leukemia engraftment and significantly prolongs survival of mice bearing luciferase-expressing OCI-AML5 xenografts. (A) Relative mRNA expression of RUNX1, RUNX2, RUNX3, MPO, BCL-2, and MYC in OCI-AML5 cells transduced with non-target shRNA (sh NT) or RUNX1 shRNA for 72 hours. Expression of each mRNA was normalized to GAPDH and to sh NT. (B) Immunoblot analysis of OCI-AML5 cells transduced with sh NT or RUNX1 shRNA for 72 hours. The numbers beneath the bands represent densitometry analysis. (C) Colony growth of OCI-AML5 and OCI-AML2 cells transduced with sh NT or RUNX1 shRNA for 72 hours. ***P < .005 compared with sh NT–transduced cells. (D) Percent apoptosis in OCI-AML5 and OCI-AML2 cells transduced with sh NT or RUNX1 shRNA for 72 hours. ***P < .005 compared with sh NT-transduced cells. (E) qPCR analysis for RUNX1 expression in PD mtRUNX1 AML cells (n = 3) and wtRUNX1 AML (n = 2) transduced with sh NT or RUNX1 shRNA for 72 hours. Relative mRNA expression was normalized to GAPDH and compared with sh NT expression levels. (F) PD CD34+ mtRUNX1 (n = 3) and wtRUNX1 AML (n = 2) samples were transduced with sh NT or RUNX1 shRNA for 72 hours. The percentage of nonviable cells was determined by using flow cytometry. *P < .05, ***P < .005 relative to sh NT cells. (G) Immunoblot analysis after 72 hours of 100 ng/mL doxycycline (DOX) treatment in OCI-AML5 cells expressing a DOX-inducible shRNA against RUNX1. (H) OCI-AML5 i-sh-RUNX1 cells were induced with the indicated concentrations of DOX for 96 hours. At the end of treatment, cells were stained with propidium iodide, and the percent nonviable cells were determined according to flow cytometry. Columns, mean of 3 experiments; bars, standard error of the mean. *P < .05, **P < .01 relative to no-DOX treatment. (I) Bioluminescent imaging of mice after infusion of OCI-AML5/GFP-Luc cells transduced with DOX-inducible RUNX1-shRNA (i-sh-RUNX1) and treated daily with 10 mg/kg of DOX. Mice were also infused with OCI-AML5/GFP-Luc cells that had been ex vivo treated with DOX for 72 hours, then treated daily with 10 mg/kg of DOX to further suppress leukemia engraftment. The box plots beneath show the total bioluminescent flux for the mice treated with DOX vs no DOX over 5 weeks of treatment. (J) The survival of the mice in the 3 cohorts is represented by a Kaplan-Meier survival plot. n.s., not significant.
In addition, knockdown of RUNX1 had no significant effects on cell proliferation and phenotypic markers of differentiation in OCI-AML2 (supplemental Figure 2J-K). shRNA-mediated knockdown of RUNX1 in 3 samples of patient-derived (PD) CD34+ primary AML blast progenitor cells (BPCs) expressing mtRUNX1 (samples 2, 12, and 15 in supplemental Figure 1E) vs 2 samples expressing wtRUNX1 (samples 1 and 2 in supplemental Figure 1H) inhibited mRNA expression of RUNX1 (Figure 1E) but induced significantly more lethality in the primary AML BPCs expressing mtRUNX1 compared with wtRUNX1 (Figure 1F). Doxycycline exposure of OCI-AML5 cells transduced with luciferase and a doxycycline-inducible construct of shRNA to RUNX1 (i-sh-RUNX1) inhibited mRNA expression of RUNX1 (supplemental Figure 2L) and of its target genes MYC, PU.1, and MPO (Figure 1G). This outcome was again associated with induction of cell lethality (Figure 1H). Notably, treatment of NSG mice engrafted with i-sh-RUNX1–transduced OCI-AML5 cells with doxycycline markedly inhibited AML growth, as well as significantly improved survival of the mice (P = .001) (Figure 1I-J). Moreover, ex vivo exposure to doxycycline before infusion of the i-sh-RUNX1–transduced OCI-AML5 cells into NSG mice, followed by additional in vivo treatment with doxycycline after engraftment, resulted in further improvement of survival of the mice (P = .0004). We also determined the effects of AI-10-104, a small molecule inhibitor of CBFβ binding to RUNX1 that also reduces binding of RUNX1 to target genes and represses target gene expressions,40,41 on survival of AML cells expressing mtRUNX1 vs wtRUNX1. As shown in Figure 2A-B, treatment with AI-10-104 but not AI-4-88 (inactive counterpart) induced significantly more lethality in cultured AML cell lines expressing mtRUNX1 (OCI-AML5 and Mono-Mac-1) compared with wtRUNX1 (OCI-AML2). AI-10-104 also induced greater lethality in primary AML BPCs expressing mtRUNX1 compared with wtRUNX1 (P < .05) (Figure 2C).40
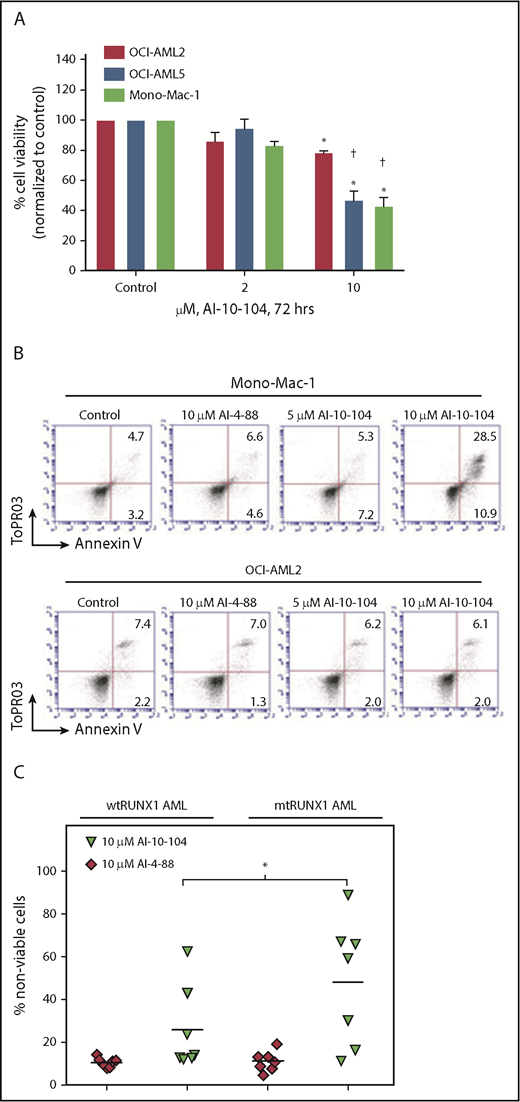
Treatment with CBF-β-RUNX1 inhibitor induces greater lethality in mtRUNX1 expressing AML cells than wtRUNX1 AML cells. (A) OCI-AML2, OCI-AML5, and Mono-Mac-1 cells were treated with the indicated concentrations of CBF-β-RUNX1 inhibitor AI-10-104 for 72 hours. The percent cell viability was then determined by using a 3-(4,5-dimethylthiazol-2-yl)-2,5-dimethyltetrazolium bromide assay. Columns, mean of 3 experiments; bars, standard error of the mean. *Indicates values that are significantly less than untreated cells (P < .05). †Indicates values significantly less in mtRUNX1 AML cells vs than wtRUNX1 AML cells (P < .05). (B) Mono-Mac-1 and OCI-AML2 cells were treated with the indicated concentrations of inactive inhibitor AI-4-88 or active AI-10-104 for 96 hours. The percentage of annexin V–positive, To-Pro-3 iodide-positive apoptotic cells were determined by using flow cytometry. Representative scatter plots are shown. (C) PD CD34+ wtRUNX1 AML (n = 7), and mtRUNX1 AML (n = 7) cells were treated with the indicated concentrations of AI-4-88 or AI-10-014 for 48 hours. At the end of treatment, the percentage of To-Pro-3 iodide-positive, nonviable cells were determined by using flow cytometry (*P < .01 by Kruskal-Wallis test).
Treatment with CBF-β-RUNX1 inhibitor induces greater lethality in mtRUNX1 expressing AML cells than wtRUNX1 AML cells. (A) OCI-AML2, OCI-AML5, and Mono-Mac-1 cells were treated with the indicated concentrations of CBF-β-RUNX1 inhibitor AI-10-104 for 72 hours. The percent cell viability was then determined by using a 3-(4,5-dimethylthiazol-2-yl)-2,5-dimethyltetrazolium bromide assay. Columns, mean of 3 experiments; bars, standard error of the mean. *Indicates values that are significantly less than untreated cells (P < .05). †Indicates values significantly less in mtRUNX1 AML cells vs than wtRUNX1 AML cells (P < .05). (B) Mono-Mac-1 and OCI-AML2 cells were treated with the indicated concentrations of inactive inhibitor AI-4-88 or active AI-10-104 for 96 hours. The percentage of annexin V–positive, To-Pro-3 iodide-positive apoptotic cells were determined by using flow cytometry. Representative scatter plots are shown. (C) PD CD34+ wtRUNX1 AML (n = 7), and mtRUNX1 AML (n = 7) cells were treated with the indicated concentrations of AI-4-88 or AI-10-014 for 48 hours. At the end of treatment, the percentage of To-Pro-3 iodide-positive, nonviable cells were determined by using flow cytometry (*P < .01 by Kruskal-Wallis test).
BRD4 knockdown and BETP antagonists repress RUNX1 and its targets, causing growth inhibition and apoptosis
Using publicly available ChIP-Seq data, we determined that the RUNX1 P1 and P2 promoters and +24 kb enhancer in AML MOLM14 cells exhibited high BRD4 occupancy, which was attenuated by treatment with BETi (I-BET151) (supplemental Figure 3A).42 In addition, the heat map of interaction scores from a Hi-C analysis (a genome-wide version of the chromosome conformation capture [3C] method) in the CML-blast crisis K562 cells showed high interaction scores within the RUNX1 topologically associated domain, especially between the +24 kb-enhancer (eR1) and the P2 and P1 promoter regions of RUNX1 (supplemental Figure 3B).6 Using ChIP-Seq with H3K27Ac antibody, a sequence density plot generated in Integrated Genome Viewer revealed a significant H3K27Ac signal, consistent with active chromatin in the eR1, enhancers, and promoters of RUNX1 in OCI-AML5 cells (Figure 3A, right panel; supplemental Figure 3C). ATAC-Seq analysis showed the presence of accessible chromatin in the RUNX1 eR1 and promoters in OCI-AML5 cells. Using the sequence-tag density from H3K27Ac ChIP-Seq analysis, a ranked-ordering of super-enhancers plot also confirmed the presence of a super-enhancer within the RUNX1 gene (Figure 3A, left panel). To functionally validate the interaction of the +24 kb enhancer with RUNX1 P2 promoter, we cloned and transfected a luciferase reporter containing DNA constructs of the RUNX1 P2 promoter with or without the +24 kb-enhancer into HEK293 cells (supplemental Figure 3D). Compared with the promoter or enhancer alone, the +24 kb enhancer–driven P2 promoter exhibited superior luciferase induction and transcriptional activity (P < .05) (Figure 3B). In addition, ChIP-qPCR analysis revealed that treatment with the chromatin evictors of BETPs (eg, BETi OTX015) or with BETP-PROTAC ARV-771 that degrades and depletes levels of BETPs (eg, BRD4) inhibited occupancy of BRD4, EP300, c-Myc, PU.1, and p-RNAP2 at the RUNX1 eR1 (Figure 3C). Consistent with this finding, a marked reduction occurred in mRNA expression of RUNX1 and MYC, with concomitant induction of the mRNA levels of HEXIM1 and p21, as previously reported in other AML cell types (Figure 3D).39,43 shRNA-mediated knockdown of BRD4 also markedly reduced BRD4 and c-Myc occupancy at the eR1 of RUNX1, while increasing PU.1 occupancy and having no effect on EP300 occupancy (supplemental Figure 3E). Transduction of 2 BRD4 shRNAs led to attenuation of the mRNA levels of BRD4, RUNX1, and MYC (supplemental Figure 3F).
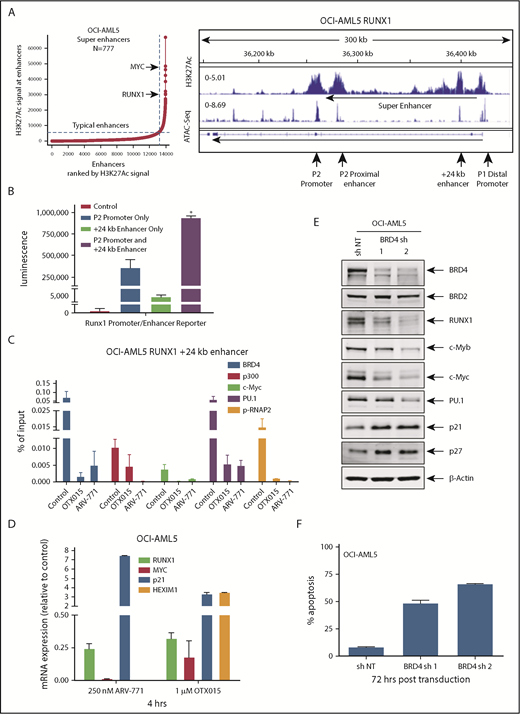
Treatment with BETi reduces BRD4 occupancy on the enhancers of RUNX1 and in AML cells, and knockdown of BRD4 depletes RUNX1 expression and induces apoptosis of AML cells. (A) Ranked ordering of super-enhancers analysis in OCI-AML5 cells (left). Total H3K27Ac ChIP-Seq signal in units of reads per million in enhancer regions for all enhancers in OCI-AML5. Enhancers are ranked by increasing H3K27Ac ChIP-Seq signal. ChIP-Seq signal density plots for H3K27Ac and ATAC-Seq accessibility profiles in the RUNX1 locus of OCI-AML5 cells (right). The locations of the P1 and P2 promoter, +24 kb enhancer, P2 proximal enhancer (corresponds to the mouse +110 enhancer reported by Marsman et al62 ), and the intronic super-enhancer are noted. (B) Reporter constructs containing the RUNX1 P2 promoter and/or a portion of the +24 kb enhancer were transfected into HEK293 cells utilizing polyethylenimine (PEI) and incubated for 48 hours. Relative luciferase activity for each construct was quantified and is reported as total luminescence. *P < .05 compared to P2 promoter or +24 kb enhancer-alone transfected cells. (C) ChIP qPCR of BRD4, c-Myc, p300, PU.1, and pSer2-RNAP2 occupancy in the RUNX1 +24 kb enhancer after treatment with 1000 nM of OTX015 or 250 nM of ARV-771 for 16 hours in OCI-AML5 cells. (D) Relative mRNA expression of RUNX1, MYC, PU.1, HEXIM1, and p21 in OCI-AML5 cells treated with ARV-771 or OTX015 for 4 hours. Expression of each mRNA was normalized to GAPDH and to the untreated control cells. (E) Immunoblot analysis of OCI-AML5 cells transduced with sh NT or BRD4 shRNAs and incubated for 72 hours. (F) Percent apoptosis induced in OCI-AML5 cells transduced with sh NT or BRD4 shRNA for 72 hours.
Treatment with BETi reduces BRD4 occupancy on the enhancers of RUNX1 and in AML cells, and knockdown of BRD4 depletes RUNX1 expression and induces apoptosis of AML cells. (A) Ranked ordering of super-enhancers analysis in OCI-AML5 cells (left). Total H3K27Ac ChIP-Seq signal in units of reads per million in enhancer regions for all enhancers in OCI-AML5. Enhancers are ranked by increasing H3K27Ac ChIP-Seq signal. ChIP-Seq signal density plots for H3K27Ac and ATAC-Seq accessibility profiles in the RUNX1 locus of OCI-AML5 cells (right). The locations of the P1 and P2 promoter, +24 kb enhancer, P2 proximal enhancer (corresponds to the mouse +110 enhancer reported by Marsman et al62 ), and the intronic super-enhancer are noted. (B) Reporter constructs containing the RUNX1 P2 promoter and/or a portion of the +24 kb enhancer were transfected into HEK293 cells utilizing polyethylenimine (PEI) and incubated for 48 hours. Relative luciferase activity for each construct was quantified and is reported as total luminescence. *P < .05 compared to P2 promoter or +24 kb enhancer-alone transfected cells. (C) ChIP qPCR of BRD4, c-Myc, p300, PU.1, and pSer2-RNAP2 occupancy in the RUNX1 +24 kb enhancer after treatment with 1000 nM of OTX015 or 250 nM of ARV-771 for 16 hours in OCI-AML5 cells. (D) Relative mRNA expression of RUNX1, MYC, PU.1, HEXIM1, and p21 in OCI-AML5 cells treated with ARV-771 or OTX015 for 4 hours. Expression of each mRNA was normalized to GAPDH and to the untreated control cells. (E) Immunoblot analysis of OCI-AML5 cells transduced with sh NT or BRD4 shRNAs and incubated for 72 hours. (F) Percent apoptosis induced in OCI-AML5 cells transduced with sh NT or BRD4 shRNA for 72 hours.
Figure 3E shows that BRD4 shRNAs also attenuated protein levels of BRD4 (but not BRD2), as well as reduced levels of RUNX1, c-Myc, c-Myb, and PU.1, with concomitant increases in the protein levels of p21 and p27. This outcome was associated with inhibition of colony growth and induction of apoptosis of OCI-AML5 cells (Figure 3F; supplemental Figure 3G). Treatment with the PROTACs ARV-825 and ARV-771 (but not its inactive counterpart ARV-766) (Figure 4A; supplemental Figure 4A-B) or treatment with the BETi’s OTX015 and JQ1 (but not R-JQ1) induced apoptosis in OCI-AML5 and Mono-Mac-1 cells (Figure 4B-C).44,45 Apoptotic effects of BETi (JQ1 but not R-JQ1) or ARV-771 (but not ARV-766) were also associated with marked reduction in the protein levels of RUNX1, PU.1, c-Myc, and c-Myb in OCI- AML5 cells (supplemental Figures 4C-D). BETP-PROTAC treatment also exerted relatively higher lethality against mtRUNX1-expressing PD CD34+ AML BPCs vs normal CD34+ HPCs (supplemental Figures 4E-F).
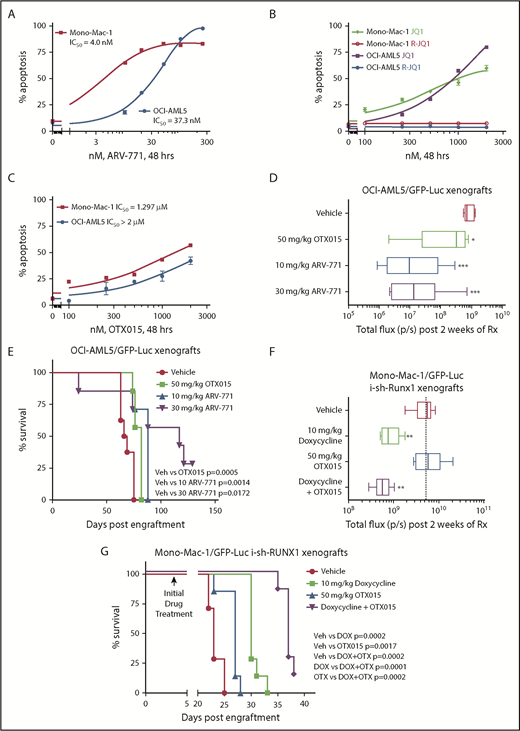
BETP-PROTAC ARV-771 is more potent than BETi OTX015 in reducing the in vivo AML burden and improving survival of NSG mice engrafted with luciferase-transduced mtRUNX1 expressing AML cells. (A-C) Mono-Mac-1 and OCI-AML5 cells were treated with the indicated concentrations of BETP-PROTAC ARV-771, BET inhibitor JQ1 or the inactive R-JQ1, or BET inhibitor OTX015 for 48 hours. The percentage of annexin V–positive apoptotic cells were determined by using flow cytometry. (D) NSG mice were infused with luciferase-expressing OCI-AML5 cells and monitored for 7 days. Engraftment of leukemia was documented by bioluminescent imaging. Mice were then treated for 2 weeks with vehicle, OTX015, or ARV-771 as indicated. Mice were then imaged by using a Xenogen camera to determine treatment efficacy. Total flux (photons/second) in vehicle-, OTX015-, or ARV-771–treated mice as determined by bioluminescent imaging. *Total photon counts that were significantly less in the OTX015- and ARV-771–treated mice compared with the vehicle-treated mice (*P < .05, ***P < .005). (E) Kaplan-Meier survival plot of the in vivo activity of OTX015 or ARV-771 against OCI-AML5-Luc xenografts treated for 3 weeks in NSG mice. Significance between OTX015- and ARV-771–treated vs vehicle-treated mice was determined by using a Mantel-Cox rank sum test. (F) NSG mice were infused with luciferase-expressing Mono-Mac-1 cells transduced with doxycycline (DOX)-inducible RUNX1 shRNA and monitored for 4 days. Mice were imaged to document engraftment of leukemia and then treated with vehicle, 10 mg/kg of DOX, and/or OTX015 as indicated for 2 weeks. Mice were imaged with a Xenogen camera, and total photon counts were recorded. *Indicates total flux (photons/second) that were significantly less in the RUNX1 shRNA and RUNX1 shRNA + OTX015-treated mice compared with the vehicle-treated mice (**P < .01). (G) Kaplan-Meier survival plot of the in vivo activity of DOX and/or OTX015 against Mono-Mac-1/GFP-Luc-i-sh-RUNX1 xenografts in NSG mice. Significance between vehicle and DOX and/or OTX015 was determined by using a Mantel-Cox rank sum test.
BETP-PROTAC ARV-771 is more potent than BETi OTX015 in reducing the in vivo AML burden and improving survival of NSG mice engrafted with luciferase-transduced mtRUNX1 expressing AML cells. (A-C) Mono-Mac-1 and OCI-AML5 cells were treated with the indicated concentrations of BETP-PROTAC ARV-771, BET inhibitor JQ1 or the inactive R-JQ1, or BET inhibitor OTX015 for 48 hours. The percentage of annexin V–positive apoptotic cells were determined by using flow cytometry. (D) NSG mice were infused with luciferase-expressing OCI-AML5 cells and monitored for 7 days. Engraftment of leukemia was documented by bioluminescent imaging. Mice were then treated for 2 weeks with vehicle, OTX015, or ARV-771 as indicated. Mice were then imaged by using a Xenogen camera to determine treatment efficacy. Total flux (photons/second) in vehicle-, OTX015-, or ARV-771–treated mice as determined by bioluminescent imaging. *Total photon counts that were significantly less in the OTX015- and ARV-771–treated mice compared with the vehicle-treated mice (*P < .05, ***P < .005). (E) Kaplan-Meier survival plot of the in vivo activity of OTX015 or ARV-771 against OCI-AML5-Luc xenografts treated for 3 weeks in NSG mice. Significance between OTX015- and ARV-771–treated vs vehicle-treated mice was determined by using a Mantel-Cox rank sum test. (F) NSG mice were infused with luciferase-expressing Mono-Mac-1 cells transduced with doxycycline (DOX)-inducible RUNX1 shRNA and monitored for 4 days. Mice were imaged to document engraftment of leukemia and then treated with vehicle, 10 mg/kg of DOX, and/or OTX015 as indicated for 2 weeks. Mice were imaged with a Xenogen camera, and total photon counts were recorded. *Indicates total flux (photons/second) that were significantly less in the RUNX1 shRNA and RUNX1 shRNA + OTX015-treated mice compared with the vehicle-treated mice (**P < .01). (G) Kaplan-Meier survival plot of the in vivo activity of DOX and/or OTX015 against Mono-Mac-1/GFP-Luc-i-sh-RUNX1 xenografts in NSG mice. Significance between vehicle and DOX and/or OTX015 was determined by using a Mantel-Cox rank sum test.
We also determined the in vivo activity of OTX015 and ARV-771 against luciferase-transduced OCI-AML5 cells engrafted into NSG mice. Figure 4D shows that, compared with the vehicle control mice or mice treated with OTX015, treatment with ARV-771 was more effective in reducing AML burden, as determined by reduction in quantifiable bioluminescence imaging of the mice or by estimating percentage of green fluorescent protein (GFP)-positive cells in the spleen (supplemental Figure 4G). In addition, treatment with ARV-771 was significantly more effective in improving median and overall survival of the mice, especially at the 30 mg/kg dose level, with no co-occurrence of significant weight loss or toxicity during the time span of the study (Figure 4E). Figure 4F shows that, compared with the NSG mice engrafted with luciferase-transduced Mono-Mac-1 cells treated with vehicle control, or with OTX015 alone, mice in which RUNX1 was depleted with doxycycline-inducible shRNA alone or cotreated with OTX015 exhibited greater reduction in AML burden and improvement in median and overall survival (P < .005) (Figure 4F-G). We also determined the activity of cotreatment of BETi with other agents of known anti-AML activity. Cotreatment with OTX015 and the BCL2 inhibitor venetoclax (ABT-199) exerted synergistic lethality (combination indices <1.0) against AML cells expressing mtRUNX1, including 6 samples of PD CD34+ AML BPCs expressing mtRUNX1 (supplemental Figure 5A). Supplemental Figure 5B-D illustrates that cotreatment with OTX015 and the DNMT1 inhibitor decitabine, or with the nucleoside analogue cytarabine (AraC), is also synergistically lethal against AML cells expressing mtRUNX1 (combination indices <1.0).
To assess whether loss of BRD4 occupancy at the RUNX1 eR1 is a major contributory mechanism by which the BETP antagonist elicits its lethal effects in AML cells expressing mtRUNX1, we determined the effects of CRISPR/Cas9-mediated gene editing of the eR1 in OCI-AML5 cells. Confirmed according to ATAC-Seq analysis to be within a Tn5 transposase-accessible region (Figure 5A), eR1 also showed binding sites for multiple transcriptional regulators documented in the ENCODE transcription factor ChIP-Seq data sets. Figure 5A also shows the pool of 9 guide RNAs (gRNAs) that were tiled and selected against the BRD4-occupied eR1 region of RUNX1. gRNAs were cloned into a lentiviral vector (pLenti–single gRNA [sgRNA]), and pooled lentiviral particles were transduced into OCI-AML5 cells, followed by introduction of Cas9 into the stably selected gRNA-expressing OCI-AML5 cells. After in vitro growth for 5 days and following 10 passages, clones were evaluated for cell proliferation and RUNX1 expression. As shown in supplemental Figure 6A-F, after 5 days in suspension culture, post-Cas9 transfection, the +24 kb enhancer-edited OCI-AML5 cells exhibited reduced cell proliferation, increased myeloid differentiation, and apoptosis, as well as depletion of the protein levels of RUNX1, c-Myc, and c-Myb, and markedly decreased colony growth. Figure 5B-C shows that the surviving clones of cells revealed after 10 passages exhibited markedly reduced expression of RUNX1 and a lower percentage of cells in the S phase of the cell cycle. They also exhibited slower growth, with an increased doubling time (Figure 5D). We sequenced the genomic DNA of RUNX1 eR1 from the surviving clones of cells, which revealed that the gRNA-directed Cas9 had introduced multiple indels. OCI-AML5 cells that experienced total editing-out of the RUNX1 eR1 and complete loss of RUNX1 expression were likely eliminated.
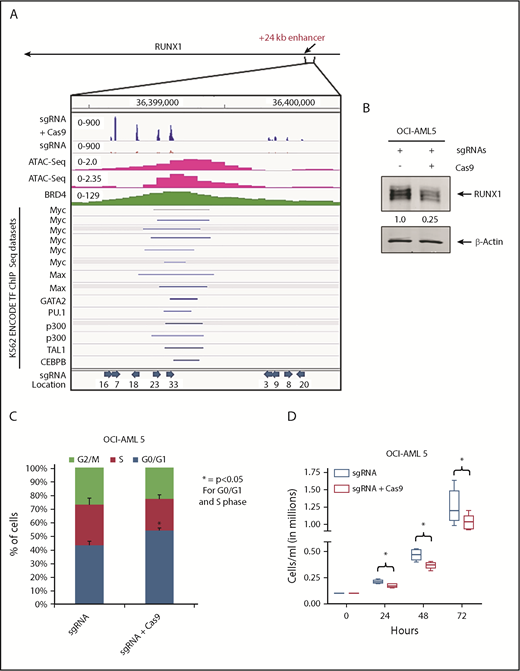
Effect of targeting the +24 kb enhancer region of RUNX1 by CRIPSR/Cas9. (A) sgRNAs were developed by using the CRISPR/Cas9 target online predictor (CCTOP) algorithm and cloned into a lentiviral vector (pLenti-sgRNA). Locations and orientation of sgRNAs used are marked with a blue arrow. Pooled lentiviral particles were transduced into OCI-AML5 cells, and sgRNAs were stably selected with puromycin. Adenoviral-expressed Cas9 was transduced into stable selected sgRNA-expressing OCI-AML5 cells, and the cells were grown for 10 passages. (A) Signal density plot of a region within the +24 kb enhancer in OCI-AML5 cells with sgRNA alone and sgRNA+ Cas9 showing indels in the surviving clones, OCI-AML5 control cell ATAC-Seq, MOLM14 BRD4 ChIP-Seq, and ENCODE K562 transcription factor (TF) ChIP-Seq data sets. (B) Immunoblot analysis of RUNX1 in OCI-AML5 cells transduced with sgRNAs and/or Cas9 after 10 passages. The expression levels of β-actin in the lysates served as the loading control. (C) Cell cycle status of OCI-AML5 cells stably transduced with sgRNAs vs those transduced with sgRNAs and Cas9. *Indicates G0/G1 and S phase values that are significantly altered in the sgRNA- and Cas9-transduced cells vs cells transduced with only sgRNAs (P < .05). (D) Cell proliferation of OCI-AML5 cells with sgRNA and sgRNA+ Cas9 cells over 72 hours. *Indicates values that are significantly less in OCI-AML5 cells after Cas9 transduction (P < .05).
Effect of targeting the +24 kb enhancer region of RUNX1 by CRIPSR/Cas9. (A) sgRNAs were developed by using the CRISPR/Cas9 target online predictor (CCTOP) algorithm and cloned into a lentiviral vector (pLenti-sgRNA). Locations and orientation of sgRNAs used are marked with a blue arrow. Pooled lentiviral particles were transduced into OCI-AML5 cells, and sgRNAs were stably selected with puromycin. Adenoviral-expressed Cas9 was transduced into stable selected sgRNA-expressing OCI-AML5 cells, and the cells were grown for 10 passages. (A) Signal density plot of a region within the +24 kb enhancer in OCI-AML5 cells with sgRNA alone and sgRNA+ Cas9 showing indels in the surviving clones, OCI-AML5 control cell ATAC-Seq, MOLM14 BRD4 ChIP-Seq, and ENCODE K562 transcription factor (TF) ChIP-Seq data sets. (B) Immunoblot analysis of RUNX1 in OCI-AML5 cells transduced with sgRNAs and/or Cas9 after 10 passages. The expression levels of β-actin in the lysates served as the loading control. (C) Cell cycle status of OCI-AML5 cells stably transduced with sgRNAs vs those transduced with sgRNAs and Cas9. *Indicates G0/G1 and S phase values that are significantly altered in the sgRNA- and Cas9-transduced cells vs cells transduced with only sgRNAs (P < .05). (D) Cell proliferation of OCI-AML5 cells with sgRNA and sgRNA+ Cas9 cells over 72 hours. *Indicates values that are significantly less in OCI-AML5 cells after Cas9 transduction (P < .05).
Expression signatures of RUNX1 knockdown or inhibition in AML cells expressing mtRUNX1
Using RNA-Seq analysis, we next determined the mRNA expression signature associated with RUNX1 knockdown in OCI-AML5 cells. The goal here was to perform LINCS 1000-CMap analysis queried with this signature (discussed later) to discover EMs from a library of US Food and Drug Administration–approved drugs or other agents. Figure 6A shows a heat map of upregulated and downregulated mRNA expressions due to shRNA-mediated knockdown of RUNX1. Notable perturbations in gene expression are shown in Figure 6B, among which were downregulated RUNX1, IL2RA, IL7R, MPO, GLI2, BCL2, and c-MYC, as well as upregulation of P2RY14 (a member of the purinergic receptor family), ZNF460 (a member of the zinc finger family of proteins), ITGAM (CD11b integrin, a marker of differentiation in AML), RGS2 (a regulator of G protein–coupled receptor signaling involved in AML cell differentiation), DAPK1 (a tumor suppressor repressed in AML), GATA2 (a tumor suppressor in myeloid malignancies), and CDKN1B (a tumor suppressor in AML). Supplemental Figure 7A shows the 50 most significantly upregulated and downregulated mRNAs. Perturbations of some of these mRNA were also confirmed by using qPCR (supplemental Figure 7B). A notable number of mRNA expression perturbations mediated by RUNX1 shRNA were altered in a directionally opposite manner to those reported when wtRUNX1 was restored through gene editing in induced pluripotent stem cells generated from skin fibroblasts of a patient with germline RUNX1 mutation (Figure 6C).46 Using RNA-Seq, we also determined alterations in mRNA expression in OCI-AML5 cells treated with equimolar concentrations of OTX015 vs ARV-825. Consistent with a previous report,32 BETP-PROTAC treatment induced greater numbers of mRNA alterations compared with OTX015 (Figure 6D). Specifically, expressions of 41 mRNAs were upregulated and 30 downregulated that were common to mRNA alterations due to treatments with RUNX1 shRNA, ARV-825, and OTX015 (supplemental Table 2A-B). Exposure to a lower concentration of ARV-825 than OTX015 also, in a sustained manner, depleted BETPs and caused greater attenuation in the protein expressions of RUNX1 and its target proteins, while inducing p21 levels in OCI-AML5 and PD AML BPCs expressing mtRUNX1 (supplemental Figure 8A-C).
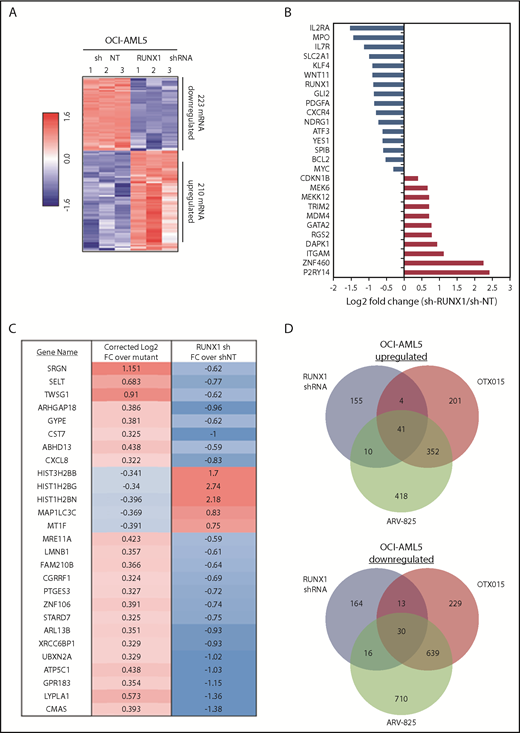
Global gene expression alterations caused by depletion of RUNX1 in AML cells are opposite to the expression signature induced by correction of RUNX1 mutation in induced pluripotent stem cells (IPSCs) from a patient with FPD/AML. (A) RNA-Seq analysis of OCI-AML5 cells transduced with sh NT or RUNX1 shRNA for 72 hours. The heat map shows the number of upregulated and downregulated genes with a fold change ≥1.5 and a P value < .05. (B) Log2 fold-change of selected mRNA expression alterations resulting from knockdown of RUNX1 in OCI-AML5 cells. (C) Comparison of the gene expression signature in IPSCs from an FPD-AML patient with correction of RUNX1 mutation to those in OCI-AML5 cells after depletion of RUNX1 by shRNA. (D) OCI-AML5 cells were treated with 1 µM of ARV-825 or OTX015 for 4 hours. RNA-Seq analysis was performed on biologic triplicate RNA samples. mRNAs identified with a fold-change ≥2.0 in either direction (relative to the untreated control) and a P value < .05 in the ARV-825 (1395 down/821 up) and OTX015 (911 down/598 up) treated cells were used to construct a Venn diagram. The Venn diagram shows the expression overlaps between RUNX1 shRNA and treatment with OTX015 or ARV-825.
Global gene expression alterations caused by depletion of RUNX1 in AML cells are opposite to the expression signature induced by correction of RUNX1 mutation in induced pluripotent stem cells (IPSCs) from a patient with FPD/AML. (A) RNA-Seq analysis of OCI-AML5 cells transduced with sh NT or RUNX1 shRNA for 72 hours. The heat map shows the number of upregulated and downregulated genes with a fold change ≥1.5 and a P value < .05. (B) Log2 fold-change of selected mRNA expression alterations resulting from knockdown of RUNX1 in OCI-AML5 cells. (C) Comparison of the gene expression signature in IPSCs from an FPD-AML patient with correction of RUNX1 mutation to those in OCI-AML5 cells after depletion of RUNX1 by shRNA. (D) OCI-AML5 cells were treated with 1 µM of ARV-825 or OTX015 for 4 hours. RNA-Seq analysis was performed on biologic triplicate RNA samples. mRNAs identified with a fold-change ≥2.0 in either direction (relative to the untreated control) and a P value < .05 in the ARV-825 (1395 down/821 up) and OTX015 (911 down/598 up) treated cells were used to construct a Venn diagram. The Venn diagram shows the expression overlaps between RUNX1 shRNA and treatment with OTX015 or ARV-825.
Agents identified through LINCS 1000-CMap analyses and their activity in inhibiting RUNX1 expression in AML cells expressing mtRUNX1
We next used the RNA-Seq signature following treatment of OCI-AML5 cells with RUNX1 shRNA to query the LINCS 1000-CMap data sets of >1 million gene expression signatures.34 A rank-ordered list of the top 45 hits or EMs is shown in supplemental Table 3. Among the EMs not previously categorized as genotoxic anticancer agents were narciclasine, anisomycin, fenbendazole, and cinobufagin (#5, #7, #30 and #37, respectively, on the list). Figure 7A shows that these agents dose dependently induced apoptosis of OCI-AML5 cells. These agents also induced apoptosis in Mono-Mac-1 cells (supplemental Figure 9A). Concurrently, exposure to anisomycin or cinobufagin, but not CD-1530 (#10 on the list), also inhibited mRNA expression of RUNX1 and its targets c-Myc and PU.1 while inducing p21 expression in OCI-AML5 cells (supplemental Figure 8B). Treatment with anisomycin, cinobufagin, and narciclasine, but not CD-1530 and mevastatin (#45 on the list), also attenuated protein expressions of RUNX1, c-Myc, PU.1, and c-Myb in OCI-AML5 cells (Figure 7B-C). We also evaluated the effects of treatment with the nonspecific cytotoxic chemotherapy agents AraC and etoposide in mtRUNX1 expressing AML cells. Supplemental Figure 10 shows that treatment with etoposide but not AraC dose-dependently induced apoptosis in OCI-AML5 cells; however, only higher concentrations of etoposide reduced the protein expression of c-Myc and c-Myb. We next evaluated the in vivo activity of narciclasine, cinobufagin, and fenbendazole against luciferase-expressing OCI-AML5 cells engrafted into NSG mice. As shown in supplemental Figure 9C and Figure 7D, these EMs reduced AML burden as well as significantly increased survival of the NSG mice.
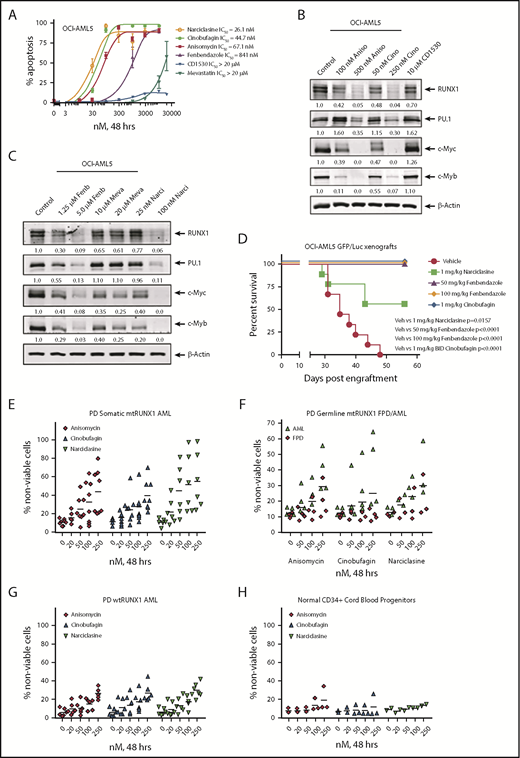
Treatment with EMs induces apoptosis, loss of cell viability of PD somatic and germline mtRUNX1 expressing AML, depletes RUNX1 protein expression, and improves the survival of mice engrafted with mtRUNX1 expressing AML cells. (A) OCI-AML5 cells were treated with anisomycin, cinobufagin, CD1530, narciclasine, fenbendazole, or mevastatin at concentrations ranging from 10 nM to 20 µM for 48 hours. The IC50 dose of each drug was calculated and is shown. (B-C) Immunoblot analysis of OCI-AML5 cells treated with the indicated concentrations of EMs for 24 hours. Expression levels of β-actin in the lysates served as the loading control. (D) Kaplan-Meier survival plot of the in vivo activity of 1 mg/kg of narciclasine, 50 mg/kg or 100 mg/kg of fenbendazole, or 1 mg/kg of cinobufagin (twice daily) against OCI-AML5/GFP-Luc xenografts in NSG mice. Significance between mice treated with 1 mg/kg of narciclasine, 50 mg/kg or 100 mg/kg of fenbendazole, or 1 mg/kg of cinobufagin (twice daily) vs vehicle-treated mice was determined by using a Mantel-Cox rank sum test. (E-G) PD CD34+ somatic mtRUNX1 expressing AML cells (n = ≥6 samples per drug), wtRUNX1 AML cells (n = 6), germline mtRUNX1 expressing AML cells (n = ≥3), and mtRUNX1 FPD cells (n = ≥3) were treated with the indicated concentrations of anisomycin, cinobufagin, and narciclasine for 48 hours. The percentage of propidium iodide (PI)–positive nonviable cells was then determined by using flow cytometry. (H) Normal CD34+ cord blood progenitor cells (n = 3) were treated with the indicated concentrations of anisomycin, cinobufagin, and narciclasine for 48 hours. The percentage of PI-positive nonviable cells was then determined by using flow cytometry.
Treatment with EMs induces apoptosis, loss of cell viability of PD somatic and germline mtRUNX1 expressing AML, depletes RUNX1 protein expression, and improves the survival of mice engrafted with mtRUNX1 expressing AML cells. (A) OCI-AML5 cells were treated with anisomycin, cinobufagin, CD1530, narciclasine, fenbendazole, or mevastatin at concentrations ranging from 10 nM to 20 µM for 48 hours. The IC50 dose of each drug was calculated and is shown. (B-C) Immunoblot analysis of OCI-AML5 cells treated with the indicated concentrations of EMs for 24 hours. Expression levels of β-actin in the lysates served as the loading control. (D) Kaplan-Meier survival plot of the in vivo activity of 1 mg/kg of narciclasine, 50 mg/kg or 100 mg/kg of fenbendazole, or 1 mg/kg of cinobufagin (twice daily) against OCI-AML5/GFP-Luc xenografts in NSG mice. Significance between mice treated with 1 mg/kg of narciclasine, 50 mg/kg or 100 mg/kg of fenbendazole, or 1 mg/kg of cinobufagin (twice daily) vs vehicle-treated mice was determined by using a Mantel-Cox rank sum test. (E-G) PD CD34+ somatic mtRUNX1 expressing AML cells (n = ≥6 samples per drug), wtRUNX1 AML cells (n = 6), germline mtRUNX1 expressing AML cells (n = ≥3), and mtRUNX1 FPD cells (n = ≥3) were treated with the indicated concentrations of anisomycin, cinobufagin, and narciclasine for 48 hours. The percentage of propidium iodide (PI)–positive nonviable cells was then determined by using flow cytometry. (H) Normal CD34+ cord blood progenitor cells (n = 3) were treated with the indicated concentrations of anisomycin, cinobufagin, and narciclasine for 48 hours. The percentage of PI-positive nonviable cells was then determined by using flow cytometry.
We next determined the activity of narciclasine, anisomycin, and cinobufagin against PD AML BPCs expressing somatic mtRUNX1 (>6 samples, including AML #9 to #13 and #16 in supplemental Figure 1E-F), samples of AML expressing germline mtRUNX1, and against samples of FPD HPCs. We also determined the activity of these agents against 7 samples of AML expressing wtRUNX1 (supplemental Figure 1H) and 3 samples of CD34+ cord blood normal HPCs. As shown in Figure 7E-F, cinobufagin, narciclasine, and anisomycin treatments dose dependently caused loss of cell viability in AML samples with somatic or germline mtRUNX1. In contrast, these agents were relatively less active against AML samples expressing wtRUNX1 and FPD HPCs (Figure 7F-G) or against CD34+ normal cord blood HPCs (Figure 7H). Collectively, these findings highlight that among the EMs evaluated, cinobufagin, fenbendazole, and narciclasine exert in vitro as well as in vivo anti-AML efficacy against AML expressing mtRUNX1.
Discussion
In AML BPCs expressing somatic or germline mtRUNX1, whether the remaining levels and/or activity of wtRUNX1 is a dependency and essential for growth and survival had not been previously interrogated. Findings presented here show that repression of RUNX1 (mutant and wild-type), or inhibition of CBFβ-binding to RUNX1 by AI-10-104 (which represses RUNX1 target genes), exerts greater efficacy against AML BPCs expressing somatic or germline mtRUNX1 vs those expressing wtRUNX1. Although similar in its in vitro lethal effects to RUNX1 shRNA, more potent analogues of AI-10-104 with greater in vivo efficacy are not yet available.40,41 Confirmed by using ATAC-Seq, our findings revealed the accessibility of the chromatin at the +24 kb enhancer, eR1, of RUNX1. Several reports have documented the role of BRD4 occupancy at super-enhancers as essential for mRNA transcript elongation of master regulators and hematopoietic transcription factors, as well as of important oncogenes, including MYC, CDK4/6, BCL2, BCL-xL, and PIM1.47-53 We also discovered that shRNA-mediated knockdown of BRD4 repressed RUNX1 and its targets and induced lethality in AML cells expressing mtRUNX1. BETi treatment reduced the occupancy of BRD4 at the eR1 and promoter of RUNX1, repressing RUNX1 and its targets. This action led to colony growth inhibition, induction of differentiation markers and apoptosis in cultured AML cell lines, and loss of viability of PD AML BPCs expressing mtRUNX1. However, it is likely that an accompanying strong reduction in c-Myc, c-Myb, and PU.1 expressions also contributed toward the lethal outcome. Synergistic lethal effects of cotreatment with BETi and venetoclax or decitabine or cytarabine highlight the BETi-based combinations that could potentially be tested against AML expressing mtRUNX1. After BETi treatment, the depletion of MYC levels observed here is not only likely due to repression of RUNX1, of which MYC is a target, but also through inhibition of BRD4 occupancy on the MYC super-enhancer.47-50 Unlike BETi’s, PROTACs can facilitate multiple rounds of sub-stoichiometric catalysis and BETP degradation.32,44,54 Similar to their efficacy observed in another AML type,32 our findings here show for the first time that BETP-PROTACs are significantly more potent than BETi not only in depleting BETP levels but also in repressing RUNX1 and its targets, as well as demonstrating greater in vivo efficacy against mice engrafted with mtRUNX1-expressing AML. However, these observations raise the issue of how much of the growth inhibitory and lethal effects of these agents are due to depletion of BRD4 occupancy at the RUNX1 eR1 vs the super-enhancers regulating other oncogenes involved in growth and survival of AML BPCs. Our findings show that gene editing of the RUNX1 eR1 eliminated a majority of AML cells via apoptosis, while significantly depleting RUNX1 expression and inhibiting growth of the surviving minority of AML cells. These findings confirm that abrogation of BRD4 occupancy on eR1 contributes to repression of RUNX1, thereby mediating growth inhibition and loss of viability of AML cells expressing mtRUNX1. Thus, until a specific RUNX1 degrader is developed, the priority must be to evaluate the effects of repressing RUNX1 transcription with either BETi or BETP-PROTAC treatment or with the EMs described here.
By acquiring other driver somatic mutations, the HPCs in FPD transform into FPD-MM.20,27 We therefore focused on discovering novel agents with an expression signature mimicking the expression signature of RUNX1 knockdown but without genotoxic effects on normal HPCs. Using LINCS analysis, we uncovered 45 EMs as top hits. Notably, among these were BETP inhibitors (eg, TG-101348 and LY-303511 [dual JAK2 or PI3K and BRD4 inhibitor]).55 The list also included anticancer agents that engage other targets; for example, QL-X-138 (BTK/MNK inhibitor), TGX-115 and PI-828 (PI3K inhibitors), MK-1775 (WEE1 kinase inhibitor), PNU-74654 (β-catenin/T-cell factor inhibitor), and NU-7441 (DNA-PK inhibitor).56-61 Whether any of these agents can be safely used to achieve remission in FPD/MM expressing germline mtRUNX1 remains to be evaluated. EMs not known to be genotoxic anticancer agents included narciclasine, cinobufagin, anisomycin, and fenbendazole, which inhibited in vitro expression of RUNX1 and its targets. They also induced greater in vitro lethality in AML BPCs expressing somatic mtRUNX1 compared with wtRUNX1, while relatively sparing normal CD34+ HPCs. In addition, these EMs exerted in vivo efficacy against AML cells expressing mtRUNX1 engrafted in NSG mice, without exhibiting host toxicity. Importantly, these EMs were differentially less toxic in vitro against FPD HPCs that had not fully transformed into FPD/MM cells. This finding raises the possibility that treatment with these EMs may be effective in eliminating FPD/MM, causing return to hematopoiesis sustained by FPD HPCs that lack comutations responsible for transformation into FPD/MM. This finding essentially highlights the first potentially preventive strategy for FPD/MM developing in FPD patients in the pedigrees of germline mtRUNX1. Taken together, our findings document BETP antagonists as mechanistically targeted effective agents that deplete RUNX1 levels and induce lethality in AML cells expressing somatic or germline mtRUNX1. They also identify previously unrecognized EMs that attenuate expression of RUNX1, demonstrating efficacy against AML cells expressing somatic or germline mtRUNX1.
The online version of this article contains a data supplement.
The publication costs of this article were defrayed in part by page charge payment. Therefore, and solely to indicate this fact, this article is hereby marked “advertisement” in accordance with 18 USC section 1734.
Acknowledgments
The authors thank the Sequencing and Microarray Core Facility, Flow Cytometry and Cellular Imaging Core Facility, and the Functional Proteomics Reverse Phase Protein Array Core facility, which are supported by M.D. Anderson Cancer Center Support Grant 5 P30 CA016672-40 from the National Institutes of Health (NIH), National Cancer Institute (NCI). The heat maps were developed by the M.D. Anderson Cancer Center Department of Bioinformatics and Computational Biology, In Silico Solutions, Santeon, and SRA International.
This work was supported in part by NIH/NCI (Anderson TCGA Genome Data Analysis Center) grants CA143883 and CA083639, the Mary K. Chapman Foundation, the Michael & Susan Dell Foundation (honoring Lorraine Dell), and M.D. Anderson Cancer Center Support Grant NIH/NCI P30CA016672 (the Bioinformatics Shared Resource). This project was partially supported by CPRIT RP170295 (C.C.), the shared Proteomics and Metabolomics Core at Baylor College of Medicine with funding from the NIH/NCI (P30 CA125123), CPRIT Proteomics and Metabolomics Core Facility RP170005 (K. Rajapakshe and C.C.), and the NCI-recognized Dan L. Duncan Cancer Center. C.M.C. acknowledges support from the NIH/NCI (R35 CA197589) and Arvinas. This research is supported in part by the M.D. Anderson Cancer Center Leukemia Specialized Program of Research Excellence (P50 CA100632).
Authorship
Contribution: K.N.B. is responsible for conceptualization of the study; C.C., K. Rajapakshe, D.P., and A.P.F. were responsible for the formal analyses; C.P.M., W.F., D.T.S., and D.N.S. performed investigations; C.D.D., Y.Q., K. Raina, C.C., K. Rajapakshe, T.M.K., J.D.K., A.I., K.T., S.M.K., M.R.G., J.H.B., and C.M.C. were responsible for resources; C.P.M., W.F., C.C., and K. Rajapakshe performed visualization; K.N.B. and W.F. wrote the original draft; and K.N.B. was responsible for writing, reviewing, and editing the manuscript.
Conflict-of-interest disclosure: C.M.C. is the founder and Chief Scientific Advisor of, and possesses an equity ownership stake in, Arvinas, Inc. Y.Q. and K. Raina are Arvinas employees and possess an equity ownership stake in Arvinas. The remaining authors declare no competing financial interests.
Correspondence: Kapil N. Bhalla, Department of Leukemia, The University of Texas M.D. Anderson Cancer Center, 1400 Holcombe Blvd, Unit 428, Houston, TX 77030; e-mail: kbhalla@mdanderson.org.

This feature is available to Subscribers Only
Sign In or Create an Account Close Modal