

Key Points
TNF integrates inflammatory signals to directly regulate the lineage instructing transcription factor PU.1 in HSCs.

Abstract
The molecular mechanisms governing the transition from hematopoietic stem cells (HSCs) to lineage-committed progenitors remain poorly understood. Transcription factors (TFs) are powerful cell intrinsic regulators of differentiation and lineage commitment, while cytokine signaling has been shown to instruct the fate of progenitor cells. However, the direct regulation of differentiation-inducing hematopoietic TFs by cell extrinsic signals remains surprisingly difficult to establish. PU.1 is a master regulator of hematopoiesis and promotes myeloid differentiation. Here we report that tumor necrosis factor (TNF) can directly and rapidly upregulate PU.1 protein in HSCs in vitro and in vivo. We demonstrate that in vivo, niche-derived TNF is the principal PU.1 inducing signal in HSCs and is both sufficient and required to relay signals from inflammatory challenges to HSCs.
Introduction
The hematopoietic system needs to adapt to altered demands of blood cell types, and correct lineage choice is crucial for a healthy blood system.1 Transcription factors (TFs) are master regulators that direct cell lineage choice,2 and overexpression of even single TFs can be sufficient to force cells into a specific lineage.3,4 However, what regulates these TFs to induce cell lineage choice remains poorly understood. TF networks have been proposed as regulators of TF expression and thus of lineage choices. Cell-intrinsic stochastic switches rooted in the TF networks’ wiring have been proposed to control a hierarchically organized hematopoietic differentiation process in a cell autonomous way.4-6 Selective effects of cytokines on cell survival or proliferation after lineage choice would allow adaption to altered demands for specific cell types. However, the actual use of this cell autonomous TF switching in controlling lineage choice of individual live hematopoietic cells has not yet been demonstrated.3
Regulation of cell intrinsic TFs through signaling pathways activated by cell extrinsic molecules like cytokines would be an obvious alternative model.7,8 However, it has proved surprisingly difficult to find direct TF regulation by cell extrinsic regulators. Lineage instruction by cell extrinsic cytokines has been demonstrated (for example, for granulocyte/macrophage lineage-restricted progenitors, which can be instructed by, eg, macrophage colony-stimulating factor 1 [CSF1]).8,9 PU.1 is a central regulator of myeloid lineage commitment during hematopoietic stem and progenitor cell (HSPC) homeostasis. It can reprogram hematopoietic cells into the myeloid lineage, and its expression level and duration regulate lineage decisions.3,4,10,11 However, how PU.1 is regulated itself is poorly understood.12 Notch signaling can regulate PU.1 expression,13 and quantitative time-lapse quantification of fluorescently tagged PU.1 excluded random bistable PU.1/Gata1 switching3 and suggested cell cycle length14 as one possible regulator of HSPC PU.1 expression. Identifying a direct link between cytokine signaling and PU.1 regulation has been challenging over many years, mostly because of missing single cell approaches and lack of adequate detection tools.12,15
We therefore aimed to systematically test a panel of cytokines for direct effects of PU.1 protein in HSPCs (Figure 1; supplemental Table 1, available on the Blood Web site).
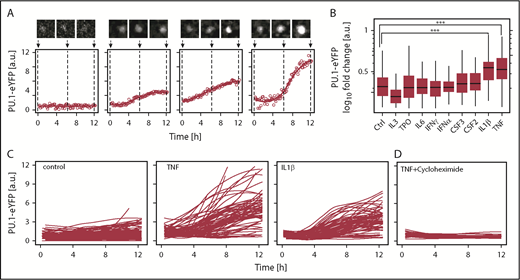
Tumor necrosis factor (TNF) and interleukin-1β (IL-1β) upregulate PU.1 protein in hematopoietic stem cells (HSCs) in vitro. (A) Examples of PU.1–enhanced yellow fluorescent protein (eYFP) expression kinetics in single HSCs upon TNF stimulation. Solid line: smoothed PU.1-eYFP expression dynamics from individual measurements (circles). Cell image tile length is 30 μm. (B) PU.1 induction by cytokine stimulation in HSCs. PU.1-eYFP fold changes were calculated for individual HSCs as 12 hours vs 0 hours values from continuous quantitative live imaging. Media was supplemented in all conditions with stem cell factor (SCF) (control) and additional cytokine as indicated. Analyzed HSCs SCF: 165, TPO: 255, IL-3: 112, IL-6: 89, interferon-γ (IFN-γ): 79, IFNα: 100, CSF3: 82, CSF2: 85, IL-1β: 94, TNF: 98, from n = 3-7 independent experiments/cytokine. ***P < 1 × 10⁻⁶, Bonferroni corrected analysis of variance (ANOVA). No other significant differences were detected. (C) PU.1-eYFP time courses of single cells cultured for 12 hours. Shown traces are sampled from 3 representative animals per condition. Control: 73, TNF: 101, IL-1β: 73. (D) PU.1-eYFP time-courses of single cells in presence of TNF + 50 µg/mL translation inhibitor cycloheximide. Cells: TNF: 86, TNF + cycloheximide: 27.
Tumor necrosis factor (TNF) and interleukin-1β (IL-1β) upregulate PU.1 protein in hematopoietic stem cells (HSCs) in vitro. (A) Examples of PU.1–enhanced yellow fluorescent protein (eYFP) expression kinetics in single HSCs upon TNF stimulation. Solid line: smoothed PU.1-eYFP expression dynamics from individual measurements (circles). Cell image tile length is 30 μm. (B) PU.1 induction by cytokine stimulation in HSCs. PU.1-eYFP fold changes were calculated for individual HSCs as 12 hours vs 0 hours values from continuous quantitative live imaging. Media was supplemented in all conditions with stem cell factor (SCF) (control) and additional cytokine as indicated. Analyzed HSCs SCF: 165, TPO: 255, IL-3: 112, IL-6: 89, interferon-γ (IFN-γ): 79, IFNα: 100, CSF3: 82, CSF2: 85, IL-1β: 94, TNF: 98, from n = 3-7 independent experiments/cytokine. ***P < 1 × 10⁻⁶, Bonferroni corrected analysis of variance (ANOVA). No other significant differences were detected. (C) PU.1-eYFP time courses of single cells cultured for 12 hours. Shown traces are sampled from 3 representative animals per condition. Control: 73, TNF: 101, IL-1β: 73. (D) PU.1-eYFP time-courses of single cells in presence of TNF + 50 µg/mL translation inhibitor cycloheximide. Cells: TNF: 86, TNF + cycloheximide: 27.
Study design
Quantitative time-lapse imaging and in vitro cytokine screen
To quantify the PU.1-eYFP signal in HSPCs, cells were plated in 1536-well glass bottom plates in serum free and phenol red free expansion media, supplemented with 50 U/mL penicillin and 50 μg/mL streptomycin. Continuous time-lapse imaging was performed as described.3
In vivo challenge experiments and immunofluorescence analysis
For lipopolysaccharide (LPS) injections, animals were injected intraperitoneally with 1.4 mg/kg LPS. For TNF injections, animals received 2 consecutive injections 2 hours apart each of 3 μg recombinant TNF (Peprotech) reconstituted in 100 μL phosphate-buffered saline (PBS) or a PBS mock injection IV. Immunofluorescent staining on sorted HSPCs was performed as described.3,16 A detailed description of the experimental procedures can be found in the supplemental Materials and methods.
Results and discussion
Responses of different HSPCs to cytokine signaling inputs are likely heterogeneous at the single cell level, either because of incomplete prospective purification or because cells may be, for example, in different cell cycle phases or other changing states. Single cell approaches are thus required to identify potential modulators of TF dynamics, which would otherwise be averaged out and missed in bulk analyses.12,17,18 We initially quantified PU.1 protein levels in vitro in single HSCs using time-lapse microscopy immediately following their isolation. SCF containing serum free media was supplemented with 1 of 9 cytokines (supplemental Table 1). Time-lapse movies were acquired for 12 hours to quantify early dynamics in PU.1 levels before the first cell division. We used a homozygous and extensively validated PU.1 reporter mouse line3,19 expressing a fusion of PU.1 and eYFP from the endogenous PU.1 genomic locus (PU.1-eYFP). The PU.1-eYFP fusion protein has no detectable changes in protein stability or function, and PU.1-eYFP mice have normal HSC function, HSPC distribution, blood development, and in vitro colony forming potential,3 in agreement also with single cell transcriptional data for PU.1 expression of these cell types.20
PU.1-eYFP expression dynamics in HSCs were heterogeneous, underlining the requirement for continuous single cell quantification (Figure 1A).3,12 Of the factors tested, we identified 2 cytokines, IL-1β (P = 6 × 10⁻⁷ [ANOVA], n = 118 cells, from 4 independent experiments)21 and TNF (P = 1 × 10⁻⁶ [ANOVA], n = 170 cells, from 4 independent experiments), significantly upregulating PU.1 protein within 12 hours of in vitro exposure in >90% of cells, and as early as 3 hours after stimulation in some cells (Figure 1B-C). Indeed, flow cytometry analysis could confirm shifts for these cytokines also on the population level (supplemental Figure 1A).
Given the heterogeneous PU.1 response, we asked whether different lineage-biased HSC subsets respond differently to TNF exposure. We subfractionated HSCs based on CD150 and CD41 expression into 3 fractions corresponding to myeloid-biased HSCs (My-HSC 1 and My-HSC 2) and lymphoid-biased HSCs (Ly-HSC) (see supplemental Methods and materials and supplemental Figure 1C).22 However, although the Ly-HSC fraction contained more cells with high initial PU.1 levels, we observed heterogeneity in the PU.1 response in all 3 subsets in response to TNF (supplemental Figure 1C). Thus, the PU.1 induction by TNF is not specific for any of the tested HSC subtypes, and heterogeneous in all of them.
In all, these data establish the long-sought direct regulation of the lineage instructing TF PU.1 by cytokine signaling, not only in more mature myeloid progenitor cells, but immediately in HSCs. Of note, we were not able to observe the previously published induction of PU.1 in HSCs by CSF123 (M.E., N.A., P.S.H., D.L., S.S., O.H., K.D.K., Max Endele, Michael Schwarzfischer, Ellis Whitehead, H.-M.K., J.S., Fabian J. Theis, C.N., and T.S., manuscript submitted February 2016).
Cultures in presence of TNF and the protein synthesis inhibitor cycloheximide entirely ablated PU.1 induction (Figure 1D). We also confirmed TNF driven PU.1–messenger RNA induction using a green fluorescent protein expressing (PU.1-GFP) transcriptional reporter mouse line (supplemental Figure 1B). Together, this suggests that TNF signaling upregulated PU.1 protein through de novo PU.1 mRNA transcription and translation in HSCs and not by altered PU.1 protein stability.
To test whether TNF signaling occurs via the canonical NF-κB pathway and/or involves p38-MAPK signaling, we used pathway specific chemical inhibitors. Interestingly, NF-ĸB pathway inhibitor NEMO-binding domain peptide, but not p38-MAP kinase inhibitor (SB239063), decreased the PU.1 protein induction in response to TNF. This suggests that TNF dependent transcription of PU.1 is directly regulated via NF-κB dependent signaling, which is in line with a predicted binding site of NF-κB in a −17 kb enhancer element of the PU.1 gene.24
In vivo, serum levels of several inflammatory cytokines increase rapidly after LPS and poly I:C injection, including those of IFNs, IL-1β, CSF1, and TNF.25,26 IFNs, IL-1β, and CSF1 have been previously suggested to trigger PU.1 in vivo.23,27 We observed elevated PU.1 level in C57BL/6 mice following injection with LPS (Figure 2B) or poly I:C (not shown). To assess the relevance of TNF toward PU.1 induction in vivo, we used TNF−/− mice. These are deficient in the production of mature TNF protein but otherwise display normal cytokine production, including for IFNs and IL-1β.28 As expected, injection of TNF triggered PU.1 upregulation in HSCs in both normal (P = .0074 [ANOVA], n = 4 mice for PBS, 2 mice for TNF) and TNF−/− (P = .0017 [ANOVA], n = 4 mice for PBS, 3 mice for TNF) mice. In contrast, no elevated PU.1 levels were observed for LPS (P = .4 [ANOVA], n = 4 mice) in TNF−/− mice (Figure 2B), demonstrating that TNF production is required as an intermediary to affect PU.1 expression in HSCs during inflammation. Thus, TNF can integrate different inflammatory signals and is required as the main instigator of PU.1 upregulation in HSCs following an inflammatory challenge in vivo.

Inflammatory signals are integrated through TNF via NF-κB to directly regulate PU.1 in HSCs in vivo. (A) NF-κB-signaling is essential for PU.1 induction by TNF. Quantification of HSC PU.1-eYFP levels 12 hours after stimulation with NF-κB inhibitor (NEMO-binding domain peptide, 30 μM) or p38 MAPK inhibitor (SB239063, 50 μM). Cells: Ctrl: 162, TNF: 223, NF-κB-i: 233, p38 MAPK-i: 48. ***P < .002, ANOVA. (B) TNF is required for PU.1 induction by LPS in vivo. Immunofluorescence quantification of PU.1 protein in C57BL/6 or TNF−/− HSCs 24 hours after in vivo LPS or TNF stimulation. Data presented from wild-type: PBS, n = 4; LPS, n = 4; TNF, n = 2 mice. Knockout: PBS, n = 4; LPS, n = 4; TNF, n = 3 mice. *P < .05; **P < .01, ANOVA.
Inflammatory signals are integrated through TNF via NF-κB to directly regulate PU.1 in HSCs in vivo. (A) NF-κB-signaling is essential for PU.1 induction by TNF. Quantification of HSC PU.1-eYFP levels 12 hours after stimulation with NF-κB inhibitor (NEMO-binding domain peptide, 30 μM) or p38 MAPK inhibitor (SB239063, 50 μM). Cells: Ctrl: 162, TNF: 223, NF-κB-i: 233, p38 MAPK-i: 48. ***P < .002, ANOVA. (B) TNF is required for PU.1 induction by LPS in vivo. Immunofluorescence quantification of PU.1 protein in C57BL/6 or TNF−/− HSCs 24 hours after in vivo LPS or TNF stimulation. Data presented from wild-type: PBS, n = 4; LPS, n = 4; TNF, n = 2 mice. Knockout: PBS, n = 4; LPS, n = 4; TNF, n = 3 mice. *P < .05; **P < .01, ANOVA.
Here, we identify extracellular TNF as a regulator of PU.1 that acts via NF-κB dependent signaling to induce the lineage instructing TF PU.1 directly in HSCs in vitro and in vivo. We further confirm the previously reported in vitro induction of PU.1 by IL-1β in HSCs.21 In vivo, several cytokines that are elicited during a LPS induced cytokine storm, including IL-1β, IFNs, and CSF1 have been suggested to induce PU.1.23,27 However, our data demonstrate that TNF production is required for induction of PU.1 in HSPCs by LPS, placing TNF as the direct regulator of PU.1 during acute inflammation. In line with PU.1 expression in HSCs shown here and by Hoppe et al,3 PU.1 has been shown to be required for normal HSC function.29 At the same time, overexpression of PU.1 and TNF stimulation reduces HSC self-renewal and induces myeloid differentiation.21,30,31 It is therefore likely that PU.1 expression levels and dynamics have to be precisely regulated for normal hematopoiesis. Here, we demonstrate the relevance of cell extrinsic TNF signals for hematopoietic PU.1 expression. Future studies should also extend the investigation to study the impact of cytokines on other key hematopoietic cell fate determining TFs and carefully dissect the relationship between cytokine effects on TFs and cell fate in vivo.
The online version of this article contains a data supplement.
The publication costs of this article were defrayed in part by page charge payment. Therefore, and solely to indicate this fact, this article is hereby marked “advertisement” in accordance with 18 USC section 1734.
Acknowledgments
M.E. was supported by a European Molecular Biology Organization (EMBO) Long-Term Fellowship (ALTF 825-2012) and a ETH Zurich Career Seed Grant (SEED-41 16-1). T.S. was supported by Swiss National Science Foundation grants 31003A_156431 and _179490. T.S., S.S., and O.H. acknowledge financial support from SystemsX.ch.
Authorship
Contribution: M.E. designed and conducted experiments, analyzed data, and wrote the manuscript with N.A. and T.S.; P.S.H. developed immunofluorescence and continuous single cell PU.1 quantification; S.S. and O.H. provided tracking and quantification software and analyzed data; H.-M.K. and J.S. provided statistical analyses; D.L. and K.D.K. maintained live cell microscopy; C.N. generated PU.1-eYFP mice; and T.S. designed and supervised the study.
Conflict-of-interest disclosure: The authors declare no competing financial interests.
Correspondence: Timm Schroeder, Department of Biosystems Science and Engineering, ETH Zurich, Mattenstr 26, 4058 Basel, Switzerland; e-mail: timm.schroeder@bsse.ethz.ch.
