

Key Points
We outline a biomarker-driven treatment strategy for targeting MCL1 in TCL.
AZD5991 shows promising activity as both a single agent and in combination with CHOP-based therapy.

Abstract
There is a pressing need for more effective therapies to treat patients with T-cell lymphomas (TCLs), including first-line approaches that increase the response rate to cyclophosphamide, adriamycin, vincristine, and prednisone (CHOP) chemotherapy. We characterized the mitochondrial apoptosis pathway in cell lines and patient-derived xenograft (PDX) models of TCL and assessed the in vitro efficacy of BH3 mimetics, including the BCL2 inhibitor venetoclax, the BCL2/BCL-xL inhibitor navitoclax, and the novel MCL1 inhibitor AZD5991. The abundance of antiapoptotic BCL2 family members based on immunoblotting or RNA transcript levels correlated poorly with the activity of BH3 mimetics. In contrast, the functional approach BH3 profiling reliably predicted sensitivity to BH3 mimetics in vitro and in vivo. We used BH3 profiling to select TCL PDX that were dependent on MCL1. Mice xenografted with these PDX and treated with AZD5991 had markedly improved survival. The combination of AZD5991 and CHOP achieved synergy based on survival improvement beyond a mathematical “sum of benefits” model. Thus, MCL1 inhibition is a promising strategy as both a single agent and in combination with chemotherapy for patients with TCL and functional dependence on MCL1.
Introduction
T-cell lymphomas (TCLs) are a rare and heterogeneous group of lymphoid malignancies. The World Health Organization defines 29 subtypes of cutaneous TCL (CTCL) and peripheral TCL (PTCL).1 PTCL and advanced stages of CTCL are associated with a very poor prognosis.1,2 With current anthracycline-based induction chemotherapy such as cyclophosphamide, adriamycin, vincristine, and prednisone (CHOP), the majority of patients either do not achieve a remission or experience relapse within 2 years of completing front-line therapy.3 The median overall survival of relapsed/refractory disease is <6 months, and recently approved drugs have failed to significantly improve overall survival.4,5 Thus, there is an urgent need for novel therapeutic strategies that overcome mechanisms of relapse and primary progression.
Evasion of apoptosis is a common mechanism that contributes to drug resistance and tumor progression.6 Multiple hematologic malignancies evade apoptosis through overexpression of anti-apoptotic BCL2 family members.7 For PTCL, though, the relevance of antiapoptotic BCL2 family members remains elusive. Early studies of PTCL used immunohistochemistry (IHC) to assess the expression patterns of antiapoptotic BCL2 family members, including BCL2, BCL-xL, and MCL1.8 A consistent pattern of positive staining for MCL1 and negative staining for BCL2 was reported in ALK-rearranged anaplastic large cell lymphomas (ALK+ ALCL) and enteropathy-associated TCL. For all other subtypes, there was no consistent expression pattern among antiapoptotic BCL2 proteins. In a radiation-induced mouse model, Spinner et al recently highlighted MCL1 as a potential therapeutic target for PTCL.9 However, other studies highlighted BCL2 expression as a negative prognostic factor in PTCL, suggesting biologic relevance.10
The BCL2 inhibitor venetoclax has marked clinical activity against B-cell and myeloid malignancies that are dependent on BCL2.11-13 Similarly, the BCL2/BCL-xL inhibitor navitoclax efficiently kills a broad variety of tumor cells with addiction to 1 or both of these antiapoptotic proteins.14 Targeting of MCL1 with small molecules, unfortunately, has been notoriously difficult. Recent progress in structural modeling and high-throughput screening led to the development of the first generation of clinical-grade MCL1 inhibitors.15 Among these, AZD5991 is a potent and direct macrocyclic inhibitor of MCL1 with a subnanomolar binding affinity to MCL1 and high selectivity vs other BCL2 family proteins.16 AZD5991 was found to be well-tolerated in preclinical studies and is already being tested in patients with relapsed and refractory hematologic malignancies (NCT03218683).
We recently characterized a panel of cell lines and patient-derived xenografts (PDX) of PTCL and CTCL by whole transcriptome RNA sequencing (RNAseq), exome sequencing, and other approaches.17 Here, we use these reagents to characterize the mitochondrial apoptosis pathway using BH3 profiling, which provides a functional readout of which antiapoptotic BH3 protein is crucial for a cell’s survival and how therapeutic agents can modulate those dependences.18-20 Preclinical models of PTCL show a heterogeneous pattern of dependence on antiapoptotic BCL2 family members, but most prominently MCL1. Although RNA and protein expression correlate poorly with sensitivity to therapeutics targeting individual antiapoptotic BH3 proteins, BH3 profiling accurately predicts sensitivities. The MCL1 inhibitor AZD5991 shows promising in vitro and in vivo activity in MCL1-dependent TCL models as a single agent or with CHOP chemotherapy. These results provide a basis for further clinical testing of AZD5991 as a single agent and in combination with CHOP in patients with PTCL.
Methods
Cell lines and PDX models
SR786, KIJK, SUPM2, SUDHL1, L82, and DERL2 cells were obtained from DSMZ; Karpas299, Karpas384, and MyLa cells from Sigma-Aldrich; HUT78, HH, and MJ from ATCC; and DL-40, MTA, and KHYG-1 cells from JCRB. FEPD, MAC2A, OCI-Ly13.2, and OCI-Ly12 were kindly provided by Leandro Cerchietti (Weill Cornell Medicine, New York, NY, as approved by the Ontario Cancer Institute); NKL cells were kindly provided by Jerome Ritz (Dana-Farber Cancer Institute, Boston, MA). SMZ1 cells were kindly provided by Hitoshi Ohno (Tenri Medical Institute, Tenri, Japan). Cells were cultured according to the vendor’s recommendation. Cell lines were routinely tested for mycoplasma (ATCC Universal Mycoplasma Detection Kit) and authenticity was validated by short tandem repeat profiling.
PDX models were generated as recently published21 and are publicly available at http://www.PRoXe.org.
BH3 profiling
Baseline BH3 profiling and dynamic BH3 profiling were performed as published previously.18-20 For dynamic BH3 profiling, cells were incubated with the indicated drug for 16 to 18 hours before BH3 profiling. Briefly, cells were permeabilized with 0.002% digitonin and treated with a library of synthetic peptides. Peptides used were BIM at 10, 1, and 0.3 µM, BAD and HRK at 80 µM, and MS1 at 10 or 1 µM. The BIM peptide assesses the functionality of BAX and BAK. BAD binds and antagonizes BCL2, BCL-xL, BCLw, and BFL-1. HRK specifically binds and antagonizes BCL-xL. MS1 binds and antagonizes MCL1. Controls used were dimethyl sulfoxide (negative control) and alamethicin (positive control). Alamethicin is a pore-forming peptide that permeabilizes mitochondria independently of BCL-2 family proteins and serves as a positive control. Cells were incubated with the peptides for 1 hour at 25°C and subsequently fixed with 4% paraformaldehyde for 10 minutes. Finally, intracellular cytochrome c was stained with an immunofluorescence-labeled antibody and cells were subjected to flow cytometry. Relative cytochrome c release was assessed by 1 − [(sample-pos.ctrl.)/(neg.ctrl.-pos.ctrl.)].
In vivo experiments
All in vivo experiments were conducted under Dana-Farber Cancer Institute Animal Care and Use Committee protocol #13-034 and Public Health Service animal assurance #A3023-01. A full description of each PDX model is available online at the Public Repository of Xenografts (www.PRoXe.org), including clinical history and genomic data. Animal work was performed in Nod.CgPrkdcscid.IL2rgtm1Wjl/SzJ mice purchased from Jackson Laboratories, as published previously.21 Tumor burden was monitored periodically based on engraftment kinetics of each model by flow cytometry of peripheral blood using human CD45 (BD Bioscience 560367) and CD2 (BioLegend 300213) antibodies or tumor size by digital caliper measurement for subcutaneous models. Tumor size was measured in 2 perpendicular dimensions, and volume was calculated as [(longest dimension × perpendicular dimension2)/2]. When mice were sufficiently engrafted, they were randomized into treatment arms by peripheral blood disease or tumor volume so that each arm contained mice with the same mean tumor burden.
Mice were monitored daily for clinical signs of disease and humanely euthanized when they reached a clinical end point or a subcutaneous tumor reached 2 cm in the longest dimension.
AZD5991 was formulated in 30% hydroxy propyl-beta-cyclodextrin and administered at 100 mg/kg IV on day 1 (d1), once weekly, for the experiment illustrated in Figure 3A-F and d1+d2 weekly for experiments illustrated in Figure 4B-C,E-G. Thirty percent hydroxy propyl-beta-cyclodextrin served as a vehicle control. For CHOP, the following drugs were administered: cyclophosphamide 30 mg/kg intraperitoneally (IP) d1, doxorubicin 2.48 mg/kg IP d1, vincristine 0.38 mg/kg IV d1, and prednisone 2 mg/kg IP d1-5. Phosphate-buffered saline served as a vehicle control.
Modeling of synergy
To assess additive vs synergistic activity of AZD5991+CHOP in vivo, the Bliss independence model was adapted to survival analysis. With this approach, treatments are Bliss “independent” if the fraction of cells surviving combination therapy equals the product of fractions that survive the individual treatments (eg, if 1 treatment kills 90% and another kills 50%, Bliss independence predicts that the combination kills 95%).22 Assuming exponential growth of cancer cells in vivo, Bliss independence implies that the increase in survival time because of combination treatment (compared with untreated control) equals the sum of increases in survival time of individual treatments. Apart from assumptions of independence and exponential growth, the sum of survival benefits is by itself an objective benchmark to determine when the benefit of a combination therapy is more than the sum of its parts. A Weibull distribution {exp[−(t/β)α]}23 was fitted to survival data for each condition (untreated, AZD5991, CHOP, AZD5991+CHOP), and distributions of survival benefits (treated survival time − untreated survival time) were computed for each treatment. Survival benefits of AZD5991 and CHOP were summed and added to the untreated survival distribution to compose a “sum of benefits” survival distribution. Confidence intervals were based on 1000 such simulations, in which each treatment’s survival distribution was a likelihood-weighted sample of Weibull parameters (α, β) based on the relative likelihood of having made the survival observations O = (t1, t2,…ti) given those parameters: L(O | α, β) = Πi{exp[−(ti/β)α] × tiα−1 × α × β−α}. The P value for synergy between AZD5991 and CHOP was the probability to draw data from the sum of benefits model ensembles with median survival duration equal to or greater than was experimentally observed for AZD5991+CHOP.
See supplemental Data (available on the Blood Web site) for additional information.
Results
Expression of BH3 proteins is highly heterogeneous across TCLs
To assess the mitochondrial apoptosis pathway in preclinical models of TCL, we used 21 TCL cell lines from 8 different subtypes (Figure 1).17 First, we assessed the abundance of key proteins of the mitochondrial apoptosis pathway, including the effector proteins BAX and BAK, the activator BIM, and anti-apoptotic proteins BCL2, BCL-xL, and MCL1. All cell lines expressed BAX and/or BAK, whereas BIM expression was low or absent in ALK+ ALCL and variable in other subtypes. Consistent with previous IHC of primary samples,8 ALK+ ALCL lines consistently expressed MCL1 at appreciable levels but not BCL2. Excluding ALK+ ALCL, 10 of 15 lines expressed BCL2. Notably, 3 of 4 CTCL lines showed high expression levels of BCL-xL. In line with previous reports, Karpas-299 cells showed high expression of the MCL1 antagonist NOXA (Figure 1A).24
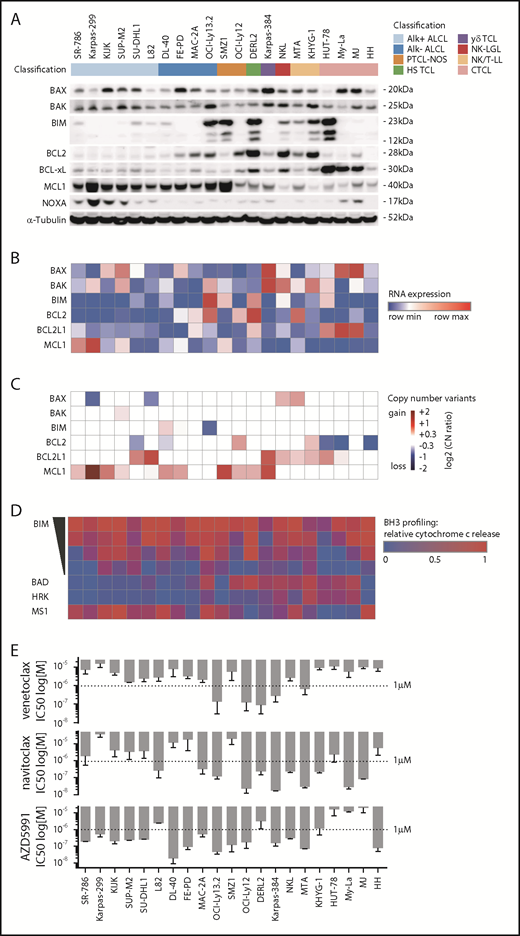
A characterization of the BCL2 family in cell line models of TCL. (A) Immunoblot of BAX, BAK, BIM, BCL2, BCL-xL, MCL1, NOXA, and α-Tubulin. (B) RNA expression levels by reads per kilobase of transcript, per million mapped reads, corresponding to panel A. (C) Copy number variants by whole exome sequencing, corresponding to panels A and B. (D) BH3 profiling corresponding to panels A-C using BIM at 10, 1, 0.3, and 0.1 µM; BAD and HRK at 80 µM; and MS1 at 10 µM. The heatmap illustrates mean values of the relative cytochrome c release in ≥3 independent replicates per cell line. (E) IC50 values of venetoclax (ABT-199), navitoclax (ABT-263), and AZD5991 at 72 hours corresponding to panels A-D. Bar graphs indicate mean values of at least 2 independent experiments in quadruplicates, error bars indicate the standard error of the mean.
A characterization of the BCL2 family in cell line models of TCL. (A) Immunoblot of BAX, BAK, BIM, BCL2, BCL-xL, MCL1, NOXA, and α-Tubulin. (B) RNA expression levels by reads per kilobase of transcript, per million mapped reads, corresponding to panel A. (C) Copy number variants by whole exome sequencing, corresponding to panels A and B. (D) BH3 profiling corresponding to panels A-C using BIM at 10, 1, 0.3, and 0.1 µM; BAD and HRK at 80 µM; and MS1 at 10 µM. The heatmap illustrates mean values of the relative cytochrome c release in ≥3 independent replicates per cell line. (E) IC50 values of venetoclax (ABT-199), navitoclax (ABT-263), and AZD5991 at 72 hours corresponding to panels A-D. Bar graphs indicate mean values of at least 2 independent experiments in quadruplicates, error bars indicate the standard error of the mean.
The corresponding gene expression levels were assessed by RNAseq (Figure 1B). We identified heterogeneous correlations between the RNA expression levels by reads per kilobase of transcript, per million mapped reads and protein abundance for BCL2 family members (supplemental Figure 1A). Copy number gains involving the MCL1, BCL2, and BCL2L1 (encoding BCL-xL) loci were present in 10, 2, and 8 cell lines, respectively (Figure 1C). These gains were largely mutually exclusive (P = .0074, Fisher’s exact test), with only 3 of 17 lines that harbored a copy number gain having gains at >1 locus (Figure 1C).
To functionally characterize the mitochondrial apoptosis pathway, we used BH3 profiling. BH3 profiling uses a library of synthetic peptides to dissect the functional relevance of each BCL2 family member in a cell’s apoptosis machinery.18,19 The peptides are mainly derived from the BH3 domain of the different pro-apoptotic BCL2 family members. Upon treatment with a specific peptide, mitochondrial cytochrome c release is used as a marker for mitochondrial outer membrane permeabilization, the “point of no return” in the induction of apoptosis.
Addition of different amounts of a BH3 protein derived from BIM, which is a fairly promiscuous, pro-apoptotic activator, can be used to quantify the extent to which a cell is “primed” to undergo mitochondrial outer membrane permeabilization. Apoptotic priming significantly differed across TCL lines, ranging from highly primed cells (DL-40, OCI-Ly13.2, SMZ-1) to very unprimed cells (HUT-78) (Figure 1D). Apoptotic priming correlated with response to both doxorubicin (r = −0.86; P = .002) and etoposide (r = −0.79; P = .0053) in multiple TCL lines (supplemental Figure 2).
Next, we used BH3 profiling to define the dependence of each line on specific antiapoptotic proteins. The BAD peptide binds and antagonizes BCL2, BCL-xL, and BCL-w. The HRK peptide specifically binds and antagonizes BCL-xL; thus, BCL2-dependent cell lines show cytochrome c release upon treatment with BAD, but not with HRK (OCI-Ly12). Similarly, BCL-xL–dependent cell lines show cytochrome c release upon treatment with both BAD and HRK (MyLa, MJ) (Figure 1D). To assess MCL1 dependence, we used the MS1 peptide, a designed peptide with high affinity to MCL1 and >40-fold specificity over other BCL2 paralogs.25 Notably, we identified MCL1 dependence in 15 of 21 cell lines (Figure 1D). Importantly, MTA and HH cell lines showed MCL1 dependence by BH3 profiling, but low MCL1 RNA expression and protein abundance and no copy number gains at the MCL1 locus. Obversely, Karpas299 cells showed a high copy number gain of MCL1 and strong MCL1 expression, but only moderate dependence on MCL1 by BH3 profiling.
We next subjected cell lines to treatment with venetoclax (ABT-199), navitoclax (ABT-263), and AZD5991 at varying doses: venetoclax had a 50% inhibition (IC50) <1 µM in only 5 of 21 lines, whereas navitoclax had an IC50 <1 µM in 11 lines. Notably, 15 of 21 cell lines had an IC50 <1 µM to AZD5991 (Figure 1E). AZD5991 induced apoptosis by Annexin V positivity within 4 hours in MCL1-dependent cell lines (SMZ1, FEPD), but not in MCL1-independent HUT-78 cells (supplemental Figure 1B).
To identify predictive biomarkers of response to BH3 mimetics, we correlated the IC50 value for each BH3 mimetic with either protein abundance, RNA expression level, or the functional dependence (as assessed by BH3 profiling). For all 3 drugs, BH3 profiling showed the best correlation (P < .001), although RNA expression and protein abundance were significantly associated with IC50 in multiple contexts (Figure 2A). Next, we searched for a threshold of MCL1 dependence as assessed by BH3 profiling that would discriminate AZD5991-sensitive and AZD5991-resistant cell lines. Using receiver operating characteristic curves, we defined “functional dependence” on MCL1 as relative cytochrome c release of ≥0.25 by BH3 profiling upon addition of the MS1 peptide. With this definition, BH3 profiling accurately categorized all 21 lines (100% sensitivity, 100% specificity) as sensitive or resistant to AZD5991 (Figure 2B).
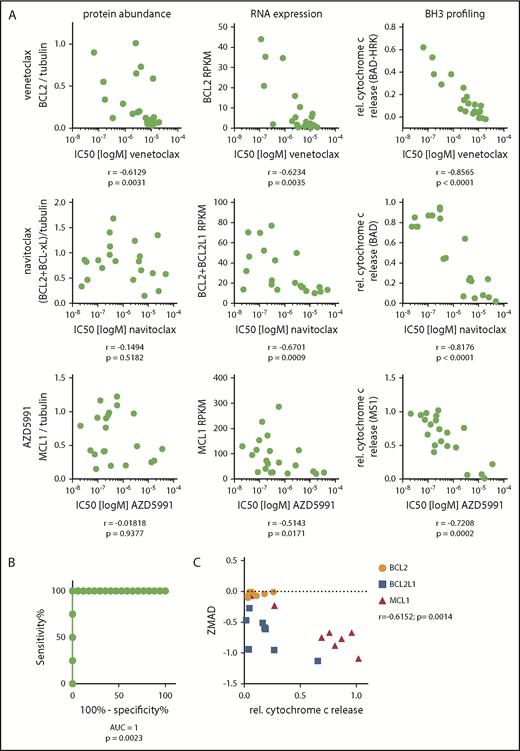
BH3 profiling predicts sensitivity to BH3 mimetics. (A) Spearman correlations of the IC50 of venetoclax, navitoclax, and AZD5991 with either protein abundance, gene expression by RNAseq, or functional dependence assessed by BH3 profiling. Cell lines: n = 21. (B) Receiver operating characteristic curve of the IC50 values of AZD5991 in cell lines with >0.25 vs ≤0.25 relative cytochrome c release upon treatment with 10 µM MS1. (C) Correlation of dependence on BCL2, BCL2L1 (BCL-xL), or MCL1 defined by relative cytochrome c release by BH3 profiling and the correlating dependency score resulting from a genome-wide CRISPR Cas9 screen (ZMAD score).
BH3 profiling predicts sensitivity to BH3 mimetics. (A) Spearman correlations of the IC50 of venetoclax, navitoclax, and AZD5991 with either protein abundance, gene expression by RNAseq, or functional dependence assessed by BH3 profiling. Cell lines: n = 21. (B) Receiver operating characteristic curve of the IC50 values of AZD5991 in cell lines with >0.25 vs ≤0.25 relative cytochrome c release upon treatment with 10 µM MS1. (C) Correlation of dependence on BCL2, BCL2L1 (BCL-xL), or MCL1 defined by relative cytochrome c release by BH3 profiling and the correlating dependency score resulting from a genome-wide CRISPR Cas9 screen (ZMAD score).
To genetically validate dependence on specific BCL2 family members, we mined our recent genome-wide CRISPR/Cas9 dropout screen of 8 TCL cell lines (SR786, Karpas299, KIJK, SUPM2, L82, MAC2A, SMZ1, MyLa).17 The z score with median absolute deviation (ZMAD) scores from this screen describe the dependence of a cell line on a specific gene. As expected, we found a significant correlation (r = −0.6152, P = .0014) of the ZMAD score and relative cytochrome c release by BH3 profiling for BCL2, BCL2L1 (encoding BCL-xL) and MCL1 (Figure 2C).
AZD5991 is active against TCL PDXs in vivo as a single agent or in combination with CHOP
To assess the in vivo efficacy of AZD5991, we first used the ALK+ ALCL model WCTL-91953, which was developed from a patient who had relapsed after CHOP, and has a strong MCL1 dependence based on BH3 profiling (Figure 3A). After engraftment, mice were randomized to receive either vehicle or AZD5991 100 mg/kg once (d1) every week via IV administration. Three mice per arm were euthanized for pharmacodynamic analysis 24 hours after the first dose. At this time point, tumor size was already reduced ∼60% compared with vehicle-treated mice (supplemental Figure 3A), with ∼50% of remaining cells expressing the apoptotic marker Annexin V (supplemental Figure 3B). The remaining mice were treated weekly with AZD5991 or vehicle and euthanized when their tumor reached 2 cm in the longest dimension. Overall, AZD5991 treatment was very well tolerated with a slight white blood cell reduction, no thrombocytopenia, and stable weight (supplemental Figure 3C-D). Measurement of tumor volumes illustrated that each weekly treatment with AZD5991 rapidly reduced tumor size but that tumors regrew before the next dose (Figure 3B-C). Notably, 3 mice from the AZD5991-treated cohort required euthanization on day 21 (ie, before the fourth dose of AZD5991) because of tumor diameter reaching the end point criteria of ≥2 cm. Still, mice treated with AZD5991 had significantly prolonged survival compared with vehicle-treated mice (Figure 3D). Tumors harvested from mice euthanized for progression while receiving weekly AZD5991 remained dependent on MCL1 based on BH3 profiling (supplemental Figure 3E), suggesting that the schedule of drug administration was allowing MCL1-dependent cells to grow upon drug metabolism/elimination and that an alternate dosing regimen could improve outcome. We applied the same in vivo treatment schedule to mice xenografted with the T-PLL model DFTL-28776, which is not dependent on MCL1 by BH3-profiling (Figure 3E). As expected, treatment with AZD5991 offered no appreciable survival benefit in these mice (Figure 3F).
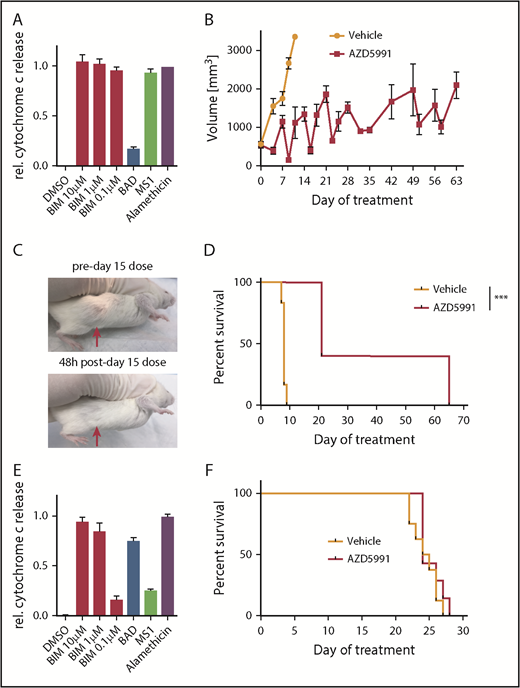
Activity of AZD5991 and AZD5991+CHOP in vivo. (A) BH3 profile of WCTL-91953. (B) Tumor volume of mice treated with vehicle or AZD5991 once weekly (d1), n = 6 per arm. (C) Representative example of a subcutaneous tumor of WCTL-91953 before and after the third dose of AZD5991. (D) Survival curve of mice engrafted with WCTL-91953 and treated with either vehicle or AZD5991. (E) BH3 profile of the T-PLL PDX DFTL-28776. (F) Survival of mice engrafted with DFTL-28776 and treated with either vehicle or AZD5991 once weekly (d1), n = 6 per arm. DMSO, dimethyl sulfoxide.
Activity of AZD5991 and AZD5991+CHOP in vivo. (A) BH3 profile of WCTL-91953. (B) Tumor volume of mice treated with vehicle or AZD5991 once weekly (d1), n = 6 per arm. (C) Representative example of a subcutaneous tumor of WCTL-91953 before and after the third dose of AZD5991. (D) Survival curve of mice engrafted with WCTL-91953 and treated with either vehicle or AZD5991. (E) BH3 profile of the T-PLL PDX DFTL-28776. (F) Survival of mice engrafted with DFTL-28776 and treated with either vehicle or AZD5991 once weekly (d1), n = 6 per arm. DMSO, dimethyl sulfoxide.
To further elicit resistance, we treated 3 sensitive TCL lines with AZD5991 with repeated doses over 18 days; however, cells that regrew remained sensitive to the drug and dependent on MCL1 based on BH3 profiling (supplemental Figure 3F). Together, these data indicate that (1) BH3 profiling can identify tumors sensitive to MCL-1 inhibition in vivo and (2) that MCL1-dependent TCLs responsive to AZD5991 may require combinations to maximize effect. Only 40% to 50% of patients with TCL who receive upfront CHOP will achieve a complete remission; thus, there is an urgent need for more effective strategies or combinations that can increase the remission rate. We reasoned that adding AZD5991 to CHOP would be both well-tolerated and improve efficacy.
First, we addressed the hypothesis that some TCLs will become more dependent on MCL1 for survival upon exposure to chemotherapies such as those in CHOP. We performed dynamic BH3 profiling20 of cell lines that did not have a strong baseline MCL1 dependence (Karpas299, L82, SUPM2). With this approach, cells are exposed to doxorubicin or vincristine before BH3 profiling to quantify the extent of apoptotic priming induced by the chemotherapy. Exposure to vincristine increased overall mitochondrial priming across all cell lines, doxorubicin increased priming in L82 cells. Specifically, exposure to vincristine or doxorubicin induced apoptotic priming to the MS1 peptide in all 3 of 3 lines and 1 of 3 lines, respectively (Figure 4A).
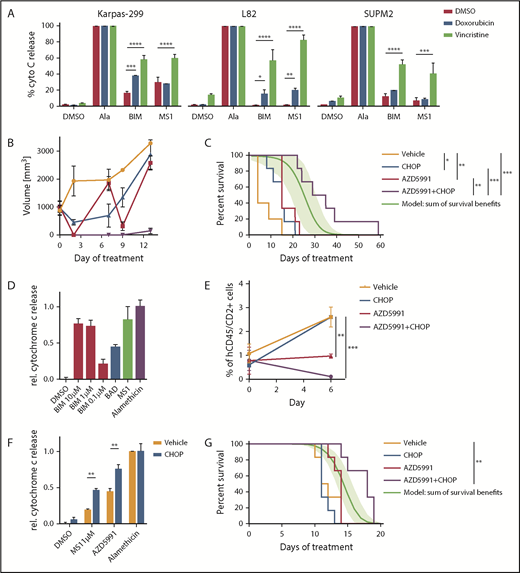
Combination of AZD5991 and CHOP. (A) Dynamic BH3 profiling indicating changes in apoptotic priming and MCL1 dependence induced by doxorubicin (250 nM) or vincristine (100 nM). Peptide concentrations were 0.3 µM for BIM and 1 µM for MS1. Bar graphs indicate ≥2 replicates of a representative experiment. Statistics was performed with 2-way analysis of variance and Bonferroni test. (B) Tumor volume of mice engrafted with WCTL-91953 and treated with either vehicle, CHOP, AZD5991, or CHOP+AZD5991. (C) Survival of mice engrafted with WCTL-91953 and treated with either vehicle, CHOP, AZD5991. or CHOP+AZD5991. CHOP: 1 cycle, d1-d5; AZD5991: d1 and d2 weekly for 3 weeks; n = 6 per arm. The green line indicates a calculated additive model, with 95% confidence intervals indicated as a green shaded range. P value of synergy of AZD5991+CHOP over additivity: 0.024. (D) BH3 profile of the hepatosplenic TCL PDX CBTL-81777. BIM concentrations as indicated, BAD, 80 μM; MS1, 10 μM. (E) Peripheral blood disease burden of mice engrafted with CBTL-81777 as assessed by hCD45/hCD2+ cells on days 0 and 6 after treatment with vehicle, CHOP, AZD5991, or CHOP+AZD5991. (F) BH3 profiles of mice engrafted with CBTL-81777, treated with either vehicle or CHOP (n = 3 per arm), and euthanized 48 hours after initiation of treatment. MS1 peptide, 1 µM; AZD5991, 1 µM. Bar graphs indicate ≥2 biological replicates (1 CHOP-treated sample was censored because of low quality). Statistics were performed with 2-way analysis of variance and Bonferroni test. (G) Survival of mice engrafted with CBTL-81777 and treated with either vehicle, CHOP, AZD5991, or CHOP+AZD5991. CHOP, 1 cycle, d1-d5; AZD5991, d1 and d2 weekly; n = 6 per arm. The green line indicates a calculated additive model, with 95% confidence intervals indicated as a green shaded range. P value of synergy of AZD5991+CHOP over additivity: .0005. All data points indicate mean values; error bars indicate standard error of the mean. *P < .05; **P < .01; ***P < .001; ****P < .0001.
Combination of AZD5991 and CHOP. (A) Dynamic BH3 profiling indicating changes in apoptotic priming and MCL1 dependence induced by doxorubicin (250 nM) or vincristine (100 nM). Peptide concentrations were 0.3 µM for BIM and 1 µM for MS1. Bar graphs indicate ≥2 replicates of a representative experiment. Statistics was performed with 2-way analysis of variance and Bonferroni test. (B) Tumor volume of mice engrafted with WCTL-91953 and treated with either vehicle, CHOP, AZD5991, or CHOP+AZD5991. (C) Survival of mice engrafted with WCTL-91953 and treated with either vehicle, CHOP, AZD5991. or CHOP+AZD5991. CHOP: 1 cycle, d1-d5; AZD5991: d1 and d2 weekly for 3 weeks; n = 6 per arm. The green line indicates a calculated additive model, with 95% confidence intervals indicated as a green shaded range. P value of synergy of AZD5991+CHOP over additivity: 0.024. (D) BH3 profile of the hepatosplenic TCL PDX CBTL-81777. BIM concentrations as indicated, BAD, 80 μM; MS1, 10 μM. (E) Peripheral blood disease burden of mice engrafted with CBTL-81777 as assessed by hCD45/hCD2+ cells on days 0 and 6 after treatment with vehicle, CHOP, AZD5991, or CHOP+AZD5991. (F) BH3 profiles of mice engrafted with CBTL-81777, treated with either vehicle or CHOP (n = 3 per arm), and euthanized 48 hours after initiation of treatment. MS1 peptide, 1 µM; AZD5991, 1 µM. Bar graphs indicate ≥2 biological replicates (1 CHOP-treated sample was censored because of low quality). Statistics were performed with 2-way analysis of variance and Bonferroni test. (G) Survival of mice engrafted with CBTL-81777 and treated with either vehicle, CHOP, AZD5991, or CHOP+AZD5991. CHOP, 1 cycle, d1-d5; AZD5991, d1 and d2 weekly; n = 6 per arm. The green line indicates a calculated additive model, with 95% confidence intervals indicated as a green shaded range. P value of synergy of AZD5991+CHOP over additivity: .0005. All data points indicate mean values; error bars indicate standard error of the mean. *P < .05; **P < .01; ***P < .001; ****P < .0001.
We next treated 2 different PDX models with AZD5991, CHOP, and the combination. CHOP was administered as 1 cycle from days 1 through 5. AZD5991 was escalated to a twice weekly (d1 and d2) treatment schedule for 3 weeks. First, we assessed the combination of AZD5991 and CHOP in the ALK+ ALCL WTCL-91953. In line with the initial experiment (Figure 3A-D), AZD5991 treatment led to significant shrinkage of the tumors upon treatment and mice had a significant survival benefit after 3 cycles of treatment (Figure 4B-C). CHOP treatment also induced a response and led to significant survival benefit (Figure 4B-C). However, the combination of CHOP and AZD5991 led to significantly greater tumor reduction (Figure 4B), which translated into superior survival compared with either CHOP alone or AZD5991 alone (Figure 4C). Importantly, the combination delayed the regrowth of tumor, which was observed at day 7 with weekly AZD5991 alone (Figure 4B). CHOP+AZD5991 produced a duration of survival that was significantly longer than an “additivity” model based on the sum of survival benefits of CHOP and AZD5991 applied separately (see “Methods”), consistent with in vivo synergy (P = .024).
The second model tested with the combination of CHOP+AZD5991 was CBTL-81777, which is a hepatosplenic TCL, a disease that rarely responds to CHOP. BH3 profiling of CBTL-81777 cells revealed MCL1 dependence (Figure 4D). Notably, this model showed significantly less cytochrome c release upon treatment with 0.1 µM of the BIM peptide, compared with WCTL-91953 (Figures 3A and 4D). PDX cells were injected intravenously, which results in systemic and orthotopic engraftment in the liver, spleen, bone marrow, and blood.17 Mice were monitored until peripheral blood involvement was detectable by flow cytometry in all mice (mean of human CD45/CD2+ cells across cells upon starting treatment was 0.7%). At that time, mice were randomized to vehicle, AZD5991, CHOP, or combination. Mice were bled 7 days after initial dosing to assess disease burden (Figure 4E). CHOP alone had no effect on blood disease compared with vehicle treatment. Mice treated with AZD5991 had stable disease, whereas mice receiving the combination had significant disease regression (Figure 4E).
In an additional experiment, triplicates of mice engrafted with CBTL-81777 were treated with either vehicle or CHOP. Mice were euthanized 48 hours after initiation of treatment and purified tumor cells were subjected to BH3 profiling. BH3 profiling revealed enhanced MCL1 dependence and augmented cytochrome c release upon ex vivo exposure to AZD5991 in lymphoma cells from CHOP-treated compared with vehicle-treated mice (Figure 4F). This induction of MCL dependence was a significant survival advantage for mice treated with CHOP+AZD5991 compared with mice receiving vehicle (P = .0023), CHOP alone (P = .0004), or AZD5991 alone (P = .0048) (Figure 4G). Again, CHOP+AZD5991 achieved synergy based on a significantly superior survival (P = .0005) compared with that expected from additivity.
Discussion
CHOP-based chemotherapy is curative in <40% of patients with most types of TCL, even when given in the first line. Multiple agents are now US Food and Drug Administration–approved for patients with relapsed/refractory disease, including histone deacetylase inhibitors and pralatrexate, but have relatively low response rates and short progression-free survival.5,26,27 Unfortunately, no biomarkers currently exist to guide therapeutic selection among these agents and thereby increase efficacy within specific populations. In contrast, the anti-CD30 antibody–drug conjugate brentuximab vedotin and the ALK inhibitor crizotinib have extremely high response rates in patients selected based on predictive biomarkers (CD30 expression and ALK rearrangement, respectively).28,29 Thus, there is a pressing imperative to expand the armamentarium of biomarker-driven therapies for patients with TCL.
We used a large panel of previously characterized cell lines and PDX models of TCL that recapitulate features of human TCL.17 Notably, the expression pattern of the antiapoptotic BCL2 family members in these models closely resembled the expression pattern in primary TCL samples as assessed previously by IHC: models of ALK+ ALCL consistently show high expression of MCL1 and absence of BCL2, whereas for other subtypes, expression of antiapoptotic BCL2 family members is heterogeneous.8 Importantly, dependencies across TCL are highly heterogeneous. However, both our data and previous studies highlight MCL1 as the most universally expressed BCL2 family member in TCL.9
AZD5991 is a potent and selective inhibitor of MCL116 that is being tested in a phase 1 trial (NCT03218683). In models of multiple myeloma and acute myeloid leukemia, AZD5991 causes dissociation of the MCL1:BAK complex and activation of mitochondrial apoptosis.16 There is little information indicating whether protein abundance, RNA expression, or DNA sequencing data are sufficient biomarkers when determining which patients are most likely to respond to a certain BH3 mimetic.30,31 Our data indicate that, at least in vitro, these biomarkers are insufficient for predicting response in TCLs. Correlation matrices comparing IC50 values of each cell line treated with the MCL1 inhibitor AZD5991 compared with its MCL1 protein abundance or RNA expression showed minimal or no correlation at best (Figure 2A). In line with previous reports, BH3 profiling was a superior predictor of sensitivity to BCL-2 family member inhibition (Figure 2A-B).19,20 A limitation of BH3 profiling is that it cannot be performed on paraffin-embedded tissue so other biomarkers, including gene expression, may be useful in some contexts. The superior predictive power of the functional BH3 profiling demonstrated here should help prioritize the acquisition of viable tissue in subsequent studies. In other contexts, it has become standard to acquire additional tumor tissue, even if it requires an invasive procedure, when there is a possibility it could guide therapy to highly effective options (eg, EGFR-mutant or ALK-rearranged lung cancer).
We noted that AZD5991 given weekly was well tolerated by xenografted mice but was unable to maintain tumor regression, such that tumor size repeatedly decreased after dosing and then increased over the week before the next dose. We reasoned that a d1, d2 schedule given weekly may maintain higher levels of MCL1 inhibition but that combinations would likely be necessary to maximize efficacy.
Using that schedule, we observed statistically significant benefit from combining CHOP chemotherapy with AZD5991 in 2 different models of PTCL with dependence on MCL1, including a hepatosplenic TCL that had essentially no benefit from CHOP alone. For the latter, BH3 profiling of lymphoma cells from CHOP-treated mice showed enhanced MCL1 dependence and response to AZD5991. We used a statistically rigorous method for defining synergy, a term that has been used very loosely in the literature, by comparing our actual outcomes with a calculated additivity model (Figure 4C,G). We propose that the same rigorous assessment should be used in future survival studies to clarify the difference between incremental benefit, additivity (a mathematically definable extent of benefit) and synergy (statistically significant improvement beyond additivity).
Although the combination of AZD5991+CHOP was tolerated in Nod.CgPrkdcscid.IL2rgtm1Wjl/SzJ mice, additional testing is needed to determine whether this combination causes significant hematologic or nonhematologic toxicity in humans and whether it can increase either the complete response rate or cure rate compared with CHOP alone. The finding that exposure to chemotherapy could increase dependence of some TCL on MCL1 is also particularly noteworthy because it suggests that drugs such as AZD5991 could offer broader benefit in combination with chemotherapy than anticipated solely based on BH3 profiling of untreated lymphoma cells.
In summary, here we provide preclinical evidence for AZD5991 as a novel BH3 mimetic targeting MCL1 in TCL. AZD5991 showed potent single-agent activity in vitro and in vivo in MCL1-dependent models of TCL and in vivo synergy with CHOP chemotherapy. Further clinical testing of MCL1 inhibition is needed as both a single agent and in rational combinations for patients with TCL.
The online version of this article contains a data supplement.
The publication costs of this article were defrayed in part by page charge payment. Therefore, and solely to indicate this fact, this article is hereby marked “advertisement” in accordance with 18 USC section 1734.
Acknowledgments
The authors thank Giorgio Inghirami for providing the PDX model WCTL-91953 and thoughtful assistance.
This work was supported by a Deutsche Forschungsgemeinschaft fellowship grant (KO 4627/2-1) (R.K.). D.M.W. is supported by Leukemia and Lymphoma Society Specialized Center of Research #7011-16 and AstraZeneca. A.C.P. and D.P. are supported by National Institutes of Health, National Cancer Institute grant U54CA225088, and D.P. is supported by National Institutes of Health, National Institute of General Medical Sciences grant T32GM007753.
Authorship
Contribution: R.K. and A.L.C. designed, executed, and analyzed the experiments, and cowrote the manuscript; J.L.C., K.S., S.N.M., A.V.S., W.W., and E.A.B. executed and analyzed experiments; A.C.P. and D.P. analyzed combination treatments; A.L., J.P.S., L.D., A.G.S., and J.C. provided essential reagents; and D.M.W. secured funding, designed and analyzed the experiments, and cowrote the manuscript.
Conflict-of-interest disclosure: D.M.W. received research support from AbbVie, Novartis, Aileron, Daiichi Sankyo, Surface Oncology, and AstraZeneca; licensing fees from AstraZeneca, Aileron, and Novartis; and is a paid consultant for AstraZeneca, EDO Biosciences, Travera, and Novartis. J.P.S., L.D., A.G.S., J.C., and A.L.C. are employees of AstraZeneca. A.L. has received research support from and has been a paid consultant for AstraZeneca, Novartis, and AbbVie, and is also a cofounder of Vivid Bioscience and Flash Therapeutics. The remaining authors declare no competing financial interests.
Correspondence: Raphael Koch, University Medical Center Goettingen, Robert-Koch-Str 40, 37075 Goettingen, Germany; e-mail: raphael.koch@med.uni-goettingen.de; and David M. Weinstock, Dana-Farber Cancer Institute, 450 Brookline Ave, Dana 510B, Boston, MA 02130; e-mail: dweinstock@partners.org.

This feature is available to Subscribers Only
Sign In or Create an Account Close Modal