

Key Points
Defects in DC-CD4 T-cell interaction can result in myeloproliferation

Abstract
Dendritic cells (DCs) are a key cell type in the initiation of the adaptive immune response. Recently, an additional role for DCs in suppressing myeloproliferation was discovered. Myeloproliferative disorder (MPD) was observed in murine studies with constitutive depletion of DCs, as well as in patients with congenital deficiency in DCs caused by mutations in GATA2 or IRF8. The mechanistic link between DC deficiency and MPD was not predicted through the known biology and has remained an enigma. Prevailing models suggest numerical DC deficiency leads to MPD through compensatory myeloid differentiation. Here, we formally tested whether MPD can also arise through a loss of DC function without numerical deficiency. Using mice whose DCs are deficient in antigen presentation, we find spontaneous MPD that is characterized by splenomegaly, neutrophilia, and extramedullary hematopoiesis, despite normal numbers of DCs. Disease development was dependent on loss of the MHC class II (MHCII) antigen-presenting complex on DCs and was eliminated in mice deficient in total lymphocytes. Mice lacking MHCII and CD4 T cells did not develop disease. Thus, MPD was paradoxically contingent on the presence of CD4 T cells and on a failure of DCs to activate CD4 T cells, trapping the cells in a naive Flt3 ligand–expressing state. These results identify a novel requirement for intercellular collaboration between DCs and CD4 T cells to regulate myeloid differentiation. Our findings support a new conceptual framework of DC biology in preventing MPD in mice and humans.
Introduction
Dendritic cells (DCs) are specialized antigen-presenting cells that play a crucial role in coordinating innate and adaptive immune responses. They are primarily recognized for their T cell–priming capacities in the periphery, where they direct responses against infections,1 and in the thymus, where they play an important role in negative selection2-4 and induction of regulatory T (Treg) cells.5 Given these functions, it is unsurprising that DC ablation or deficiency leads to susceptibility to infection and autoimmunity.6-10 A more perplexing manifestation resulting from DC deficiency, in mice and humans, is the development of a spontaneous myeloproliferative disorder (MPD). The connection between DC biology and the regulation of myeloid homeostasis has remained an enigma.
MPD in the setting of DC deficiency was first characterized in mice by 2 groups of investigators contemporaneously; mice expressing diphtheria toxin fragment A in the Rosa locus were crossed with CD11c-Cre mice.11,12 One group reported susceptibility to murine viral infections, variable alterations in T cell subsets, and a form of MPD characterized by monocytic and neutrophilic expansion,11 whereas the other group described spontaneous autoimmunity and significant neutrophilia.12 Subsequently, similar MPD phenotypes or significant neutrophilia have been described in other mouse models of DC deficiency, including IRF8 deficiency,13,14 TAK1 conditional deficiency in CD11c+ cells,15 pan-hematopoietic Cbfβ deficiency,8 and zDC-DTR mice.16 In parallel, clinical analysis of patients with monogenic DC deficiency, such as GATA2 and IRF8 deficiency, has identified similar myeloproliferative and myelodysplastic disorders.7,17-19 Although the pleiotropic effects of mutations in GATA2 and IRF8 may act through various mechanisms to drive MPD, the replication of the myeloproliferative phenotype in DC-depleted mice indicates that a conserved causal relationship underlies these conditions.
The prevailing model to explain the mechanistic link between DC deficiency and MPD is one of differentiation niches, whereby the void left by the absence of DCs results in an excess of growth factors or stimuli that drives myeloid precursor cells into a pathogenic state. However, an alternative hypothesis, that MPD is a direct consequence of a lack of DC function (akin to susceptibility to infection and autoimmunity), has not been formally ruled out. Here, we test whether functional DC deficiency also leads to myeloproliferation using mice in which DCs are present but deficient in antigen-presenting function. Mice with DCs deficient for MHC class II (MHCII) developed MPD with splenomegaly, neutrophilia, and extramedullary hematopoiesis. Surprisingly, crossing these mice to a RagKO background rescued the phenotype, with CD4 T cells required for disease manifestation. Naive antigen-inexperienced CD4 T cells expressed higher levels of Flt3L, providing mechanistic insight into the requirement for intercellular collaboration between DCs and CD4 T cells to regulate myeloid differentiation and prevent MPD.
Materials and methods
Mice
CD11cΔMHCII mice were generated by crossing CD11c-Cre mice20 and MHCIIflox mice,21 both on the C57BL/6 background. Wild-type (WT) controls were Cre-negative MHCIIflox littermates or regular C57BL/6 mice. The CD11cΔMHCII strain was crossed with Rag1KO mice22 and β2mKO mice23 strains to create RagKOCD11cΔMHCII and β2mKOCD11cΔMHCII strains, respectively. MHCIIKO mice24 were crossed to the C57BL/6 CD45.1 background. Mice were maintained in specific pathogen–free facilities at the University of Leuven. All experiments were approved by the University of Leuven ethics committee.
Bone marrow–derived DC culture
Single-cell BM suspensions were differentiated in vitro toward DCs for 8 days in RPMI 1640 medium (supplemented with 5% fetal bovine serum, 10 mM HEPES, 100 U/mL penicillin, 100 μg/mL streptomycin, 100× L-glutamine, and 50 μM 2-ME), with the addition of 20 ng/mL granulocyte-macrophage colony-stimulating factor every 2 days (eBioscience/Thermo Fisher Scientific). Cells were plated in 6-well plates at a density of 1 × 10⁶ cells per milliliter and incubated at 37°C in humidified air with 5% CO2. On day 6, cells were harvested by vigorous washing, and supernatant was transferred to a new plate to mature for an additional 48 hours without granulocyte-macrophage colony-stimulating factor (differentiated plate). On day 8, both plates (undifferentiated and differentiated) were harvested and evaluated by flow cytometry.
Cell processing and flow cytometry
Spleen and lymph nodes were cut in small pieces and digested with collagenase D (0.5 mg/mL; Roche). Single-cell suspensions were prepared from mouse thymus, lymph nodes, bone marrow, and spleen. All cells were fixed with BD Cytofix (BD Biosciences) or fixed and permeabilized with an eBioscience Foxp3 staining kit (eBioscience/Thermo Fisher Scientific). For intracellular cytokine staining, lymphocytes were plated at 5 × 10⁵ cells per well in 96-well tissue culture plates in complete RPMI containing phorbol myristate acetate (50 ng/mL; Sigma-Aldrich), ionomycin (250 ng/mL; Sigma-Aldrich), and monensin (1/1500; BD, Bioscience) for 4 hours at 37°C. Anti-murine antibodies included anti-CD4 (RM4-5), anti-CD8α (53-6.7), anti-Foxp3 (FJK-16s), anti-CD44 (IM7), anti-CD62L (MEL-14), anti-Gr1 (RB6-8C5), anti-CD11b (M1/70), anti-Ly6C (HK1.4), anti-F4/80 (BM8), anti-CD11c (N418), anti-MHCII (M5/114.15.2), anti-CD86 (PO3.1), anti-B220 (RA3-6B2), anti-NK1.1 (PK136), anti-CD3 (145-2c11), anti-Sca1 (D7), anti–c-Kit (2B8), anti-PDCA1 (eBio927), anti-CD31 (390), anti–IL-2 (JES6-5H4), anti–IFN-γ (XMG1.2), anti–IL-4 (BVD6-24G2), and anti–IL-17 (eBio17B7) (all from eBioscience/Thermo Fisher Scientific). Routine data analysis was performed with FlowJo software (see supplemental Figure 1, available on the Blood Web site, for representative gating).
Cluster analysis
The cluster analysis was performed with custom code written in R version 3.4.4.25 The starting data were the leukocytes identified by gating for nondebris singlet events, maintaining the compensation and biexponential transformations applied. Event data from 6 samples were merged, resulting in ∼106 total cells, restricted to the markers CD11b, CD11c, Gr1, Ly6c, and F4/80. The package flowWorkspace v. 3.26.926 was used to import data in the R environment. Clusters were identified with FlowSOM (version 1.10.0)27 and ConsensusClusterPlus (version 1.42.0), using a predetermined number of 10 clusters and default configuration parameters. The t-distributed stochastic neighbor embedding (t-SNE) representation was obtained on a 10% random subsample, using Rtsne (version 0.13)28,29 with default parameters, with the exception of an increase in convergence to 10 000 steps. Plots were prepared with ggplot2 (version 2.2.1)30 and RColorBrewer (version 1.1-2).31
Histology
Mouse tissues were preserved in 10% formalin and processed into paraffin-embedded tissue blocks by Histology Consultation Services. Each block had thin (∼4 µm) sections cut on a microtome, mounted on glass slides, and stained with hematoxylin and eosin. Pathological diagnosis was performed by Biogenetics Research Laboratories.
Quantitative polymerase chain reaction assay
Single-cell suspensions were prepared from mouse spleen and lymph nodes. CD4+ T cells were enriched using a MagniSort Mouse CD4 T cell Enrichment Kit (Thermo Fisher Scientific) and stained with anti-CD25 (PC61.5), anti-CD4 (GK1.5), anti-CD44 (IM7), and anti-CD62L (MEL-14) (all from eBioscience/Thermo Fisher Scientific), and naive and memory populations were sorted on a FACSAria I cytometer (BD Biosciences). Total RNA was isolated using TRIzol Reagent (Invitrogen/Thermo Fisher Scientific). Complementary DNA was synthesized from RNA using a GoScript Reserve Transcription System (Promega). Real-time quantitative PCR (qPCR) was performed using a Primetime qPCR assay (Integrated DNA Technologies) with gene-specific probes (Flt3L PT.58.5907613, Polr2a PT.39a.22214849) on a StepOnePlus real-time PCR system (Applied Biosystems). Analysis was performed with the 2−ΔΔCT method, and quantifications were normalized to the housekeeping gene Polr2a. Experiments were performed with technical duplicates.
Statistical analyses
Single comparisons were analyzed using the nonparametric Mann-Whitney U test. Cumulative incidence curves were analyzed using a log-rank test. Multiple group comparisons were analyzed using 1-way analysis of variance, followed by the Tukey multiple-comparisons test. qPCR data were analyzed by an unpaired t test. All strain comparisons were run in parallel, with the baseline data on WT and CD11cΔMHCII mice repeated in Figures 4-6 to allow direct comparison across strains.
Results
DC functional impairment drives myeloproliferative disease
To determine the mechanistic basis of the relationship between DC deficiency and MPD, we first sought to assess whether myeloproliferation, previously observed in the numerical absence of DCs, can also occur with the loss of the antigen-presenting functions that DCs provide. Therefore, we generated CD11cΔMHCII mice to disrupt the key DC function of professional antigen presentation while maintaining normal DC numbers. CD11cΔMHCII mice appropriately lacked MHCII expression on the CD11c+ compartment (Figure 1A) but had normal splenic DC percentages within the classical DC compartments (Figure 1B). The absolute number of DCs was unchanged (supplemental Figure 3A). The plasmacytoid DC compartment also remained fairly similar at all time points, with a small decrease in CD11cΔMHCII mice at 1 year of age in comparison with WT animals (Figure 1C). Likewise, in vitro DC maturation was normal in CD11cΔMHCII mice (supplemental Figure 2). Despite no major differences in broad DC subsets in CD11cΔMHCII mice, we did observe a significant shift from CD8+CD11b− conventional DCs (cDCs) to CD8−CD11b+ cDCs over time (supplemental Figure 3B-C), indicating secondary effects to impaired antigen presentation. These data support the use of CD11cΔMHCII mice as a system to study DC functional impairment without the induction of a numerical deficit. Having validated the CD11cΔMHCII system, we monitored the mice for signs of disease. CD11cΔMHCII mice developed normally, although their total weight decreased compared with WT mice over time (Figure 1D). CD11cΔMHCII mice developed splenomegaly as early as 12 weeks, with markedly increasing severity and incidence over time (Figure 1E-F). To investigate the origin of the splenomegaly in CD11cΔMHCII mice we first took a histological approach. Neither the spleens nor other organs showed any signs of lymphocytic infiltrate in CD11cΔMHCII mice, suggesting that splenomegaly was not secondary to autoimmune disease (supplemental Figure 4). However, the spleen and liver demonstrated signs of extramedullary hematopoiesis, with hematopoietic stem cells observed in both organs (supplemental Figure 4). These data identify CD11cΔMHCII mice as potentially developing MPD, analogous to the DC-deficient models.
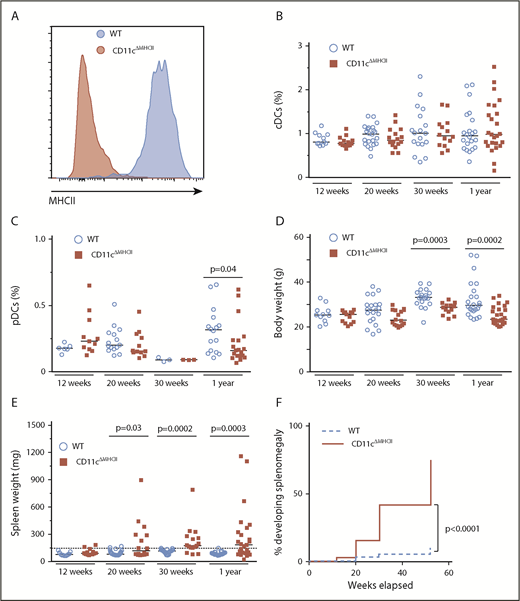
DC functional impairment drives myeloproliferative disease. WT and CD11cΔMHCII mice were assessed by flow cytometry at 12 weeks, 20 weeks, 30 weeks, and 1 year of age. (A) Representative line graph of MHCII in splenic CD11c+ cells in wild-type and CD11cΔMHCII mice. (B) Percentage of cDCs in WT and CD11cΔMHCII mice at 12 weeks (n = 11, 13), 20 weeks (n = 22, 16), 30 weeks (n = 18, 14), and 1 year (n = 22, 25) of age. (C) Plasmacytoid DCs in WT and CD11cΔMHCII mice at 12 weeks (n = 6, 11), 20 weeks (n = 15, 12), 30 weeks (n = 3, 3), and 1 year (n = 16, 19) of age. (D) WT and CD11cΔMHCII mice were assessed for body weight at 12 weeks (n = 11, 13), 20 weeks (n = 21, 16), 30 weeks (n = 19, 13), and 1 year (n = 24, 25) of age and (E) for spleen weight at 12 weeks (n = 11, 13), 20 weeks (n = 22, 16), 30 weeks (n = 20, 16), and 1 year (n = 23, 25) of age. Dashed line indicates threshold for splenomegaly (2 standard deviations above the mean of WT mice from all age groups). Median and individual data points are shown. (F) Cumulative incidence plot of splenomegaly over time in WT and CD11cΔMHCII mice using a Kaplan-Meier curve (all mice were censored at the time of analysis). The log-rank test was used for comparison between curves.
DC functional impairment drives myeloproliferative disease. WT and CD11cΔMHCII mice were assessed by flow cytometry at 12 weeks, 20 weeks, 30 weeks, and 1 year of age. (A) Representative line graph of MHCII in splenic CD11c+ cells in wild-type and CD11cΔMHCII mice. (B) Percentage of cDCs in WT and CD11cΔMHCII mice at 12 weeks (n = 11, 13), 20 weeks (n = 22, 16), 30 weeks (n = 18, 14), and 1 year (n = 22, 25) of age. (C) Plasmacytoid DCs in WT and CD11cΔMHCII mice at 12 weeks (n = 6, 11), 20 weeks (n = 15, 12), 30 weeks (n = 3, 3), and 1 year (n = 16, 19) of age. (D) WT and CD11cΔMHCII mice were assessed for body weight at 12 weeks (n = 11, 13), 20 weeks (n = 21, 16), 30 weeks (n = 19, 13), and 1 year (n = 24, 25) of age and (E) for spleen weight at 12 weeks (n = 11, 13), 20 weeks (n = 22, 16), 30 weeks (n = 20, 16), and 1 year (n = 23, 25) of age. Dashed line indicates threshold for splenomegaly (2 standard deviations above the mean of WT mice from all age groups). Median and individual data points are shown. (F) Cumulative incidence plot of splenomegaly over time in WT and CD11cΔMHCII mice using a Kaplan-Meier curve (all mice were censored at the time of analysis). The log-rank test was used for comparison between curves.
To test for MPD in CD11cΔMHCII mice, we used a myeloid-based staining panel for flow cytometric analysis of the spleen. We first ran an exploratory unbiased clustering analysis, using custom code. Of the leukocyte clusters observed in the spleen, 2 were predominantly derived from CD11cΔMHCII cells: 1 cluster consisting of a neutrophil population (CD11b+GR1high) and 1 cluster with myeloid precursor cells (CD11b+Gr1intCD11c−Ly6ChighF4/80low) (Figure 2A). To investigate the kinetics of these population differences, a conventional flow cytometry analysis approach was used. A massive progressive expansion of splenic CD11b+GR1high neutrophils was observed in CD11cΔMHCII mice as early as 12 weeks (Figure 2B-C). Confirming the results of the clustering analysis, the cells making up the neutrophilic expansion skewed toward immature phenotypes, because there was a significantly higher proportion of neutrophil precursor cells, indicating disordered myeloid hematopoiesis (Figure 2D-E). To establish the presence of extramedullary hematopoiesis, we measured the number of splenic stem cells (Lin−CD11b−Sca1+cKit+) and found a significant increase in CD11cΔMHCII mice compared with WT mice (Figure 2F-G). Taken together, these results demonstrate that CD11cΔMHCII mice reproduce the MPD phenotype observed with DC numerical deficiency, indicating that functional DC defects, rather than a lack of DCs in a specific differentiation niche, lead to myeloproliferative disease.
![Figure 2. Mixed myeloid composition of myeloproliferative disease in CD11cΔMHCII mice. WT and CD11cΔMHCII mice were assessed by flow cytometry at 12 weeks, 20 weeks, 30 weeks, and 1 year of age. (A) t-SNE projection of splenocytes of 1-year-old mice stained with myeloid markers (CD11b, Gr1, Ly6C, CD11c, and F4/80). Cells are grouped into clusters using FlowSOM, with blue representing WT splenocytes and red representing CD11cΔMHCII splenocytes. Marker composition of the 2 identified clusters (neutrophils and myeloid precursor-like cells) predominantly populated by CD11cΔMHCII splenocytes. (B) Absolute number of polymorphonuclear neutrophils (PMNs; defined as CD11b+Gr1high) in the spleen at 12 weeks (n = 11, 13), 20 weeks (n = 22, 16), 30 weeks (n = 18, 14), and 1 year (n = 22, 23) of age. The dotted line represents the threshold (2 standard deviations above the mean of WT mice) of neutropenia. Median and individual data points are shown. (C) Cumulative incidence plot for neutrophilia over time in WT and CD11cΔMHCII mice using Kaplan-Meier curve; all mice were censored at the time of analysis. The log-rank test was used for comparison between curves. (D) Absolute number of neutrophil-like precursor cells in the spleen (defined as CD11b+Gr1intLyC6intCD11c−) at 12 weeks (n = 9, 11), 20 weeks (n = 19, 16), 30 weeks (n = 12, 7), and 1 year (n = 22, 23) of age. The dotted line represents the threshold (2 standard deviations above the mean of WT mice) of increased myeloid precursor-like cells. Median and individual data points are shown. (E) Cumulative incidence plot for development of increased myeloid precursor-like cells over time in WT and CD11cΔMHCII mice using Kaplan-Meier curve; all mice were censored at the time of analysis. The log-rank test was used for comparison between curves. Absolute number (F) and percentage (G) of splenic hematopoietic stem cells (HSCs; defined as Lin−[TER119, CD3, NK1.1, CD11b, B220] Sca1+cKit+) in the spleen at 12 weeks (n = 9, 11), 20 weeks (n = 18, 14), 30 weeks (n = 8, 4), and 1 year (n = 20, 17) of age. Median and individual data points are shown.](https://ash.silverchair-cdn.com/ash/content_public/journal/blood/133/4/10.1182_blood-2018-05-850321/3/m_blood850321f2.png?Expires=1769102296&Signature=ywDnbOk7Mf3PCtnU72Ya3btgtLNRCk9tCJ9RWGVr6PZJOWL0A5bPSmZ2CLANZrB9VpLkGdEo6esbmQt4Q8nQvsGzvkf-2Qh-3R9CmmtRxLNXozOg1C~Y~jxviYqkXzNxxI6u05vhhAMlJn9a9gKlAPAqha55uN2MP8ycTFd74BeLik7ZtGbdyfHHAEzIcPiFCPIlDFjpxSCfdqZjNrt7zUUlZE7-ziRdcP29c6kDZBvxjkQucj4etN6MyQygzwNUGGXbix4jpz6xiSPQpras4EfylRIahT8LcNOcQ4OKExTT-mEukcLuUPOSObZpSwoSLxA4VGx8QQpo8pJrR2T9Mw__&Key-Pair-Id=APKAIE5G5CRDK6RD3PGA)
Mixed myeloid composition of myeloproliferative disease in CD11cΔMHCIImice. WT and CD11cΔMHCII mice were assessed by flow cytometry at 12 weeks, 20 weeks, 30 weeks, and 1 year of age. (A) t-SNE projection of splenocytes of 1-year-old mice stained with myeloid markers (CD11b, Gr1, Ly6C, CD11c, and F4/80). Cells are grouped into clusters using FlowSOM, with blue representing WT splenocytes and red representing CD11cΔMHCII splenocytes. Marker composition of the 2 identified clusters (neutrophils and myeloid precursor-like cells) predominantly populated by CD11cΔMHCII splenocytes. (B) Absolute number of polymorphonuclear neutrophils (PMNs; defined as CD11b+Gr1high) in the spleen at 12 weeks (n = 11, 13), 20 weeks (n = 22, 16), 30 weeks (n = 18, 14), and 1 year (n = 22, 23) of age. The dotted line represents the threshold (2 standard deviations above the mean of WT mice) of neutropenia. Median and individual data points are shown. (C) Cumulative incidence plot for neutrophilia over time in WT and CD11cΔMHCII mice using Kaplan-Meier curve; all mice were censored at the time of analysis. The log-rank test was used for comparison between curves. (D) Absolute number of neutrophil-like precursor cells in the spleen (defined as CD11b+Gr1intLyC6intCD11c−) at 12 weeks (n = 9, 11), 20 weeks (n = 19, 16), 30 weeks (n = 12, 7), and 1 year (n = 22, 23) of age. The dotted line represents the threshold (2 standard deviations above the mean of WT mice) of increased myeloid precursor-like cells. Median and individual data points are shown. (E) Cumulative incidence plot for development of increased myeloid precursor-like cells over time in WT and CD11cΔMHCII mice using Kaplan-Meier curve; all mice were censored at the time of analysis. The log-rank test was used for comparison between curves. Absolute number (F) and percentage (G) of splenic hematopoietic stem cells (HSCs; defined as Lin−[TER119, CD3, NK1.1, CD11b, B220] Sca1+cKit+) in the spleen at 12 weeks (n = 9, 11), 20 weeks (n = 18, 14), 30 weeks (n = 8, 4), and 1 year (n = 20, 17) of age. Median and individual data points are shown.
Mixed myeloid composition of myeloproliferative disease in CD11cΔMHCIImice. WT and CD11cΔMHCII mice were assessed by flow cytometry at 12 weeks, 20 weeks, 30 weeks, and 1 year of age. (A) t-SNE projection of splenocytes of 1-year-old mice stained with myeloid markers (CD11b, Gr1, Ly6C, CD11c, and F4/80). Cells are grouped into clusters using FlowSOM, with blue representing WT splenocytes and red representing CD11cΔMHCII splenocytes. Marker composition of the 2 identified clusters (neutrophils and myeloid precursor-like cells) predominantly populated by CD11cΔMHCII splenocytes. (B) Absolute number of polymorphonuclear neutrophils (PMNs; defined as CD11b+Gr1high) in the spleen at 12 weeks (n = 11, 13), 20 weeks (n = 22, 16), 30 weeks (n = 18, 14), and 1 year (n = 22, 23) of age. The dotted line represents the threshold (2 standard deviations above the mean of WT mice) of neutropenia. Median and individual data points are shown. (C) Cumulative incidence plot for neutrophilia over time in WT and CD11cΔMHCII mice using Kaplan-Meier curve; all mice were censored at the time of analysis. The log-rank test was used for comparison between curves. (D) Absolute number of neutrophil-like precursor cells in the spleen (defined as CD11b+Gr1intLyC6intCD11c−) at 12 weeks (n = 9, 11), 20 weeks (n = 19, 16), 30 weeks (n = 12, 7), and 1 year (n = 22, 23) of age. The dotted line represents the threshold (2 standard deviations above the mean of WT mice) of increased myeloid precursor-like cells. Median and individual data points are shown. (E) Cumulative incidence plot for development of increased myeloid precursor-like cells over time in WT and CD11cΔMHCII mice using Kaplan-Meier curve; all mice were censored at the time of analysis. The log-rank test was used for comparison between curves. Absolute number (F) and percentage (G) of splenic hematopoietic stem cells (HSCs; defined as Lin−[TER119, CD3, NK1.1, CD11b, B220] Sca1+cKit+) in the spleen at 12 weeks (n = 9, 11), 20 weeks (n = 18, 14), 30 weeks (n = 8, 4), and 1 year (n = 20, 17) of age. Median and individual data points are shown.
Studies of the relationship between DCs and MPD, including earlier studies11,12 and this study, have relied on CD11c-Cre to drive a DC-dependent phenotype. We investigated the degree to which CD11c-Cre gives faithful Cre expression and found leakage of CD11c-Cre expression in non-DC lineages, including variable penetrance in B cells and macrophages (supplemental Figure 5). No correlation was observed between the degree of penetrance in non-DC lineages and the manifestation of MPD-like phenotypes (supplemental Figure 5). Likewise, because of the potential off-target toxicity of Cre,11,12 we compared the phenotype of CD11c-Cre control mice, without homozygous MHCII flox. These mice did not develop the MPD-like phenotype of CD11cΔMHCII mice (supplemental Figure 6). Thus, the DC-restricted recombination activity of CD11c-Cre accounts for the observed phenotype.
Myeloproliferative disease results from dysregulated communication between DCs and CD4 T cells
The development of MPD in CD11cΔMHCII mice suggested a role for DC–CD4 T cell interactions in restraining neutrophil proliferation. Because MHCII on DCs plays a critical role in CD4+ T cell differentiation in the thymus and CD4+ T cell maintenance and function in the periphery, we profiled the T cell compartment of CD11cΔMHCII mice. The absence of MHCII on CD11c+ cells had little impact on double-negative thymocytes, double-positive thymocytes, or single-positive (SP) CD8+ T cells (Figure 3A). However, consistent with the known role of DCs in negative selection in the thymus,32 the percentage of SP CD4+ T cells was increased in CD11cΔMHCII mice (Figure 3A). Within the SP CD4+ thymocyte compartment, there was a lower percentage of Foxp3+ cells, but given the increase in total SP CD4+ T cells, the total number of Treg cells was unchanged (Figure 3A). These results are consistent with the established role of CD11c+ DCs in the thymus.
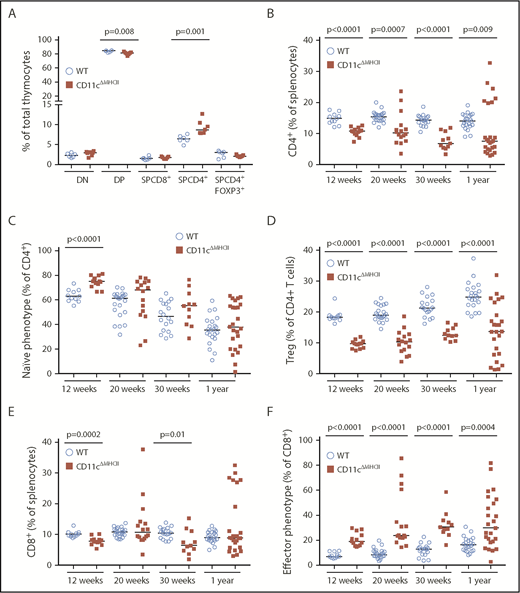
Alterations in the peripheral T cell compartment in CD11cΔMHCIImice. WT and CD11cΔMHCII mice were assessed by flow cytometry for the T cell compartment at 12 weeks (n = 11, 13), 20 weeks (n = 22, 16), 30 weeks (n = 18, 11), and 1 year (n = 22, 25) of age. (A) Percentages of T cell subsets in the thymus at 30 weeks (n = 6, 7). (B) Percentages of total CD4+ T cells among total splenocytes. (C) Percentages of naive CD4+ T cells (CD4+CD62L+CD44−) among CD4+ T splenocytes. (D) Percentages of Treg cells (CD4+Foxp3+) gated on splenic CD4+ T cells. (E) Percentages of CD8+ T cells among total splenocytes. (F) Percentages of effector CD8+ T cells (CD8+CD62L−CD44+) gated on splenic CD8+ T cells. Median and individual data points are shown.
Alterations in the peripheral T cell compartment in CD11cΔMHCIImice. WT and CD11cΔMHCII mice were assessed by flow cytometry for the T cell compartment at 12 weeks (n = 11, 13), 20 weeks (n = 22, 16), 30 weeks (n = 18, 11), and 1 year (n = 22, 25) of age. (A) Percentages of T cell subsets in the thymus at 30 weeks (n = 6, 7). (B) Percentages of total CD4+ T cells among total splenocytes. (C) Percentages of naive CD4+ T cells (CD4+CD62L+CD44−) among CD4+ T splenocytes. (D) Percentages of Treg cells (CD4+Foxp3+) gated on splenic CD4+ T cells. (E) Percentages of CD8+ T cells among total splenocytes. (F) Percentages of effector CD8+ T cells (CD8+CD62L−CD44+) gated on splenic CD8+ T cells. Median and individual data points are shown.
We next investigated the peripheral T cell compartment. Despite the increase in SP CD4+ thymocytes, we observed decreased percentages (Figure 3B) and absolute numbers (supplemental Figure 7) of CD4+ T cells in the periphery of CD11cΔMHCII mice. The composition of the CD4+ T cell compartment was strongly impacted by the lack of MHCII on DCs, with significantly greater percentages of naive CD4+ T cells at 12 weeks of age in CD11cΔMHCII mice (Figure 3C). The activated CD4+ T cell compartment was smaller in CD11cΔMHCII mice, with intact distribution of helper T cell subsets within this smaller compartment, with the exception of a reduction in IL-2 production by CD4+ T cells (supplemental Figure 8). This result is consistent with defective antigen priming: CD4+ T cells in CD11cΔMHCII mice fail to encounter antigen and remain naive. Foxp3+ Treg cells are also agonist expanded through MHCII in the periphery and demonstrated a profound decrease throughout the lifespan of CD11cΔMHCII mice (Figure 3D). Notably, although the increase in naive CD4+ T cells became less pronounced over time, indicating a DC-independent source of CD4+ T cell activation, the same was not observed with Treg cells (Figure 3C-D), indicating a more essential role for MHCII on DCs in Treg cell maintenance than conventional CD4+ T cell activation or a compounding effect from reduced IL-2 production (supplemental Figure 8). Therefore, loss of MHCII on DCs sets up an opposing tension amongst CD4+ T cells, with a limitation on opportunities to encounter cognate antigen, as well as reduced Treg cell numbers contributing to T cell activation. Dysregulation among CD4+ T cells, particularly in Treg subsets, could lead to CD8+ T-cell defects. Although there were only small changes in the total CD8+ T cell population in CD11cΔMHCII mice (Figure 3E), profound activation of CD8+ T cells was observed, with a substantial progressive increase in effector CD8+ cells over time (Figure 3F). This result represents loss of a T cell control mechanism in CD11cΔMHCII mice, providing a potential mechanistic avenue for the observed MPD.
The failure of a T cell checkpoint in CD11cΔMHCII mice provides an alternative to the discarded “empty niche” model for MPD development. To test this hypothesis, we crossed CD11cΔMHCII mice with RagKO mice, which lack T and B cells. Remarkably, none of these mice developed signs of MPD. Although CD11cΔMHCII mice developed splenomegaly, RagKOCD11cΔMHCII mice did not (Figure 4A). To control for the small spleens normally observed in RagKO mice, we also determined the spleen weight/total body weight ratio and again found no difference between RagKOCD11cΔMHCII mice and WT or RagKO mice (Figure 4B). Likewise, we measured the absolute number of splenic neutrophils (Figure 4C) and myeloid precursors (Figure 4D) and found no increase in RagKOCD11cΔMHCII mice compared with controls, unlike CD11cΔMHCII mice. Furthermore, although CD11cΔMHCII mice developed a granulocytic expansion in the bone marrow (Figure 4E), this phenotype was not observed in RagKOCD11cΔMHCII mice. Therefore, lymphocytes are necessary for the development of MPD in settings of DC deficiency.
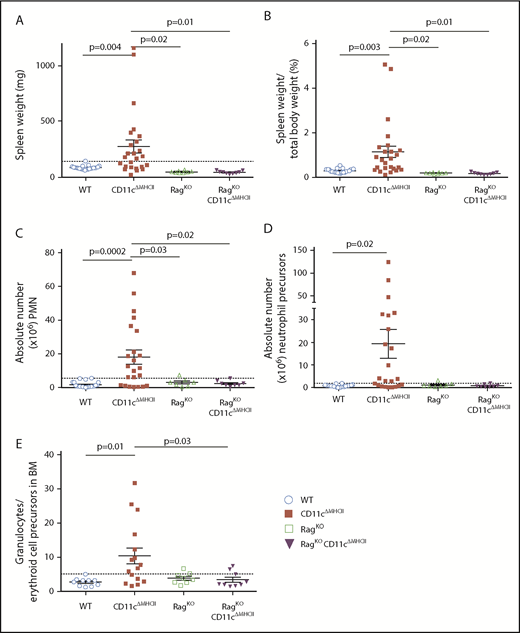
Rag deficiency prevents MPD.RagKO and RagKO/CD11cΔMHCII mice were assessed by flow cytometry at 1 year of age. WT and CD11cΔMHCII mice are shown for comparative purposes. (A) Spleen weight (n = 23, 25, 8, 9). Dashed line indicates the threshold for splenomegaly (2 standard deviations above the mean of WT mice from all age groups). (B) Spleen weight/total weight ratio (n = 22, 25, 8, 9). (C) Absolute number of peripheral mononuclear neutrophils (CD11bhighGr1+) among total splenocytes. (n = 22, 23, 7, 8). Dashed line indicates the threshold for neutrophilia (2 standard deviations above the mean of WT mice from all age groups). (D) Absolute number of neutrophil precursor-like cells among total splenocytes (n = 22, 23, 7, 8). Dashed line indicates threshold for higher neutrophil precursors (2 standard deviations above the mean of WT mice from all age groups). (E) Ratio of granulocytes to erythroid cell precursors in the bone marrow (BM) (n = 10, 17, 8, 9). Dashed line indicates threshold for higher ratio (2 standard deviations above the mean of WT mice from all age groups). Mean ± standard error of the mean and individual data points are shown.
Rag deficiency prevents MPD.RagKO and RagKO/CD11cΔMHCII mice were assessed by flow cytometry at 1 year of age. WT and CD11cΔMHCII mice are shown for comparative purposes. (A) Spleen weight (n = 23, 25, 8, 9). Dashed line indicates the threshold for splenomegaly (2 standard deviations above the mean of WT mice from all age groups). (B) Spleen weight/total weight ratio (n = 22, 25, 8, 9). (C) Absolute number of peripheral mononuclear neutrophils (CD11bhighGr1+) among total splenocytes. (n = 22, 23, 7, 8). Dashed line indicates the threshold for neutrophilia (2 standard deviations above the mean of WT mice from all age groups). (D) Absolute number of neutrophil precursor-like cells among total splenocytes (n = 22, 23, 7, 8). Dashed line indicates threshold for higher neutrophil precursors (2 standard deviations above the mean of WT mice from all age groups). (E) Ratio of granulocytes to erythroid cell precursors in the bone marrow (BM) (n = 10, 17, 8, 9). Dashed line indicates threshold for higher ratio (2 standard deviations above the mean of WT mice from all age groups). Mean ± standard error of the mean and individual data points are shown.
Having established an unexpected role for the adaptive immune system in driving MPD in CD11cΔMHCII mice, we next sought to clarify which cell subset was responsible for this phenomenon. The observed increase in effector CD8+ T cells in CD11cΔMHCII mice raised the possibility of a mechanistic pathway through which reduced Treg cell expansion allowed increased CD8+ T cell activation, driving the MPD. To investigate this possibility, we crossed CD11cΔMHCII mice with a β2 microglobulin–knockout strain, which lacks CD8+ T cells, creating β2mKOCD11cΔMHCII mice. Contrary to our hypothesis that CD8+ T cells were the downstream cause of MPD in CD11cΔMHCII mice, β2mKOCD11cΔMHCII mice developed myeloproliferation, resembling the disease in CD11cΔMHCII mice. We observed a similar degree of splenomegaly in β2mKOCD11cΔMHCII mice and CD11cΔMHCII mice (Figure 5A), as well as similar percentages (Figure 5B) and absolute numbers (Figure 5C) of splenic neutrophils. Moreover, an expansion of neutrophil precursors was identified in the spleen (Figure 5D). Because CD8 deficiency in CD11cΔMHCII mice (ie, β2mKOCD11cΔMHCII mice) does not abolish disease, MPD is independent of CD8+ T cells.
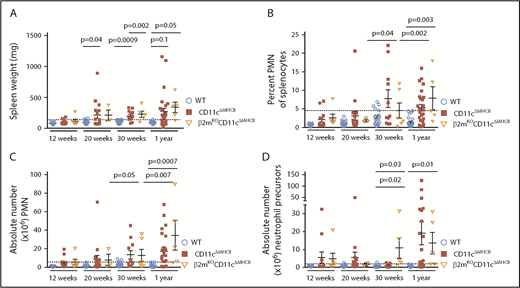
MPD is independent of CD8 T cell activation. β2mKOCD11cΔMHCII mice were assessed by flow cytometry. WT and CD11cΔMHCII mice are shown for comparative purposes. (A) Spleen weight and (B) percentage of peripheral mononuclear neutrophils (PMN) (CD11bhigh Gr1+) among total splenocytes at 12 weeks (n = 11, 13, 6), 20 weeks (n = 22, 16, 3), 30 weeks (n = 22, 16, 5), and 1 year (n = 23, 25, 5) of age. (C) Absolute number of PMN among total splenocytes at 12 weeks (n = 11, 13, 6), 20 weeks (n = 22, 16, 3), 30 weeks (n = 18, 14, 5), and 1 year (n = 22, 23, 5) of age. (D) Absolute number of myeloid precursor-like cells among total splenocytes at 12 weeks (n = 11, 13, 6), 20 weeks (n = 22, 16, 2), 30 weeks (n = 12, 7, 5), and 1 year (n = 22, 23, 5) of age. Mean ± standard error of the mean and individual data points are shown.
MPD is independent of CD8 T cell activation. β2mKOCD11cΔMHCII mice were assessed by flow cytometry. WT and CD11cΔMHCII mice are shown for comparative purposes. (A) Spleen weight and (B) percentage of peripheral mononuclear neutrophils (PMN) (CD11bhigh Gr1+) among total splenocytes at 12 weeks (n = 11, 13, 6), 20 weeks (n = 22, 16, 3), 30 weeks (n = 22, 16, 5), and 1 year (n = 23, 25, 5) of age. (C) Absolute number of PMN among total splenocytes at 12 weeks (n = 11, 13, 6), 20 weeks (n = 22, 16, 3), 30 weeks (n = 18, 14, 5), and 1 year (n = 22, 23, 5) of age. (D) Absolute number of myeloid precursor-like cells among total splenocytes at 12 weeks (n = 11, 13, 6), 20 weeks (n = 22, 16, 2), 30 weeks (n = 12, 7, 5), and 1 year (n = 22, 23, 5) of age. Mean ± standard error of the mean and individual data points are shown.
The demonstrated lymphocyte dependency of MPD-like symptoms in CD11cΔMHCII mice implicates CD4+ T cells as a necessary cofactor in disease development. Although CD11cΔMHCII mice lack MHCII on DCs, MHCIIKO mice lack MHCII globally. Therefore, MHCIIKO mice have a deficiency in MHCII on DCs and a lack of CD4+ T cells, owing to the requirement of MHCII on thymic epithelial cells during differentiation. Analysis of MHCIIKO mice demonstrates that they fail to manifest any of the identified MPD-like phenotypes, with no increase in spleen weight (Figure 6A), no increase in splenic neutrophils (Figure 6B-C), and no increase in splenic neutrophil precursors (Figure 6D). These results suggested that MPD could be generated through an activatory signal originating from CD4+ T cells, which is normally suppressed by antigen exposure from DCs (ie, a signal derived from naive CD4+ T cells). Because MPD in the context of DC numerical deficiency has been attributed to excess Flt3L,11 we measured the expression of Flt3L by naive and activated CD4+ T cells in WT and CD11cΔMHCII mice. Naive CD4+ T cells from both strains exhibit higher levels of Flt3L expression than do antigen-experienced CD4+ T cells (Figure 6E). Together, these data represent a potential molecular model linking MPD to DC–CD4+ T cell interaction, and MHCII–T cell receptor interaction is required to quench excessive production of Flt3L by CD4+ T cells.
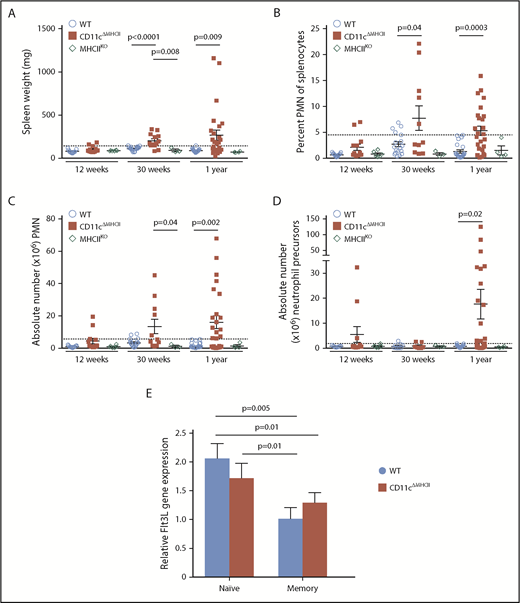
MPD development relies on the presence of CD4 T cells. (A-D) MHCIIKO mice were assessed by flow cytometry. WT and CD11cΔMHCII mice are shown for comparative purposes. (A) Spleen weight and (B) percentage of peripheral mononuclear neutrophils (PMN) (CD11bhighGr1+) among total splenocytes at 12 weeks (n = 11, 13, 6), 30 weeks (n = 22, 16, 3), and 1 year (n = 23, 25, 4) of age. (C) Absolute number of PMN among total splenocytes at 12 weeks (n = 11, 13, 6), 30 weeks (n = 18, 11, 3), and 1 year (n = 22, 23, 4) of age. (D) Absolute number of myeloid precursor-like cells among total splenocytes at 12 weeks (n = 9, 11, 6), 30 weeks (n = 12, 7, 3), and 1 year (n = 22, 23, 4) of age. Mean ± standard error of the mean and individual data points are shown. (E) Naive (CD25−CD62L+CD44−) and memory (CD25−CD44+) CD4 cells from 6 mice were sorted, and qPCR for Flt3L was performed. Mean ± standard error of the mean are shown. The P values were determined using an unpaired t test.
MPD development relies on the presence of CD4 T cells. (A-D) MHCIIKO mice were assessed by flow cytometry. WT and CD11cΔMHCII mice are shown for comparative purposes. (A) Spleen weight and (B) percentage of peripheral mononuclear neutrophils (PMN) (CD11bhighGr1+) among total splenocytes at 12 weeks (n = 11, 13, 6), 30 weeks (n = 22, 16, 3), and 1 year (n = 23, 25, 4) of age. (C) Absolute number of PMN among total splenocytes at 12 weeks (n = 11, 13, 6), 30 weeks (n = 18, 11, 3), and 1 year (n = 22, 23, 4) of age. (D) Absolute number of myeloid precursor-like cells among total splenocytes at 12 weeks (n = 9, 11, 6), 30 weeks (n = 12, 7, 3), and 1 year (n = 22, 23, 4) of age. Mean ± standard error of the mean and individual data points are shown. (E) Naive (CD25−CD62L+CD44−) and memory (CD25−CD44+) CD4 cells from 6 mice were sorted, and qPCR for Flt3L was performed. Mean ± standard error of the mean are shown. The P values were determined using an unpaired t test.
Discussion
MPD is an unexpected clinical manifestation associated with DC deficiency in mice8,11,13-16 and humans.7,18,19 Although a direct link between the DC deficiency and the MPD manifestations is generally accepted, it should be noted that the mouse models and human diseases have immunological disturbances beyond that of DCs. In the case of the mouse models, the original systems relied on transgenes driven by the CD11c promoter.11,12 Although often considered “DC specific,” the CD11c promoter is also active in subsets of B cells and macrophages (as observed here). Follow-up studies used alternative promoters, including Tak115 and Zbtb46,16 which each have their own limitations. Thus, caution is warranted when concluding a singular role for DCs in any of these models. However, existing evidence strongly implicates DCs as the responsible cell type. In addition to the multiple concordant models showing parallel phenotypes, the reported MPD is not readily explained by off-target effects in other cell types. To our knowledge, no similar phenotypes have been reported with macrophage depletion using liposomal clodronate, CD11b-DTR, or lysM–Cre–DTR, nor has MPD been reported in any of the numerous B cell–depletion or knockout studies. Likewise, in humans, although patients with IRF8 and GATA2 mutations have a deficiency in DCs, the mutations also have pleiotropic effects throughout the immune system, including in the B cell and macrophage compartments. Because DCs are the unifying population altered across these various models and patients, the parsimonious model is to consider MPD to be driven by deficiency in the DC subset, with a formal acknowledgment that the key population is, rather, GATA2-dependent IRF8-dependent CD11c+ antigen-presenting cells.
Given the main physiological role of DCs as professional antigen-presenting cells to T cells, a direct biological link between DC deficiency and MPD was not obvious. Instead, the main model to explain this phenomenon focused on a putative developmental feedback loop in which DC deficiency is sensed, leads to feedback into the hematopoietic stem cell niche, and amplifies differentiation into myeloid precursor cells.11 A key candidate for this sensing was Flt3L, which is elevated in the serum of CD11c-DTA11 and TAK1-deficient mice,15 potentially because DCs represent a “ligand sink” due to expression of high levels of Flt3.33 In this model, the loss of DCs would drive MPD directly, such as the proposal that excess Flt3L drives proliferation of the myeloid precursor cells,11 or via upstream effects, with stem cells responding to the deficiency and being driven into the myeloid precursor lineage but arresting prior to becoming mature DCs due to genetic blockade. However, in both cases, the linchpin of the model was the numerical deficiency in DCs.
In the current study, we challenged these existing models of MPD in DC deficiency by generating a mouse model in which DCs were numerically normal but functionally impaired due to a lack of MHCII. Under the standard developmental feedback models, such a system should allow the autoimmune manifestations of DC deficiency12 but would not manifest in MPD. Instead, we observed extramedullary hematopoiesis and significant myeloid-lineage proliferation, with neutrophilia and myeloid precursors driving splenomegaly. These data demonstrate that numerical DC deficiency or a loss of DC-dependent functions is capable of driving MPD, with parsimony suggesting the latter effect as a disease driver in both cases. With the only functional impairment induced being a lack of antigen presentation via MHCII, these data demonstrate that the collaboration between DCs and CD4+ T cells is at the heart of myeloproliferative control. The combination of phenotypic correction with additional Rag deficiency and disease progression with β2 microglobulin deficiency suggests that CD4+ T cells need to be present to drive disease. This is further supported by the suppression of MPD manifestations in MHCII-deficient mice, which recapitulate the functional deficiency of CD11cΔMHCII mice (ie, DCs are MHCII deficient), but additionally have an almost complete absence of peripheral CD4+ T cells due to developmental blockade in the thymus. A viable model to explain these data requires the presence of an activating signal originating from a subset of CD4+ T cells and a suppressive signal originating from DCs that quenches this activating signal. The simplest model integrating these key features that is compatible with the phenotyping data above is one in which naive CD4+ T cells express the activating signal until antigen encounter via MHCII. The effect may also be mediated, in part, by loss of an inhibitory signal conferred by CD4+ T cells, such as the deficit in Treg cells; however, an activating signal needs to be part of the model, otherwise other mouse strains with CD4+ T cell deficiency would exhibit MPD in the presence of normal DC number and function. Although it is perplexing that an activating signal comes from a compartment characterized here as predominantly naive, it should be noted that some stimulatory ligands are expressed at higher levels by naive CD4+ T cells and go down with antigen experience. Here, we demonstrate that Flt3L is 1 such signal. Although a previous study34 reported no difference in Flt3L production between naive and memory CD4+ T cells, our study and the publically available database ImmGen support a 2-fold increase in expression in naive CD4+ T cells. Indeed, naive CD4+ T cells are the largest hematopoietic source for Flt3L in mice and humans (https://www.immgen.org). With the Flt3–Flt3L axis being key to myeloid proliferation, this model potentially unifies the cellular and molecular mechanisms linking DC deficiency to MPD.
The identification of DC–CD4+ T cell communication defects as a driver for MPD brings up the potential intersection of MPD and autoimmunity. Antigen presentation by DCs is important for the negative selection of autoreactive T cells,2-4 although the degree has been debated given the overlapping functionality of medullary thymic epithelial cells.35-37 Thus, defects in tolerance processes brought about by DC deficiency could be reasonably expected to drive T cell–dependent autoimmunity, although this would also be countered by the opposing loss of T cell priming by DCs. One of the initial reports of murine DC deficiency observed severe autoimmune pathology,12 which could, in principle, have driven secondary MPD. Conversely, our study and other published models11 found no sign of autoimmune disease or any overt CD4+ T cell activation. A reconciliation of these findings may be found in the identification of a key role for the microbiota in the inflammatory aspects of disease.38 Thus, the presence or absence of autoimmunity across the different studies could potentially be explained by differences in colony microflora. Notably, although the study that focused on microbiome-driven inflammation took a similar functional-deficiency approach as our study, the confounding inflammation and the limit of monitoring to 14 weeks in most experiments precluded the conclusions made here. Although we do not exclude a potential amplification of MPD by autoimmune or inflammatory processes, these processes are not necessary for MPD. Instead, the MPD driven by DC deficiency represents a novel DC–CD4+ T cell communication failure, independent of the tolerance defects described.
The model of MPD developed here has implications for human disease. The link between DC deficiency and MPD is not limited to mouse models; patients with GATA2 and IRF8 mutations also manifest DC deficiency and myeloproliferative and myelodysplastic disorders.7,17-19 Under the “open niche” model originally proposed to explain this link, treatment of MPD requires filling the empty DC niche, which can only be performed through bone marrow transplantation. If our 2-step model is correct, with naive CD4+ T cells providing an activatory signal and DCs providing a quencher, a second potential intervention point opens up: the naive CD4+ T cell. If this model is validated in patients, then therapeutic intervention that reduces the production of the activatory signal (likely, Flt3L) from naive CD4+ T cells would reduce the development of MPDs.
The online version of this article contains a data supplement.
The publication costs of this article were defrayed in part by page charge payment. Therefore, and solely to indicate this fact, this article is hereby marked “advertisement” in accordance with 18 USC section 1734.
Acknowledgments
This work was supported by the Fonds voor Wetenschappelijk Onderzoek (FWO) and the Vlaams Instituut voor Biotechnologie Grand Challenges program. S.H.-B. is an FWO fellow. J.S.B. is a fellow of the Belgian-American Educational Foundation.
Authorship
Contribution: S.H.-B., J.S.B., and A. Lenaerts performed experiments; S.H.-B., J.S.B., and C.R. analyzed data; P.A.K. contributed vital reagents; S.H.-B. and A. Liston designed the study; and S.H.-B., J.S.B., and A. Liston wrote the manuscript.
Conflict-of-interest disclosure: The authors declare no competing financial interests.
Correspondence: Adrian Liston, Vlaams Instituut voor Biotechnologie Center for Brain and Disease Research, O&N 2 bus 1026, Herestraat 49, 3000 Leuven, Belgium; e-mail: adrian.liston@vib.be.

This feature is available to Subscribers Only
Sign In or Create an Account Close Modal