

Key Points
CCND1 binds to and reduces recruitment of HDAC1 and HDAC2 to the SOX11 promoter, causing increased histone acetylation and SOX11 transcription.
STAT3 represses SOX11 transcription by interacting directly with the SOX11 gene promoter and enhancer.

Abstract
The neural transcription factor SOX11 is usually highly expressed in typical mantle cell lymphoma (MCL), but it is absent in the more indolent form of MCL. Despite being an important diagnostic marker for this hard-to-treat malignancy, the mechanisms of aberrant SOX11 expression are largely unknown. Herein, we describe 2 modes of SOX11 regulation by the cell-cycle regulator cyclin D1 (CCND1) and the signal transducer and activator of transcription 3 (STAT3). We found that ectopic expression of CCND1 in multiple human MCL cell lines resulted in increased SOX11 transcription, which correlated with increased acetylated histones H3K9 and H3K14 (H3K9/14Ac). Increased H3K9/14Ac and SOX11 expression was also observed after histone deacetylase 1 (HDAC1) or HDAC2 was depleted by RNA interference or inhibited by the HDAC inhibitor vorinostat. Mechanistically, we showed that CCND1 interacted with and sequestered HDAC1 and HDAC2 from the SOX11 locus, leading to SOX11 upregulation. Interestingly, our data revealed a potential inverse relationship between phosphorylated Y705 STAT3 and SOX11 expression in MCL cell lines, primary tumors, and patient-derived xenografts. Functionally, inactivation of STAT3 by inhibiting the upstream Janus kinase (JAK) 1 or JAK2 or by STAT3 knockdown was found to increase SOX11 expression, whereas interleukin-21 (IL-21)–induced STAT3 activation or overexpression of the constitutively active form of STAT3 decreased SOX11 expression. In addition, targeting SOX11 directly by RNA interference or indirectly by IL-21 treatment induced toxicity in SOX11+ MCL cells. Collectively, we demonstrate the involvement of CCND1 and STAT3 in the regulation of SOX11 expression, providing new insights and therapeutic implications in MCL.
Introduction
The high-mobility group neural transcription factor SOX11 is predominantly expressed in the developing brain and has critical roles in neurogenesis and embryonic development.1-4 Although SOX11 is not expressed in normal B cells and does not seem to play a role in lymphopoiesis, its aberrant expression has been found in several lymphoproliferative diseases, including mantle cell lymphoma (MCL),5-7 Burkitt lymphoma,8 and B- and T-cell lymphoblastic leukemias.7,8 SOX11 is also overexpressed in several types of solid tumors, including ovarian carcinoma,9,10 basal-like breast carcinoma,11,12 glioma,13 medulloblastoma,14 and prostate cancer.15 In MCL, SOX11 is highly expressed in most classical cases with nodal presentation but is notably absent in indolent leukemic cases that display an IGVH-mutated phenotype.16
The role of SOX11 in MCL is incompletely understood. Previous studies have identified several direct targets of SOX11 in MCL, including DBN1, SETMAR, HIG2, and WNT signaling.17,18 Subsequent studies have revealed that SOX11 is essential for MCL xenograft growth in vivo and directly mediates transcription of the B-cell transcription factor PAX5 and thus is thought to promote lymphomagenesis through deregulated B-cell differentiation.19 SOX11 also mediates the expression of platelet-derived growth factor α,20 C-X-C motif chemokine receptor 4, and focal adhesion kinase,21 which promote angiogenesis, tumor-cell migration, and metastasis, respectively. Despite conflicting results regarding its prognostic value,6,16,22 SOX11 is an established diagnostic marker for MCL.7 In breast cancer, SOX11 is essential for proliferation and expression of a gene signature characteristic of aggressive basal-like breast cancer.12
Given the important biology of SOX11, several studies have investigated the mechanism of aberrant SOX11 expression. Gustavsson et al23 demonstrated that although SOX11 is important in developing neurons, its expression is virtually absent in other tissues because of promoter hypermethylation. Studies by Vegliante et al24 showed that SOX11 expression in embryonic stem cells and some B-cell lymphomas was associated with unmethylated DNA and active histones H3K9/14Ac and H3K4me3. SOX11 can be induced in MCL and breast cancer cell lines after treatment with the histone deacetylase (HDAC) inhibitor vorinostat (also known as SAHA) or trichostatin A, suggesting that HDACs might participate in the regulation of SOX11 expression.24,25 More recently, an elegant integrative analysis of the epigenome in primary MCL uncovered a distant regulatory element 675 kb downstream from the SOX11 gene that seems to influence transcriptional activity at the SOX11 promoter.26 Using the circularized chromosome conformation capture sequencing method to detect long-range chromatin interactions, Queirós et al26 demonstrated that this distant enhancer has 3-dimensional contact with the SOX11 gene promoter, but how it affects SOX11 expression remains to be determined.
In this study, we investigated 2 potential mechanisms of SOX11 expression. By ectopically expressing CCND1 in human MCL cell lines, we demonstrate that CCND1 mediates SOX11 expression through interaction with HDAC1 and HDAC2 at the SOX11 locus. In addition, using genetic and pharmacological inhibition, we show that the signal transducer and activator of transcription 3 (STAT3) binds to the SOX11 promoter and enhancer, and functions as a transcriptional repressor. These findings demonstrate 2 distinct modes of SOX11 regulation and may have implications for the treatment of MCL.
Materials and methods
Cell lines and culture conditions
Human MCL lines Z-138, JEKO-1, UPN-1, and SP-53 were kindly provided by Louis Staudt. GRANTA-519, JVM-2, MINO, and MAVER-1 cells were obtained from the American Type Culture Collection (Manassas, VA). MCL lines Z-138, JEKO-1, GRANTA-519, and UPN-1 were authenticated by short tandem repeat DNA profiling (American Type Culture Collection; supplemental Table 1, available on the Blood Web site). Other cell lines were not authenticated. Cells were cultured in RPMI 1640 medium, except GRANTA-519, which was cultured in Dulbecco’s modified Eagle medium (Life Technologies, Grand Island, NY), supplemented with 10% fetal bovine serum, 100 IU/mL of penicillin, and 100 μg/mL of streptomycin, in a humidified incubator at 37°C with 5% carbon dioxide.
Primary MCL samples and PDXs
Primary cells were obtained from the tumor bank of the Pathology Department of City of Hope as deidentified samples after approval by the institutional review board and prepared as previously described.27 Briefly, frozen cells were thawed in a 37°C water bath, washed in RPMI 1640 medium, and cultured in RPMI 1640 medium supplemented with 20% fetal bovine serum and 200 Kunits/mL of DNAse I (Sigma, St. Louis, MO) for 15 minutes in a 37°C carbon dioxide incubator followed by washing. Cells were recovered overnight in a carbon dioxide incubator before experiments. MCL patient–derived xenografts (PDXs) were obtained from the public repository of xenografts (ProXe28 ; supplemental Table 2). Samples were transplanted into sublethally irradiated NOD.Cg-PrkdcscidIl2rgtm1Wjl/SzJ mice (The Jackson Laboratory, Bar Harbor, ME) through tail vein injection. Lymphoma xenografts were frozen in aliquots and subsequently thawed and cultured in RPMI 1640 medium supplemented with 20% fetal bovine serum, 100 IU/mL of penicillin, and 100 μg/mL of streptomycin in a humidified incubator at 37°C with 5% carbon dioxide.
cDNA expression vectors
The retroviral expression vector pBMN-CCND1-HA-IRES-Hygro, encoding carboxy-terminus hemaglutinin (HA)–tagged wild-type (WT) or mutant CCND1, was previously constructed.27 HDAC-HA constructs were a kind gift from Yue Xiong (University of North Carolina, Chapel Hill), as previously described.29 FLAG-tagged SOX11 expression vector was constructed by cloning the polymerase chain reaction (PCR)–generated SOX11 products from a Z-138–derived complementary DNA (cDNA) template into the pBMN-IRES-Hygro vector (a gift from Gary Nolan) at BamHI and XhoI restriction sites. FLAG-SOX11 PCR products were generated using the following primer pairs: 5′TAGTAGGGATCCGCCGCCACCATGGACTACAAAGACGATGACGACAAGGTGCAGCAGGCGGAGAGCTTG and 5′CTACTACTCGAGTCAATATGTGAACACCAGGTCGGAGAA. The final SOX11 construct was confirmed by DNA sequencing. The lentiviral STAT3 constitutive active construct EF.STAT3C.Ubc.GFP was a gift from Linzhao Cheng (Addgene plasmid #24983), and its retroviral subclone was a gift from Lixin Rui.
RNA interference reagents
CCND1 and HDAC1 short hairpin RNA (shRNA) constructs and sequences were obtained from a previously generated shRNA library.30 STAT3 shRNA (#840) pKLO construct was kindly provided by Anna Scuto as previously reported.31 SOX11 shRNA (#454) and HDAC2 shRNA (#1678) pKLO constructs were obtained from Sigma (Sigma, St. Louis, MO). RNAi sequences are listed in supplemental Table 3. A DNA insert encoding a fusion puromycin N-acetyl-transferase–green fluorescence protein was cloned into the SOX11 shRNA pKLO vector at the BamHI and KpnI restriction sites to produce a green fluorescence protein–coexpressing vector.
Quantitative real-time PCR
Quantitative real-time PCR (qPCR) reactions were performed using RT2 SYBR Green qPCR Master Mix (Qiagen, Valencia, CA) or Taqman Universal PCR Master Mix (Thermo Fisher Scientific, Waltham, MA) and analyzed by the StepOnePlus Real-Time PCR System (Life Technologies, Grand Island, NY). Because SOX11 is encoded by an intronless gene, in addition to DNAse treatment before cDNA synthesis, a poly-A–specific primer for SOX1132 was used to minimize amplification of potential genomic DNA (gDNA) contamination. As a negative control, mock cDNA synthesis without addition of reverse transcriptase was also prepared to verify the presence of contaminating gDNA. We demonstrated that the cycle threshold (Ct) values for the poly-A–specific SOX11 primer in reverse transcription (RT)–positive cDNA samples were consistently >10 cycles fewer than those in mock cDNA samples (Ct, 24 vs 39; supplemental Table 4). Additional primers that can amplify SOX11 or glyceraldehyde-3-phosphate dehydrogenase (GAPDH) from gDNA also yielded similarly large differences in Ct values between RT+ and mock cDNA samples (Ct, 25 vs 36 and 23 vs 39, respectively; supplemental Table 4). These results confirm the validity of our messenger RNA (mRNA) assessment using either SOX11 primer. Primer sequences for SOX11 and GAPDH are shown in supplemental Table 5. Taqman probes for SOX11 (Hs00848583_s1), STAT3 (Hs00374280_m1), HDAC1 (Hs02621185_s1), and GAPDH (Hs02786624_g1) were purchased from Thermo Fisher. Relative mRNA expression was normalized to GAPDH signals and calculated using the ΔΔCt method.
Immunoblot and immunoprecipitation analyses
Cells were lysed in the presence of protease inhibitor cocktail (Sigma, St. Louis, MO) and Halt phosphatase inhibitor cocktail (Pierce Biotechnology, Rockford, IL) for 30 minutes. Lysates were cleared by centrifugation, and protein concentrations were determined by BCA protein assay (Pierce Biotechnology, Rockford, IL). Twenty micrograms of lysates per lane were separated by 4% to 15% sodium dodecyl sulfate polyacrylamide gel electrophoresis and immobilized on the nitrocellulose membranes (ThermoFisher, Waltham, MA) for immunoblotting. Immunoblot signals were developed by a chemiluminescent detection method (Pierce Biotechnology, Rockford, IL) and captured by standard autoradiographic films. Immunoprecipitation details are provided in supplemental Methods.
Chromatin immunoprecipitation
Chromatin immunoprecipitation was performed using the ChIP Assay Kit (Millipore, Temecula, CA) according to manufacturer’s instructions. Details are described in supplemental Methods.
Statistical analyses
A 2-tailed Student t test or linear regression analysis was performed for comparison between 2 groups using Prism (version 6.0b; GraphPad Software, La Jolla, CA). P values <.05 were considered statistically significant.
Additional detailed method descriptions are available in supplemental Materials.
Results
CCND1 upregulates SOX11 expression in human MCL cell lines
To determine whether CCND1 induces SOX11, HA-tagged CCND1 was ectopically expressed in the human MCL lines Z-138, JEKO-1, and GRANTA-519. The recurrent mutation CCND1 Y44D, which affects phosphorylation-dependent proteolysis and results in increased protein levels,27 was also expressed in Z-138 and JEKO-1 cells. Compared with empty vector controls, both WT and mutant CCND1 increased protein expression levels of SOX11 in these cell lines by immunoblot analysis (Figure 1A; supplemental Figure 1A). To ensure the specificity of the SOX11 antibody used in the current study, depletion or overexpression of SOX11 was carried out in MCL cell lines, and specific loss or increase in SOX11 expression was confirmed by immunoblot analysis (supplemental Figure 2A-B). We next used RT-PCR assays to determine whether CCND1 mediated SOX11 transcription. Because SOX11 is encoded by an intronless gene, we used an mRNA-specific RT-PCR assay (see “Materials and methods”) and demonstrated that overexpression of WT or mutant CCND1 increased SOX11 mRNA levels in these cell lines (Figure 1B; supplemental Figure 1B).
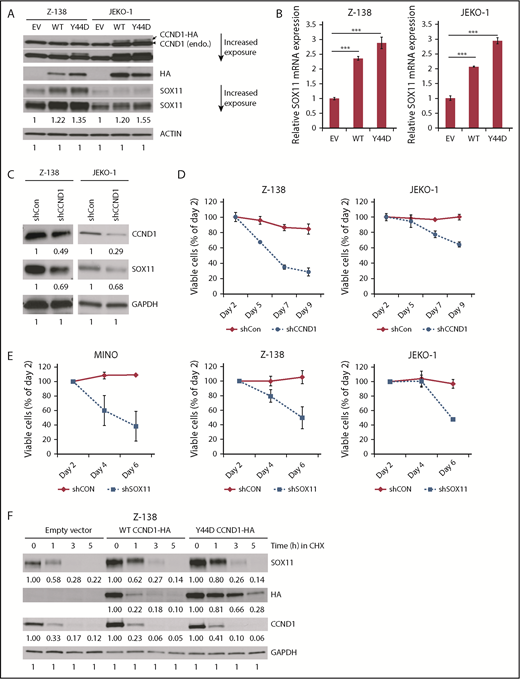
CCND1 upregulates SOX11 expression. (A) Immunoblot analysis of Z-138 and JEKO-1 cells stably transduced with empty vector (EV), WT, or Y44D mutant CCND1-HA constructs. Cell lysates (30 μg per lane) were separated by sodium dodecyl sulfate polyacrylamide gel electrophoresis gel and immunoblotted with indicated antibodies. Arrow indicates a mobility shift of the CCND1-HA protein. Arrowhead indicates endogenous CCND1. (B) qPCR analysis of SOX11 mRNA expression. Cell lines generated as described in panel A, and mRNAs were harvested for SOX11 qPCR. Shown are the means of mRNA expression levels after normalization to GAPDH signals from 4 independent amplification experiments. Error bars, standard deviation (supplemental Figure 1A-B). (C) CCND1 is required for SOX11 expression. Z-138 and JEKO-1 cells were stably transduced with control or CCND1 shRNA, and protein expression was analyzed by immunoblotting with indicated antibodies 2 days after transduction. (D) Effect of CCND1 knockdown on cell survival. Z-138 and JEKO-1 cells were stably transduced with control or CCND1 shRNA, and propidium iodide (PI)–negative (viable) cells were assessed by flow cytometry over time. Shown are the means of PI− fractions compared with day-2 samples from at least 2 independent experiments. (E) Effect of SOX11 knockdown on MCL survival. Indicated MCL cell lines were transduced with control or SOX11 shRNA lentiviral vector that coexpresses GFP. Shown are the means of GFP+ fractions compared with day 2 from 2 independent experiments. (F) Z-138 cells expressing EV, WT, or Y44D CCND1-HA were treated with 10 μM of cyclohexamide (CHX) for indicated times, and cell lysates were prepared for immunoblot analysis with indicated antibodies. Numbers below immunoblots are relative densitometric values of corresponding bands after normalization to ACTIN or GAPDH and respective control signals. ***P < .001 by 2-sided Student t test.
CCND1 upregulates SOX11 expression. (A) Immunoblot analysis of Z-138 and JEKO-1 cells stably transduced with empty vector (EV), WT, or Y44D mutant CCND1-HA constructs. Cell lysates (30 μg per lane) were separated by sodium dodecyl sulfate polyacrylamide gel electrophoresis gel and immunoblotted with indicated antibodies. Arrow indicates a mobility shift of the CCND1-HA protein. Arrowhead indicates endogenous CCND1. (B) qPCR analysis of SOX11 mRNA expression. Cell lines generated as described in panel A, and mRNAs were harvested for SOX11 qPCR. Shown are the means of mRNA expression levels after normalization to GAPDH signals from 4 independent amplification experiments. Error bars, standard deviation (supplemental Figure 1A-B). (C) CCND1 is required for SOX11 expression. Z-138 and JEKO-1 cells were stably transduced with control or CCND1 shRNA, and protein expression was analyzed by immunoblotting with indicated antibodies 2 days after transduction. (D) Effect of CCND1 knockdown on cell survival. Z-138 and JEKO-1 cells were stably transduced with control or CCND1 shRNA, and propidium iodide (PI)–negative (viable) cells were assessed by flow cytometry over time. Shown are the means of PI− fractions compared with day-2 samples from at least 2 independent experiments. (E) Effect of SOX11 knockdown on MCL survival. Indicated MCL cell lines were transduced with control or SOX11 shRNA lentiviral vector that coexpresses GFP. Shown are the means of GFP+ fractions compared with day 2 from 2 independent experiments. (F) Z-138 cells expressing EV, WT, or Y44D CCND1-HA were treated with 10 μM of cyclohexamide (CHX) for indicated times, and cell lysates were prepared for immunoblot analysis with indicated antibodies. Numbers below immunoblots are relative densitometric values of corresponding bands after normalization to ACTIN or GAPDH and respective control signals. ***P < .001 by 2-sided Student t test.
To determine whether CCND1 is required for SOX11 expression, we depleted CCND1 in MCL cells using an shRNA validated in a previous study.33 CCND1 depletion in both Z-138 and JEKO-1 cells resulted in reduced SOX11 protein levels (Figure 1C), in addition to decreased cell viability (Figure 1D) similar to that previously observed in JEKO-1 cells.33 Depletion of SOX11 also resulted in reduced cell viability in Z-138, JEKO-1, and an additional MCL line, MINO (Figure 1E). We next determined whether SOX11 upregulation was due to altered protein stability by treating CCND1-HA–expressing Z-138 cells with CHX and assessing SOX11 protein turnover by immunoblot analysis. In this experiment, WT and mutant CCND1 samples consistently expressed more SOX11 than empty vector controls before CHX treatment (Figure 1F). However, the rate of SOX11 protein turnover in WT and mutant CCND1 samples was comparable to that of controls after 3 hours in CHX (Figure 1F). This result excluded increased protein stability as a mechanism of increased SOX11 expression. Together, these data suggest a role for CCND1 in the regulation of SOX11 expression in MCL cell lines.
CCND1 affects histone modification at the SOX11 locus
Because SOX11 transcription is associated with histone acetylation,24,25 we performed chromatin immunoprecipitation (ChIP) and qPCR assays to examine whether CCND1 influences histone modification at the SOX11 locus. To determine the chromatin regions on the SOX11 gene that are likely reactive to the active histone mark H3K9/14Ac antibody, we searched for H3K9Ac ChIP signals in SOX11-expressing cells in the ENCODE database and identified 2 potential DNA regions for PCR amplification (amplicons; Figure 2A). ChIP-qPCR experiments were carried out in Z-138 and JEKO-1 cells that overexpress CCND1 using a previously validated H3K9/14Ac antibody and PCR primers for the 2 amplicons.24 Compared with empty vector controls, overexpression of CCND1 significantly increased H3K9/14Ac signals in both cell lines (Figure 2B-E). Enrichment of H3K9/14Ac at the SOX11 locus was also observed in Z-138 cells treated with HDAC inhibitor SAHA (Figure 2F). In addition, SOX11 expression was positively correlated with H3K9/14Ac levels after treatment with SAHA in Z-138 cells (Figure 2G). Therefore, these data indicate that CCND1 mediates SOX11 expression through histone acetylation at the SOX11 locus.
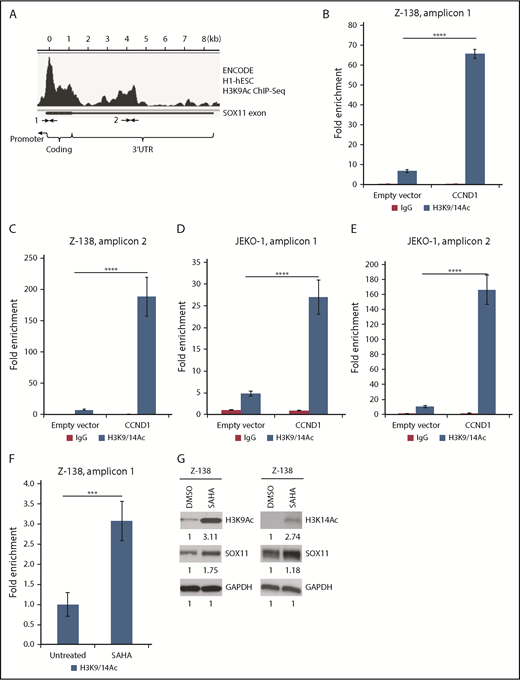
CCND1 affects histone modifications at the SOX11 locus. (A) ENCODE H3K9Ac ChIP sequencing (seq) data for H1-hESC cells show SOX11 gene regions that have positive ChIP peak signals. Arrows indicate regions where PCR primers were designed. (B-F) H3K9/14Ac chromatin immunoprecipitation assays for the SOX11 gene from indicated cells stably transduced with empty vector or CCND1 (B-E) or treated with 1 μM of SAHA for 16 hours (F). Bar graphs show means of qPCR signals of DNA region 1 or 2 (amplicons 1 and 2) pulled down by the H3K9/14Ac antibody as fold enrichment relative to the background signals from the isotype control immunoglobulin G (IgG) antibody. Error bars, standard deviation. (G) Immunoblot analysis of Z-138 cells treated with 2 μM of SAHA for 3 h and immunoblotted with indicated antibodies. ***P < .001, ****P < .0001 by 2-sided Student t test. DMSO, dimethyl sulfoxide; UTR, untranslated region.
CCND1 affects histone modifications at the SOX11 locus. (A) ENCODE H3K9Ac ChIP sequencing (seq) data for H1-hESC cells show SOX11 gene regions that have positive ChIP peak signals. Arrows indicate regions where PCR primers were designed. (B-F) H3K9/14Ac chromatin immunoprecipitation assays for the SOX11 gene from indicated cells stably transduced with empty vector or CCND1 (B-E) or treated with 1 μM of SAHA for 16 hours (F). Bar graphs show means of qPCR signals of DNA region 1 or 2 (amplicons 1 and 2) pulled down by the H3K9/14Ac antibody as fold enrichment relative to the background signals from the isotype control immunoglobulin G (IgG) antibody. Error bars, standard deviation. (G) Immunoblot analysis of Z-138 cells treated with 2 μM of SAHA for 3 h and immunoblotted with indicated antibodies. ***P < .001, ****P < .0001 by 2-sided Student t test. DMSO, dimethyl sulfoxide; UTR, untranslated region.
CCND1 interacts with HDAC1 and HDAC2
The effects of CCND1 overexpression and HDAC inhibition on histone acetylation of the SOX11 locus led us to examine whether CCND1 physically associates with members of the HDAC family to mediate SOX11 transcription. We coexpressed individual HDACs with CCND1 in HEK-293T cells and analyzed potential interactions using coimmunoprecipitation. Figure 3A shows that CCND1 strongly interacts with HDAC1, HDAC2, and to a lesser extent HDAC3, but not with other HDAC members. Validation of this interaction in Z-138 cells or in primary MCL samples by immunoprecipitation with CCND1 or HDAC1 antibody also showed CCND1 in the complex with HDAC1 and HDAC2 (Figure 3B). In addition, shRNA-mediated depletion of HDAC1 from Z-138, JEKO-1 (Figure 3C; supplemental Figure 3A), or GRANTA-519 (supplemental Figure 3B-C) cells resulted in increased SOX11 mRNA and protein levels, further confirming the role of HDAC1 in modulating SOX11 expression. Increased SOX11 expression was also observed when HDAC2 was depleted in Z-138 and JEKO-1 cells (Figure 3D). Together, these results indicate that interaction of CCND1 with HDAC1 and HDAC2 plays a role in mediating SOX11 expression.
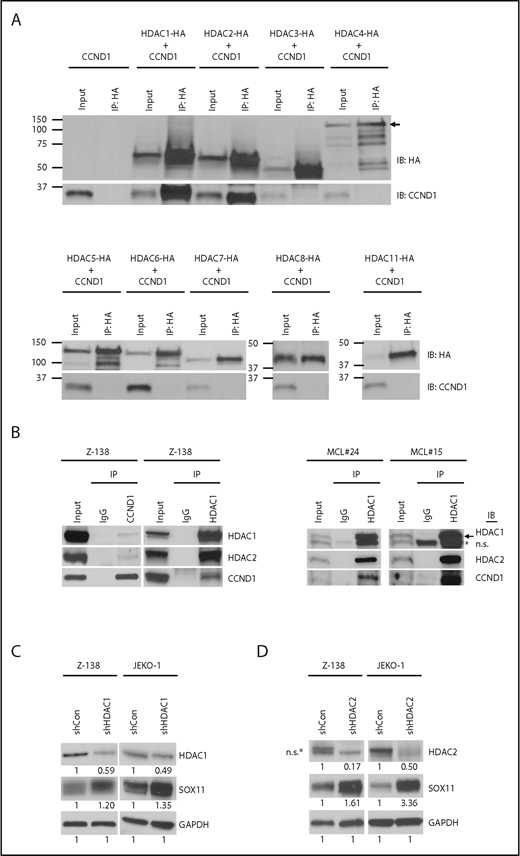
CCND1 interacts with HDAC1 and HDAC2. (A) HEK-293T cells were transiently cotransfected with untagged CCND1 and individual HA-tagged HDACs and immunoprecipitated (IP) with HA antibody followed by immunoblotting (IB) with indicated antibodies. Lysates before immunoprecipitation were used as input samples. Arrow indicates specific bands for HDAC4-HA. (B) Z-138 cells or primary MCL samples were immunoprecipitated with isotype control immunoglobulin G (IgG), CCND1, or HDAC1 antibody and immunoblotted with indicated antibodies. Lysates before immunoprecipitation were used as input samples. Arrow indicates specific HDAC1 staining. (C-D) Z-138 and JEKO-1 cells were stably transduced with control, HDAC1 (C), or HDAC2 (D) shRNA, and protein expression was analyzed by immunoblot analysis with indicated antibodies 3 days after transduction. *Nonspecific (n.s.) bands.
CCND1 interacts with HDAC1 and HDAC2. (A) HEK-293T cells were transiently cotransfected with untagged CCND1 and individual HA-tagged HDACs and immunoprecipitated (IP) with HA antibody followed by immunoblotting (IB) with indicated antibodies. Lysates before immunoprecipitation were used as input samples. Arrow indicates specific bands for HDAC4-HA. (B) Z-138 cells or primary MCL samples were immunoprecipitated with isotype control immunoglobulin G (IgG), CCND1, or HDAC1 antibody and immunoblotted with indicated antibodies. Lysates before immunoprecipitation were used as input samples. Arrow indicates specific HDAC1 staining. (C-D) Z-138 and JEKO-1 cells were stably transduced with control, HDAC1 (C), or HDAC2 (D) shRNA, and protein expression was analyzed by immunoblot analysis with indicated antibodies 3 days after transduction. *Nonspecific (n.s.) bands.
Reduced chromatin recruitment of HDAC1 in CCND1-overexpressing cells
We next asked whether CCND1 affected recruitment of HDAC1 at the SOX11 locus. ChIP-qPCR assays were performed in CCND1-overexpressing Z-138 cells using anti-HDAC1 antibody and PCR primers located near the SOX11 transcription start site. HDAC1 ChIP signals were significantly reduced in CCND1-expressing cells as compared with empty vector controls (Figure 4A). As an alternative approach, cell fractionation was used to assess the distribution of HDAC1 and HDAC2 within cellular compartments. Protein extracts from soluble cytoplasmic and nuclear fractions, as well as from insoluble nuclear fractions, from equal numbers of control and CCND1-overexpressing Z-138 cells were evaluated by immunoblot analysis. Nuclear proteins histone H3 and LAMIN A and C were used as markers for the nuclear fractions. We found that both HDAC1 and HDAC2 resided predominantly in the insoluble nuclear fraction in the empty vector controls. However, in cells with CCND1 overexpression, there was increased accumulation of HDAC1 and HDAC2 in the soluble nuclear fraction (Figure 4B). Similar increase of HDAC1 and HDAC2 protein levels in the soluble nuclear fraction was also observed in GRANTA-519 cells that overexpressed CCND1 (supplemental Figure 4). Taken together, these results indicate that CCND1 overexpression results in redistribution of HDAC1 and HDAC2 from the chromatin environment, including the chromatin of the SOX11 gene.
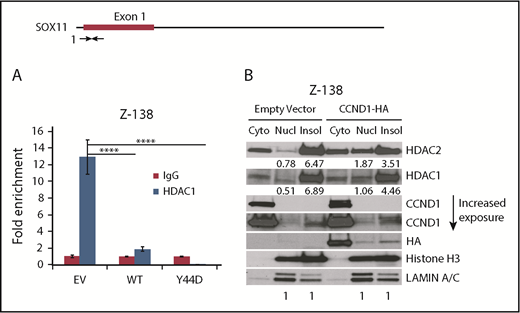
Reduced chromatin localization of HDAC1 in CCND1 overexpressing cells. (A) Chromatin immunoprecipitation assays for the SOX11 gene from Z-138 cells stably transduced with empty vector (EV), WT, or mutant Y44D CCND1. Bar graphs show means of quantitative PCR signals of region 1 (amplicon 1) pulled down by the HDAC1 antibody as fold enrichment relative to the background signals from the isotype control immunoglobulin G (IgG) antibody. Error bars, standard deviation. (B) Cytosolic, soluble, and insoluble nuclear extracts were prepared as described in “Materials and methods” from Z-138 cells that stably expressed empty vector or WT CCND1-HA. The extracts were immunoblotted with indicated antibodies. LAMIN A/C and histone H3 were used to confirm nuclear fractions. ****P < .0001 by 2-sided Student t test. cyto, cytoplasmic; insol, insoluble nuclear fraction; Nucl, soluble nuclear fraction.
Reduced chromatin localization of HDAC1 in CCND1 overexpressing cells. (A) Chromatin immunoprecipitation assays for the SOX11 gene from Z-138 cells stably transduced with empty vector (EV), WT, or mutant Y44D CCND1. Bar graphs show means of quantitative PCR signals of region 1 (amplicon 1) pulled down by the HDAC1 antibody as fold enrichment relative to the background signals from the isotype control immunoglobulin G (IgG) antibody. Error bars, standard deviation. (B) Cytosolic, soluble, and insoluble nuclear extracts were prepared as described in “Materials and methods” from Z-138 cells that stably expressed empty vector or WT CCND1-HA. The extracts were immunoblotted with indicated antibodies. LAMIN A/C and histone H3 were used to confirm nuclear fractions. ****P < .0001 by 2-sided Student t test. cyto, cytoplasmic; insol, insoluble nuclear fraction; Nucl, soluble nuclear fraction.
STAT3 negatively regulates SOX11 expression
To further confirm the positive role of CCND1 in regulating SOX11 expression, we transduced CCND1-expressing lentivirus into the SOX11− MCL cell line JVM-2. Surprisingly, compared with an increase in SOX11 levels in JEKO-1 cells, ectopically expressed CCND1 did not induce SOX11 in JVM-2 cells (Figure 5A). Analysis of publicly available gene expression data from SOX11+ and SOX11− MCL cases34 also revealed no correlation between SOX11 and CCND1 (Figure 5B). However, a positive correlation between CCND1 and SOX11 was observed in SOX11+ cases, although it was not statistically significant because of a small sample size (n = 15; supplemental Figure 5A). Analysis of relevant public data from another study,16 in which SOX11 positivity was identified in 13 cases, also showed a positive correlation between CCND1 and SOX11, although again not statistically significant (supplemental Figure 5B).
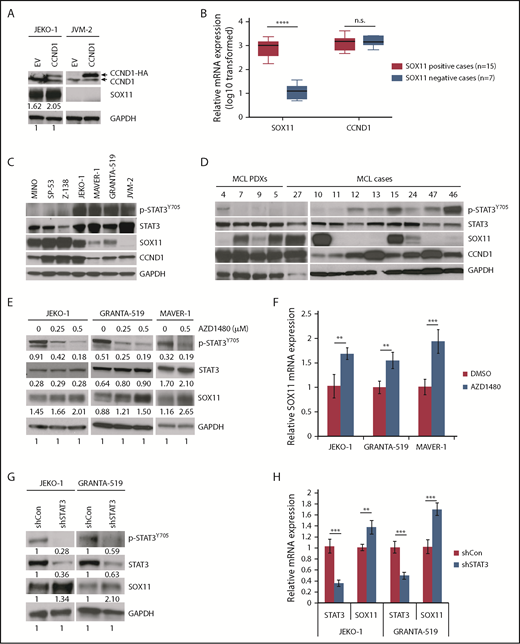
STAT3 negatively regulates SOX11 expression. (A) JEKO-1 and JVM-2 cells were transduced with empty vector (EV) or CCND1-HA, and cell lysates were immunoblotted with indicated antibodies. (B) Box plots of relative SOX11 and CCND1 mRNA expression in primary MCL cases. Gene expression data for SOX11 and CCND1 were obtained from GSE1645534 (supplemental Table 6) and plotted using GraphPad Prism v7.0a. (C-D) Immunoblot analysis of MCL cell lines (C) or MCL PDXs and primary MCL cases (D) with indicated antibodies. (E) Indicated MCL cell lines were treated with indicated doses of the JAK1/2 inhibitor AZD1480 for 16 hours and immunoblotted with indicated antibodies. (F) Indicated MCL cell lines were treated with AZD1480 as in panel E, and SOX11 mRNA was analyzed by qPCR. Shown are the means of mRNA expression levels after normalization to GAPDH signals from 4 independent amplification experiments. (G) JEKO-1 or GRANTA-519 cells were transduced with control or STAT3 shRNA, and protein lysates were prepared for immunoblot analysis with indicated antibodies. (H) Indicated MCL lines were treated with 500 nM of AZD1480 for 16 hours, and SOX11 mRNA was analyzed by qPCR. Bar graphs show the means of mRNA expression levels after normalization to GAPDH signals from 4 independent amplification experiments. Error bars, standard deviation. **P < .01, ***P < .001, ****P < .0001 by 2-sided Student t test. n.s. nonsignificance.
STAT3 negatively regulates SOX11 expression. (A) JEKO-1 and JVM-2 cells were transduced with empty vector (EV) or CCND1-HA, and cell lysates were immunoblotted with indicated antibodies. (B) Box plots of relative SOX11 and CCND1 mRNA expression in primary MCL cases. Gene expression data for SOX11 and CCND1 were obtained from GSE1645534 (supplemental Table 6) and plotted using GraphPad Prism v7.0a. (C-D) Immunoblot analysis of MCL cell lines (C) or MCL PDXs and primary MCL cases (D) with indicated antibodies. (E) Indicated MCL cell lines were treated with indicated doses of the JAK1/2 inhibitor AZD1480 for 16 hours and immunoblotted with indicated antibodies. (F) Indicated MCL cell lines were treated with AZD1480 as in panel E, and SOX11 mRNA was analyzed by qPCR. Shown are the means of mRNA expression levels after normalization to GAPDH signals from 4 independent amplification experiments. (G) JEKO-1 or GRANTA-519 cells were transduced with control or STAT3 shRNA, and protein lysates were prepared for immunoblot analysis with indicated antibodies. (H) Indicated MCL lines were treated with 500 nM of AZD1480 for 16 hours, and SOX11 mRNA was analyzed by qPCR. Bar graphs show the means of mRNA expression levels after normalization to GAPDH signals from 4 independent amplification experiments. Error bars, standard deviation. **P < .01, ***P < .001, ****P < .0001 by 2-sided Student t test. n.s. nonsignificance.
These observations prompted us to investigate additional mechanisms of SOX11 regulation. Because SOX11− MCL cases typically have plasmacytic differentiation,16,35 we hypothesized that SOX11 transcription might be negatively regulated during B-cell differentiation. To identify the molecules potentially involved in this process, we analyzed transcription factors that bind to the SOX11 locus, including the recently identified SOX11 enhancer,26 using ChIP sequencing data from the ENCODE project.36 Among SOX11 locus–bound factors, STAT3 was chosen for further study because of its role in B-cell differentiation.37 Interestingly, expression of SOX11 and the active phosphorylated Y705 (pY705) STAT3 were inversely correlated in MCL cell lines (except JEKO-1; Figure 5C), in primary MCL samples (except samples #11 and #15; Figure 5D), and in MCL PDXs (Figure 5D). To determine whether SOX11 is negatively regulated by activated STAT3, we treated JEKO-1, GRANTA-519, MAVER-1, and JVM-2 cells, which express high pY705 STAT3 levels, with AZD1480, an inhibitor of the upstream kinases JAK1 and JAK2.38 Immunoblot analysis showed that AZD1480 effectively blocked STAT3 phosphorylation and resulted in increased SOX11 mRNA and protein levels in JEKO-1, GRANTA-519, and MAVER-1 cells (Figure 5E-F), but not in JVM-2 cells (supplemental Figure 6A). Similar increases in SOX11 expression were also observed in GRANTA-519 cells after treatment with another STAT3 inhibitor, JAK inhibitor I (MilliporeSigma, Burlington, MA; supplemental Figure 6B). AZD1480-induced upregulation of SOX11 was mediated by STAT3 inhibition, because depletion of STAT3 also led to increased SOX11 mRNA and protein expression in both JEKO-1 and GRANTA-519 cells (Figure 5G-H).
In line with the repressive role of STAT3, interleukin-21 (IL-21) induced STAT3 activation39 in MINO, SP-53, Z-138 (Figure 6A-B), and MCL PDX models (Figure 6C) or ectopic expression of a constitutively active form of STAT340 in Z-138 cells (supplemental Figure 7) resulted in reduced SOX11 expression. Interestingly, IL-21 also reduced viability of MCL lines (MINO, SP-53, and Z-138) or PDX models (#5 and #7) with low or negative STAT3 activity (Figure 6D-E), whereas it had little effect on MCL cells with high pY705 STAT3 expression (JEKO-1, MAVER-1, and GRANTA-519; supplemental Figure 8). Because depletion of SOX11 also reduced cell viability in MINO, Z-138, and JEKO-1 cells (Figure 1E), we depleted SOX11 from the remaining MCL lines and determined their survival. We found that SOX11 depletion had little effect on the viability of GRANTA-519 cells and slightly increased cell growth in MAVER-1 cells (supplemental Figure 9A-B). Data from SP-53 cells were not available because of the sensitivity of this cell line under our lentiviral transduction conditions. Therefore, similar to IL-21 treatment, SOX11 depletion is toxic in MINO and Z-138 cells, whereas it has little effect in GRANTA-519 and MAVER-1 cells. JEKO-1 cells seem to be an exception, because they are resistant to IL-21 but sensitive to SOX11 depletion.
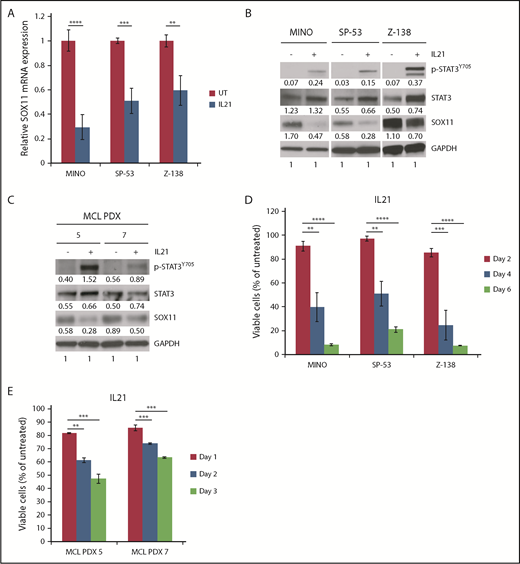
Effects of IL-21 on STAT3 activity, SOX11 expression, and cell viability in MCL cells. (A) Indicated MCL cell lines were treated with 50 ng/mL of IL-21 for 96 hours, and SOX11 mRNA was analyzed by qPCR. Shown are the means of mRNA expression levels after normalization to GAPDH signals from 4 independent amplification experiments. (B) Immunoblot analysis of indicated MCL cell lines treated as described in panel A. (C) Immunoblot analysis of MCL PDX models treated with 50 ng/mL of IL-21 for 72 hours. (D) Indicated MCL cell lines were treated with 50 ng/mL of IL-21, and viable cells (propidium iodide (PI) negative) were assessed by flow cytometry at indicated times. Shown are the means of PI− fractions compared with untreated samples from at least 2 independent experiments. (E) MCL PDX cells were treated with IL-21, and viable cells were analyzed as in panel D for the indicated times. Shown are the means of PI− fractions compared with untreated samples from at least 2 independent experiments. Error bars, standard deviation. **P < .01, ***P < .001, ****P < .0001 by 2-sided Student t test.
Effects of IL-21 on STAT3 activity, SOX11 expression, and cell viability in MCL cells. (A) Indicated MCL cell lines were treated with 50 ng/mL of IL-21 for 96 hours, and SOX11 mRNA was analyzed by qPCR. Shown are the means of mRNA expression levels after normalization to GAPDH signals from 4 independent amplification experiments. (B) Immunoblot analysis of indicated MCL cell lines treated as described in panel A. (C) Immunoblot analysis of MCL PDX models treated with 50 ng/mL of IL-21 for 72 hours. (D) Indicated MCL cell lines were treated with 50 ng/mL of IL-21, and viable cells (propidium iodide (PI) negative) were assessed by flow cytometry at indicated times. Shown are the means of PI− fractions compared with untreated samples from at least 2 independent experiments. (E) MCL PDX cells were treated with IL-21, and viable cells were analyzed as in panel D for the indicated times. Shown are the means of PI− fractions compared with untreated samples from at least 2 independent experiments. Error bars, standard deviation. **P < .01, ***P < .001, ****P < .0001 by 2-sided Student t test.
We next determined whether STAT3 was recruited directly to the SOX11 gene by performing ChIP-qPCR experiments with an anti-pY705 STAT3 antibody in JEKO-1 cells. Because STAT3 phosphorylation is required for DNA binding41 and this phosphorylation is efficiently inhibited by AZD1480, we used AZD1480-treated JEKO-1 cells as a negative control for the pY705 STAT3 ChIP-qPCR experiments. Figure 7A shows that pY705 STAT3 was specifically recruited to the SOX11 gene and enhancer, and this recruitment was significantly impaired after AZD1480 treatment. Increased active histone H3K9/14Ac signals at the SOX11 promoter and enhancer regions were also observed in AZD1480-treated MAVER-1 cells using H3K9/14Ac ChIP-qPCR (Figure 7B). Taken together, these findings indicate that STAT3 represses SOX11 transcription through recruitment of pY705 STAT3 to the SOX11 locus and that manipulation of the STAT3-SOX11 axis directly through SOX11 or indirectly through STAT3 induces toxicity in SOX11+ MCL cells.
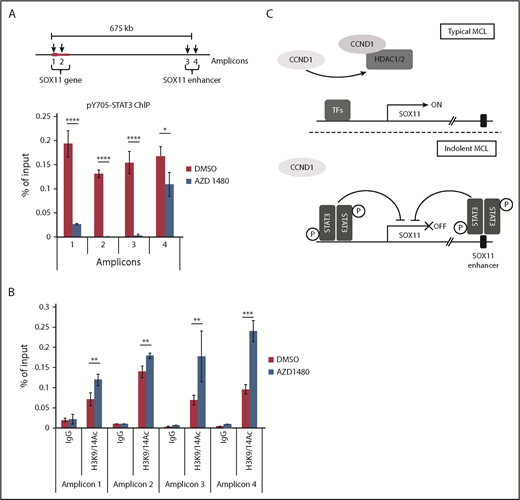
pY705 STAT3 is directly recruited to the SOX11 gene. (A) Diagram of the SOX11 gene and enhancer (not drawn to scale; top). Arrows indicate STAT3 binding sites. JEKO-1 cells were treated with 500 nM of AZD1480 or dimethyl sulfoxide (DMSO) for 16 hours, and chromatin immunoprecipitation assays were performed using the pY705 STAT3 antibody (bottom). (B) Chromatin immunoprecipitation assays using isotype immunoglobulin G (IgG) or H3K9/14Ac antibody for MAVER-1 cells treated with 500 nM of AZD1480 or DMSO for 16 hours. (A-B) Bar graphs show means of qPCR signals from 4 independent amplification experiments using primers to regions 1 to 4 (amplicons). Data are shown as percentage of total input chromatin DNA. Error bars, standard deviation. (C) Proposed model of SOX11 expression through distinct mechanisms mediated by CCND1 and STAT3 in typical or indolent form of MCL. *P < .05, **P < .01, ***P < .001, ****P < .0001 by 2-sided Student t test. TF, transcription factor.
pY705 STAT3 is directly recruited to the SOX11 gene. (A) Diagram of the SOX11 gene and enhancer (not drawn to scale; top). Arrows indicate STAT3 binding sites. JEKO-1 cells were treated with 500 nM of AZD1480 or dimethyl sulfoxide (DMSO) for 16 hours, and chromatin immunoprecipitation assays were performed using the pY705 STAT3 antibody (bottom). (B) Chromatin immunoprecipitation assays using isotype immunoglobulin G (IgG) or H3K9/14Ac antibody for MAVER-1 cells treated with 500 nM of AZD1480 or DMSO for 16 hours. (A-B) Bar graphs show means of qPCR signals from 4 independent amplification experiments using primers to regions 1 to 4 (amplicons). Data are shown as percentage of total input chromatin DNA. Error bars, standard deviation. (C) Proposed model of SOX11 expression through distinct mechanisms mediated by CCND1 and STAT3 in typical or indolent form of MCL. *P < .05, **P < .01, ***P < .001, ****P < .0001 by 2-sided Student t test. TF, transcription factor.
Discussion
The current study reveals 2 distinct regulatory mechanisms of SOX11 expression in MCL, specifically through CCND1 and STAT3. By genetically manipulating CCND1 levels using ectopic expression and gene knockdown, we have demonstrated that CCND1 is sufficient and necessary for SOX11 expression in the MCL cell lines Z-138, JEKO-1 and GRANTA-519. SOX11 expression is also negatively regulated by the post–germinal center B-cell differentiation factor STAT3, which may link SOX11 regulation to specific stages of B-cell differentiation.
In our proposed model, CCND1 interacts with and sequesters HDAC1 and HDAC2 from regulatory elements in the SOX11 locus, leading to increased histone acetylation and SOX11 transcription (Figure 7C). The ability of CCND1 to associate with transcriptional regulators and affect gene transcription is well recognized.42 Fu et al43 demonstrated that CCND1 preferentially associates with HDAC1, HDAC2, HDAC3, and HDAC5 and recruits HDAC1 to the PPAR-γ promoter to repress its transcription. We found that CCND1 consistently binds to HDAC1 and HDAC2 and, to a lesser extent, HDAC3, but not other HDAC members (Figure 3A). In contrast to transcriptional repression as a consequence of HDAC1 recruitment to the gene promoter as reported by Fu et al,43 we have shown that elevated CCND1 levels in MCL cells result in reduced HDAC1 recruitment at the SOX11 promoter and subsequent increased gene transcription. Mechanisms of gene expression through HDAC1 relocation from transcriptional regulators have been described. For example, Di et al44 reported that treatment with estrogen or the glycolysis inhibitor 2-deoxyglucose in the breast cancer cell line MCF-7 caused eviction of HDAC1 from a corepressor complex, leading to increased histone acetylation at the BRCA1 promoter and BRCA1 transcription. In another study focusing on developing neurons, expression of Lmo4 led to displacement of Hdac1 from the transcriptional repressor complex NuRD, resulting in derepression of the Ctip2 locus.45 Together, these observations support the removal of HDAC1 from regulatory elements as a common mechanism and indicate that diverse signals can mediate this process depending on the cellular context. In line with this notion, we speculate that in addition to CCND1, other abnormalities that interfere with HDAC1 function may also contribute to SOX11 expression. Characterization of new mutations, particularly those affecting HDAC1-interacting proteins, may provide further insight into the mechanisms of deregulated SOX11 expression.
Although our data favor CCND1-mediated HDAC1 sequestration as the mechanism of SOX11 upregulation, it is possible that CCND1 may influence SOX11 transcription by affecting enzymes that maintain the dynamic histone acetylation/deacetylation equilibrium, such as the histone acetyl-transferases EP300, PCAF, and GCN5. Indeed, CCND1 has been shown to physically associate with EP30046 and PCAF47 and regulate gene expression. Furthermore, through its cyclin-dependent kinase (CDK) partners CDK4 and CDK6, CCND1 elicits transcriptional changes by phosphorylating and activating GCN5.48 In the current study, we found that treating MCL cell lines with the EP300 inhibitor C646 strongly downregulated SOX11 expression (supplemental Figure 10), consistent with involvement of EP300 in regulating SOX11 expression. These observations warrant additional studies into the molecular interactions between CCND1 or the CCND1/CDK4 complex and transcriptional regulators at the SOX11 promoter.
Although ectopic expression of CCND1 can induce SOX11 expression in multiple MCL lines, SOX11 is not expressed in a subset of t(11;14)+ MCL cases16 or in any t(11;14)+ multiple myeloma (MM) cases.49 These observations suggest that SOX11 expression is regulated by additional factors and/or cellular contexts. To investigate additional mechanisms of SOX11 expression, we turned to a recent study profiling the methylome of MCL. In that study, Queirós et al26 found a potential SOX11 regulatory element 675 kb downstream of the SOX11 gene that was hypomethylated and associated with the active enhancer mark H3K27ac in SOX11+, but not in SOX11−, MCL cells. We then examined the transcription factors that are associated with this putative enhancer, as previously reported by the ENCODE project.36 Among factors that bind to this enhancer, we focused on STAT3 as a potential repressor of SOX11, because STAT3 is important for post–germinal center B-cell differentiation,37 a commonly recognized phenotype of SOX11− MCL.16,19 Indeed, our data revealed that STAT3 is recruited to both SOX11 gene and enhancer loci and functions as a transcriptional repressor in multiple MCL lines, including JEKO-1, GRANTA-519, and MAVER-1. Our findings are consistent with previous reports that showed constitutively active STAT3 in a majority (70%) of indolent leukemic MCL cases,50 which do not express SOX11.16 As mentioned, t(11;14)+ MM is another example of the inverse correlation of STAT3 activation and SOX11 expression, because a majority of MM cases show constitutive activation of STAT3.51 Our data, however, do not exclude additional mechanisms of SOX11 regulation, because nonconcordant cases do exist, including JEKO-1, MCL #15 and MCL #24 (pY705 STAT3+, SOX11+), and MCL #11 (pY705 STAT3−, SOX11−). Similarly, although AZD1480 effectively reduced pY705 STAT3 levels in JVM-2 cells, little SOX11 induction was observed, implicating a repressive mechanism other than pY705 STAT3 (supplemental Figure 6A). The Epstein-Barr virus–positive status of JVM-2 cells unlikely contributed to the lack of AZD1480-induced SOX11 expression, because Epstein-Barr virus–positive GRANTA-519 cells readily upregulated SOX11 expression after STAT3 inhibition (Figure 5E-F; supplemental Figure 6B). It is possible that mutations affecting SOX11 transcriptional machinery exist in MCL cells with little STAT3 activity. In support of this notion, many MCL tumors, including JVM-2 cells, were found to harbor frameshift mutations52-54 that affect mixed-lineage leukemia genes MLL2 and/or MLL4, which encode enzymes that methylate H3K4 and positively regulate gene transcription.55 Confirmation of these mutations and elucidation of the underlying mechanisms that regulate SOX11 expression are therefore warranted. In addition, potential crosstalk between CCND1 and STAT3, which has been observed in other systems, may provide additional clues to understand SOX11 regulation. For example, overexpression of a constitutively active form of STAT3 in HEK-293T cells56 or of a dominant-negative variant of STAT3 in mouse NIH-3T3 cells57 directly activated or inhibited CCND1 promoter activity, respectively. Interestingly, CCND1 was also found to repress STAT3 activation in HepG2 cells.58 Therefore, investigating how such crosstalk influences SOX11 expression in the context of MCL will be needed to further improve our understanding of complex SOX11 regulation.
Our findings have implications for a better understanding of the 2 clinically distinct MCL subtypes (ie, typical and indolent MCLs). We believe that the previously described post–germinal center phenotype of SOX11− indolent MCL16,19 could be related to upregulated STAT3 activity. In contrast, MCLs that initially express high levels of CCND1 and SOX11 are likely prevented from plasmacytic differentiation, possibly because of SOX11-mediated PAX5 upregulation,19 and thus have low STAT3 activity. Our data also have implications for the development of new treatment strategies for MCL. Although CCND1 and SOX11 are promising therapeutic targets, pharmacological inhibitors of these molecules are currently not available. In contrast, despite the availability of small-molecule inhibitors for HDAC1 and HDAC2 or STAT3 signaling, targeting these molecules would not be beneficial for MCL patients because of the undesired effect of increasing SOX11 levels. Indeed, clinical studies in MCL using vorinostat as a single agent have shown very modest activity to date. For example, Kirschbaum et al59 found that none of 9 MCL patients responded to vorinostat. Similarly, Ogura et al60 showed that vorinostat had no effect on the overall survival of all 4 enrolled MCL patients. Although the efficacy of STAT3 inhibition remains unclear from 1 study with limited MCL patient enrollment,61 the present study indicates that STAT3 may not be an ideal target in MCL because of its negative role in SOX11 regulation. Instead, our data advocate for additional studies that target the regulatory mechanisms of SOX11 to reduce SOX11 levels and potentially differentiate aggressive MCL tumors to an indolent phenotype. In support of this notion, we showed that IL-21, a potent plasma cell–inducing cytokine,62 effectively upregulated STAT3 activity, leading to reduced SOX11 levels and viability in SOX11+ MCL cells. Our data are thus consistent with previous studies that showed IL-21–mediated toxicity in MCL through an STAT3-dependent mechanism.63,64 However, IL-21 susceptibility seems limited to MCL cell lines with low or negative STAT3 activity, because pY705 STAT3high MCL cells are resistant to IL-21 treatment. Thus, our results also reveal pY705 STAT3 as a potential biomarker for IL-21–based therapy.
In summary, we have demonstrated that CCND1 and STAT3 play key roles in regulating SOX11 expression. CCND1 binds to and reduces recruitment of HDAC1 and HDAC2 to the SOX11 promoter, leading to increased histone acetylation and SOX11 transcription. In contrast, STAT3 directly interacts with the SOX11 gene locus and its enhancer and functions as a transcriptional repressor. These findings have implications for our understanding of SOX11 deregulation in MCL and may have therapeutic potential for MCL patients.
The online version of this article contains a data supplement.
The publication costs of this article were defrayed in part by page charge payment. Therefore, and solely to indicate this fact, this article is hereby marked “advertisement” in accordance with 18 USC section 1734.
Acknowledgments
This work was supported in part by National Institutes of Health, National Cancer Institute Cancer Center Support Grant P30CA033572 to the City of Hope, by the American Society of Hematology, by the Gabrielle’s Angel Foundation for Cancer Research, and by Department of Defense Grant CA140945 (V.N.N.).
Authorship
Contribution: A.M. and V.N.N. designed the experiments; A.M., N.S., A.P., and V.N.N. performed the experiments; A.M., M. Mei, and V.N.N. analyzed data; T.V.N. provided essential research reagents; R.W.C., E.B., M. Mei, L.P., L.V.P., L.W.K., D.D.W., S.T.R., W.C.C., and M. Müschen provided and reviewed pathological data; D.D.W. edited the manuscript; and V.N.N. directed the research and wrote the manuscript.
Conflict-of-interest disclosure: The authors declare no competing financial interests.
Correspondence: Vu N. Ngo, Department of Systems Biology, Beckman Research Institute, City of Hope, 1500 East Duarte Rd, Duarte, CA 91010; e-mail: vngo@coh.org.

This feature is available to Subscribers Only
Sign In or Create an Account Close Modal