

TO THE EDITOR:
Multiple myeloma (MM) constitutes 1.8% of malignancies in the United States, and its incidence is significantly higher among African Americans (AAs) than whites.1,2 Therefore, the impact of race on the disease biology and clinical outcomes of MM is an important area of research.3,4 Recent studies have found significant and increasing racial disparities in overall survival (OS) since the introduction of high-dose and novel agent–based therapies.5-10 Limited access to novel therapies has been considered partly responsible for the lower OS in AAs, and a number of studies have reported such racial disparities in the use of both novel therapies and transplantations.11-17 For example, a SEER data study of 35 842 MM patients reported significantly lower use of novel agents and autologous transplantations specifically in AAs.15 In contrast, data from several smaller studies, including a meta-analysis of clinical trials data, suggest that if access to care is equalized, disparities seen elsewhere may not be observed.18-23 Because lack of access to therapies can predominantly affect OS, investigation as to whether other disease- related features may also contribute to differences in outcome has been limited.20 However, the significantly higher incidence of MM in AAs may suggest differences in disease-initiating events that could also potentially affect outcome. Here, we have investigated the impact of racial disparities on outcome in a large MM patient population at Veterans Affairs (VA) hospitals with equal access to health care for all patients.
Patients diagnosed with MM in the VA’s nationwide electronic health records were identified using the VA Corporate Data Warehouse under a protocol approved by the VA Boston Healthcare System Institutional Review Board. Patients were identified using International Classification of Diseases codes for MM. To minimize the possibility of misclassification, patients were required to have at least 3 MM International Classification of Diseases–coded visits on different days and were required to have received at least 1 agent associated with MM treatment other than corticosteroids after the date of diagnosis. Patients who had no outpatient visits in the year before diagnosis were excluded, because these patients might not have been regular users of the VA system, and thus, their data could have been incomplete. Because the focus of this study was racial disparities between AAs and whites, patients not identified as AA or white were also excluded from our final analyses. Patient demographics, including drugs and therapies used, were identified through structured data in the VA Corporate Data Warehouse.
We identified 15 717 patients who satisfied the criteria for symptomatic MM in the VA health care system between 2000 and 2017. Of these, 3254 were AA and 8845 were white veterans. Patient characteristics listed in Table 1 are similar to SEER data.2 Median OS of veterans in this study was 4.62 years (95% confidence interval [CI], 4.50-4.74 years). Age at diagnosis had a substantial impact on OS, with median OS decreasing from 7.5 years among veterans diagnosed in their 40s to 5.9, 5.2, 3.5, and 2.6 years for those in their 50s, 60s, 70s, and 80s, respectively (P < .001). We next evaluated median OS between AA and white patients and observed that median OS was 5.07 years (95% CI, 4.70-5.44 years) for AA and 4.52 years (95% CI, 4.38-4.65 years) for white veterans (log-rank P < .001; Figure 1A).
Cohort demographics, transplantation, and novel therapy use
| Characteristic | Full cohort, % (n) | AAs, % (n) | Whites, % (n) | P |
|---|---|---|---|---|
| Age at diagnosis, y | <.001 | |||
| Median | 69.5 | 65.6 | 70.1 | |
| IQR | 62.6-77.0 | 58.6-73.6 | 63.5-77.5 | |
| Sex | <.001 | |||
| Female | 2.2 (262) | 3.4 (110) | 1.7 (152) | |
| Male | 97.8 (11 837) | 96.6 (3144) | 98.3 (8693) | |
| Rural | 33.6 (4026) | 17.1 (554) | 39.7 (3472) | <.001 |
| Income, $ | <.001 | |||
| Mean | 45 800 | 29 700 | 51 900 | |
| SD | 74 300 | 31 300 | 84 200 | |
| ISS stage | .942 | |||
| I | 24.2 (761) | 24.2 (230) | 24.2 (531) | |
| II | 35.9 (1132) | 36.3 (346) | 35.8 (786) | |
| III | 39.9 (1257) | 39.5 (376) | 40.1 (881) | |
| Transplantation | 9.4 (1136) | 10.1 (330) | 9.1 (806) | .092 |
| Novel therapy at induction | 81.8 (9898) | 82.5 (2686) | 81.5 (7212) | .213 |
| Thalidomide | 23.1 (2791) | 19.8 (645) | 24.3 (2146) | <.001 |
| Lenalidomide | 38.8 (4692) | 37.4 (1216) | 39.3 (3476) | .056 |
| Bortezomib | 31.3 (3786) | 40.4 (1314) | 27.9 (2472) | <.001 |
| Thalidomide and bortezomib | 1.7 (205) | 2.4 (78) | 1.4 (127) | <.001 |
| Lenalidomide and bortezomib | 9.9 (1195) | 12.7 (414) | 8.8 (781) | <.001 |
| Novel therapy over lifetime | 90.3 (10 929) | 90.8 (2955) | 90.2 (7974) | .293 |
| Thalidomide | 31.0 (3752) | 28.0 (912) | 32.1 (2840) | <.001 |
| Lenalidomide | 60.0 (7254) | 60.0 (1953) | 59.9 (5301) | .948 |
| Bortezomib | 46.6 (5634) | 57.9 (1885) | 42.4 (3749) | <.001 |
| Thalidomide and bortezomib | 11.7 (1418) | 13.8 (449) | 11.0 (969) | <.001 |
| Lenalidomide and bortezomib | 30.9 (3744) | 38.5 (1253) | 28.2 (2491) | <.001 |
Reported are characteristics for AAs, whites, and the full cohort (AAs and whites together), as well as P values relative to the difference between races. Novel therapy includes thalidomide, lenalidomide, pomalidomide, bortezomib, carfilzomib, and ixazomib.
IQR, interquartile range; ISS, International Staging System; SD, standard deviation.
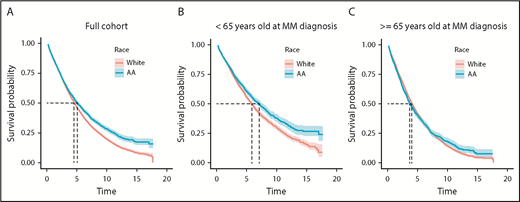
OS is shown (in years) for the full cohort and stratified at age <65 and ≥65 years at MM diagnosis. For the full cohort (A), median OS is 5.07 years for AAs and 4.52 years for whites (log-rank P < .001). For <65 years (B), median OS is 7.07 years for AAs and 5.83 years for whites (log-rank P < .001). For ≥65 years (C), median OS is 3.69 years for AAs and 4.04 years for whites (log-rank P = .63).
OS is shown (in years) for the full cohort and stratified at age <65 and ≥65 years at MM diagnosis. For the full cohort (A), median OS is 5.07 years for AAs and 4.52 years for whites (log-rank P < .001). For <65 years (B), median OS is 7.07 years for AAs and 5.83 years for whites (log-rank P < .001). For ≥65 years (C), median OS is 3.69 years for AAs and 4.04 years for whites (log-rank P = .63).
Because AAs are diagnosed with MM at a younger age, and we observed a substantial impact of age on outcome, we stratified patients by age (age <65 and ≥65 years at diagnosis). We still observed that among patients age <65 years at diagnosis, AA patients had a significantly superior median OS (7.07 years; 95% CI, 6.36-7.70 years) compared with whites (5.83 years; 95% CI, 5.44-6.09 years; log-rank P < .001). OS was similar across race in patients age ≥65 years; median OS was 3.69 years (95% CI, 3.45-4.05 years) for AA and 4.04 years (95% CI, 3.90-4.19 years) for white patients (log-rank P = .63; Figure 1B-C).
Because age at diagnosis could have accounted for some differences in OS even after stratifying around age 65 years, a Cox analysis, with age included as a continuous-time covariate, was performed in each stratum (age <65 and ≥65 years). We observed similar results; in those age <65 years, we observed a significant decrease in age-adjusted risk of death in AA compared with white patients (hazard ratio [HR], 0.86; 95% CI, 0.79-0.94; P = .001), whereas we did not observe significant difference in age-adjusted risk of death between AA and white patients age ≥65 years at diagnosis (HR, 1.05; 95% CI, 0.98-1.13; P = .18).
A number of prior studies have reported superior outcomes for white patients compared with AAs, and a common theory for this has been lack of access to health care, because of both social and financial reasons, in AA MM patients. To explain the possible role of health care access in our patient population, we investigated use of novel agents and stem cell transplantation (SCT). We observed no racial disparity at the VA in overall use of novel agents at induction, whether immunomodulatory drugs or proteasome inhibitors, with 82.5% of AA and 81.5% of white patients receiving novel therapy (P = .21) at induction (Table 1). In the most recent 5-year period (2012-2017), when both proteasome inhibitors and immunomodulatory drugs had become standard of care, patterns of use showed equal utilization, but use of novel therapy at induction had increased to 93.8% (AAs, 94.0%; whites, 93.7%; P = .72). Patterns of use were also similar when looking at lifetime exposure to novel therapy (AAs, 90.8%; whites, 90.2%; P = .29), as well as use of SCT (AAs, 10.1%; whites, 9.1%; P = .09).
Although there was no significant difference between races in the percentage of patients receiving novel agents at induction, there was a significant difference in the type of agent used. Bortezomib was used more frequently among AAs, thalidomide was used more frequently among whites, and lenalidomide was used at similar rates, whereas lenalidomide-bortezomib combination was used more frequently among AAs (Table 1). Nevertheless, these differences do not account for the superior survival among younger AAs; AAs had superior or equal survival to whites in every treatment subgroup in the age <65 years stratum (thalidomide: 6.2 vs 5.4 years; log-rank P = .004; lenalidomide: 10.2 vs 7.7 years; P = .071; and bortezomib: 7.0 vs 5.1 years; P < .001 in AA vs white veterans, respectively) and equal survival in the age ≥65 years stratum (log-rank P = .140 for each treatment group). In a multivariate Cox analysis, race remained independently associated with a significantly lower risk of death in AAs than whites among patients age <65 years (HR, 0.79; 95% CI, 0.72-0.87; P < .001), even after adjusting for age, sex, rurality, income, stage, transplantation, and the categories of therapy at induction listed in Table 1. In the group age ≥65 years, race was still not a significant factor (HR, 0.99; 95% CI, 0.92-1.07; P = .859) after making these adjustments.
These results suggest that in the VA system, with a lack of significant racial difference in use of novel therapies or SCT in MM, OS may be superior in AA patients, particularly in the younger population. Taken with previous research in other health care systems that does demonstrate disparities, our study suggests disparity may be primarily due to socioeconomic factors. Furthermore, the improved outcomes in AA MM patients also raise an important question about possible differences in disease biology. This is relevant, because incidence of MM is twofold higher in both men and women in AA compared with white patients.2 This has been observed in AA patients and native African patients, as reported in a study involving incidence of plasma cell disorder in Ghana.24 Along with differences in incidence, the age of onset and superior OS in AAs now highlight the need to further investigate race-related biological and genomic differences in the disease process to develop diagnostic, preventative, and therapeutic approaches.25
Acknowledgments
This work was supported by the VA Office of Research and Development Cooperative Studies Program, the VA/National Cancer Institute Big Data–Scientist Training Enhancement Program (BD-STEP), VA Merit Review Award 1I01BX001584, and National Cancer Institute, National Institutes of Health grant P01-155258-07, including supplements 3P01CA155258-07S1 and 3P01CA155258-07S2.
The views expressed are those of the authors and do not necessarily reflect the position or policy of the Department of Veterans Affairs or the US government.
Authorship
Contribution: N.R.F., S.V.Y., and N.C.M. conceived and designed the study; N.R.F. prepared and analyzed the data; all authors provided scientific input; N.R.F., S.V.Y., and N.C.M. wrote the manuscript; and all authors edited and critically reviewed the final version of the manuscript.
Conflict-of-interest disclosure: S.V.Y. receives research funding from Takeda and Celgene. G.R. is a consultant for Celgene, Incyte, and Gilead. M.B. receives research funding from Novartis. N.C.M. is a consultant for Celgene and Takeda and on the board of directors for OncoPep. The remaining authors declare no competing financial interests.
Correspendence: Nikhil C. Munshi, Dana-Farber Cancer Institute, 450 Brookline Ave, Boston, MA 02215; e-mail: nikhil_munshi@dfci.harvard.edu.

This feature is available to Subscribers Only
Sign In or Create an Account Close Modal