

Key Points
Treatment with KMP vs VMP in transplant-ineligible NDMM patients resulted in similar PFS, with no statistically significant differences.
There was a trend for longer time to progression in the KMP arm.

Abstract
The phase 3 CLARION study compared carfilzomib-melphalan-prednisone (KMP) with bortezomib-melphalan-prednisone (VMP) in transplant-ineligible newly diagnosed multiple myeloma (NDMM) patients. Patients were randomized 1:1 to KMP or VMP for nine 42-day cycles (C). Patients received carfilzomib on days (D) 1, 2, 8, 9, 22, 23, 29, 30 (20 mg/m2: C1D1, C1D2; 36 mg/m2 thereafter) or bortezomib on D1, 4, 8, 11, 22, 25, 29, 32 (1.3 mg/m2; D4, 11, 25, 32 omitted for C5-9). Melphalan (9 mg/m2) and prednisone (60 mg/m2) were administered on D1-4. The primary endpoint was progression-free survival (PFS). Nine hundred fifty-five patients were randomized (intention-to-treat population: KMP, n = 478; VMP, n = 477). Median PFS was 22.3 months with KMP vs 22.1 months with VMP (hazard ratio [HR], 0.906; 95% confidence interval [CI], 0.746-1.101; P = .159). Median overall survival was similar and not reached in either group (HR, 1.08; 95% CI, 0.82-1.43). Overall response rate was 84.3% for KMP and 78.8% for VMP. Complete response rate was 25.9% for KMP and 23.1% for VMP. Minimal residual disease–negative rates were 15.7% (KMP) and 15.5% (VMP). Adverse events (AEs) of interest (any grade) occurring with a ≥5% higher patient incidence in the KMP arm were acute renal failure (13.9% [KMP] vs 6.2% [VMP]) and cardiac failure (10.8% vs 4.3%). Grade ≥3 AE rates were 74.7% (KMP) and 76.2% (VMP). Grade ≥2 peripheral neuropathy was lower for KMP vs VMP (2.5% vs 35.1%). Treatment with KMP in CLARION did not yield a statistically significant difference in PFS vs VMP. This trial was registered at www.clinicaltrials.gov as #NCT01818752.
Introduction
Transplant eligibility continues to define initial multiple myeloma (MM) treatment.1 As MM primarily affects elderly patients (median age at diagnosis of 69 years in the United States), >50% of patients are not candidates for autologous stem cell transplantation, which has typically been offered to patients aged <65 years.1 Outcomes in transplant-ineligible patients are worse than in transplant-eligible patients,1 and there remains an unmet need to explore better treatment options for this population.
In the randomized, phase 3 VISTA study, addition of the proteasome inhibitor (PI) bortezomib, for a fixed treatment duration, to the then-standard melphalan-prednisone combination, met its primary endpoint of superior time to progression (TTP) in transplant-ineligible, newly diagnosed multiple myeloma (NDMM) patients. In addition, it demonstrated improvements in progression-free survival (PFS) and overall survival (OS).2,3 Since the VISTA study, use of melphalan-prednisone−based therapy for MM has declined. Although bortezomib-melphalan-prednisone (VMP) is an approved therapeutic option, peripheral neuropathy (PN) associated with this regimen often results in treatment interruption. In the VISTA study, 47% of bortezomib-treated patients reported PN and 22% had bortezomib dose reductions because of this adverse event (AE).4 In the phase 3b UPFRONT trial evaluating frontline bortezomib, PN rates were 50% (bortezomib-dexamethasone), 60% (bortezomib-thalidomide-dexamethasone), and 47% (VMP).5 Once-weekly and subcutaneous bortezomib administration may improve tolerability, but new treatments with better tolerability and more sustained efficacy remain needed.6
Carfilzomib is an irreversible, epoxyketone PI approved for the treatment of relapsed or refractory MM as a single agent (in certain jurisdictions) or as combination therapy with dexamethasone or lenalidomide-dexamethasone. In the phase 3 ENDEAVOR study, carfilzomib (56 mg/m2) and dexamethasone treatment resulted in superior PFS6 and OS compared with bortezomib-dexamethasone in relapsed or refractory MM patients.7 In the first prospective phase 1/2 study of carfilzomib-melphalan-prednisone (KMP) in transplant-ineligible NDMM patients (median age, 72 years; range, 66-86), this combination had acceptable tolerability with a low PN rate, and the maximum tolerated dose of carfilzomib was 36 mg/m2. At this dose, a promising overall response rate (ORR) of 90% and a satisfactory median PFS of 21 months were observed.8
Based on these results, we initiated this randomized, open-label, multicenter, phase 3 study (CLARION) to compare KMP with VMP in transplant-ineligible NDMM patients. The primary objective was to compare PFS between the 2 regimens. Key secondary endpoints were OS, ORR, complete response (CR) rate, patient incidence of grade ≥2 PN, global health status (GHS), and safety. Minimal residual disease (MRD) was an exploratory endpoint.
Methods
Study design and participants
In this randomized, open-label, phase 3 study (CLARION; #NCT01818752), patients were recruited from 183 sites in North America, Europe, the Asia-Pacific, and other regions (Mexico, Argentina, Israel). Transplant-ineligible patients aged ≥18 years with symptomatic NDMM (per International Myeloma Working Group [IMWG] diagnostic criteria9,10 ), measurable disease, and an Eastern Cooperative Oncology Group Performance Status of 0 to 2 were eligible. Ultimately, transplant ineligibility was determined by investigators. However, any patient aged <65 years needed to have ≥1 comorbidities, which were reviewed by the medical monitor. A creatinine clearance of ≥15 mL/min within 21 days prior to randomization was required. Other eligibility criteria are listed in the supplemental data, available on the Blood Web site. All enrolled patients provided written informed consent. The study protocol was approved by the institutional review boards or ethics committees of all participating institutions.
Patients were randomly assigned (1:1) to receive KMP (carfilzomib group) or VMP (bortezomib group). Randomization was stratified by International Staging System stage (I vs II-III), planned bortezomib administration route (IV vs subcutaneous) if randomly assigned to the bortezomib group, region (North America vs Europe vs Asia Pacific vs other), and age (<75 vs ≥75 years). To mitigate potential bias, a validated computer algorithm (Onyx Response Computational Assessment [ORCA]) was used to determine disease status with masking treatment information. An independent review committee also assessed disease progression and treatment response.
Procedures
Patients received randomly assigned study treatment of a maximum of nine 42-day cycles or until disease progression, unacceptable toxicity, withdrawal of consent, or death, whichever occurred first. No crossover between treatment arms was allowed. The fixed duration of 9 cycles was based on the VISTA study and a phase 1/2 study of KMP in transplant-ineligible NDMM patients.2,8 Patients received either carfilzomib administered as a 30-minute IV infusion on days 1, 2, 8, 9, 22, 23, 29, and 30 (20 mg/m2 on days 1 and 2 of cycle 1; 36 mg/m2 thereafter) or bortezomib (1.3 mg/m2; 3- to 5-second IV bolus or subcutaneous injection per investigator’s choice, dose modification, or regulatory approval) on days 1, 4, 8, 11, 22, 25, 29, and 32 (days 4, 11, 25, and 32 were omitted for cycles 5-9). IV hydration (250-500 mL) was administered before and after carfilzomib dosing during cycle 1 and at the investigator’s discretion for cycles ≥ 2. Dexamethasone (4 mg, IV or oral) was administered on days 8, 9, 22, 23, 29, and 30 before carfilzomib dosing during cycle 1 only. Patients received melphalan (9 mg/m2; oral) and prednisone (60 mg/m2; oral) on days 1-4 in each cycle. Antiviral prophylaxis was administered daily to all patients for the duration of treatment.
Patients were evaluated for disease response and progression per IMWG response criteria (supplemental Table 1).9,10 Other evaluations, including extramedullary plasmacytoma, skeletal surveys, hematologic assessments, serum chemistries, and cytogenetics, are described in the supplemental data.
A protocol amendment enabled inclusion of MRD as an exploratory endpoint. Bone marrow aspirate was collected at the time of first suspected ≥ CR to assess MRD by next-generation flow cytometry (NGF). For patients who consented to MRD analysis at end of treatment (EOT), bone marrow aspirate was also collected at EOT, regardless of response. MRD analysis was done only in countries that met tissue sample transportation requirements (supplemental Table 2). MRD data from China were excluded due to differences in data collection. MRD monitoring was centralized at the University of Navarra (Pamplona, Spain) and was performed per EuroFlow standard methodology following updated IMWG response criteria (supplemental data).
AEs were collected from time of informed consent to 30 days after last dose of all study drugs. The National Cancer Institute Common Terminology Criteria for AEs version 4.03 was used to describe and assess AE severity.
Outcomes
The primary endpoint was PFS based on ORCA-assessed outcomes. Secondary endpoints included OS, ORR (≥ partial response [PR]), CR rate (CR or stringent complete response [sCR]), neuropathy events (defined as an incident of grade ≥ 2 PN by standardized MedDRA query narrow search), GHS/Quality of Life (GHS/QoL) as measured by the European Organisation for Research and Treatment of Cancer Quality-of-life Questionnaire (EORTC QLQ) Core 30 (C30) GHS/QoL scale, and safety/tolerability. The GHS/QoL scale is transformed into scores from 0 to 100, with higher scores indicating better GHS.
Exploratory endpoints included EORTC QLQ-C30 (physical functioning, role functioning, fatigue, nausea/vomiting, and pain) and EORTC Quality of Life MM Module (QLQ-MY20; side effects and disease symptoms) domain subscales, Functional Assessment of Cancer Therapy Scale/Gynecological Oncology Group–Neurotoxicity (FACT/GOG-NTx, Version 4; “Additional Concerns” questionnaire score), TTP, and MRD status at time of first CR or sCR (determined by investigator) and/or at EOT. The FACT/GOG-NTx subscale is transformed into scores from 0 to 44, with lower scores indicating more neurotoxic symptoms/lower quality of life.
Statistical analyses
A prestudy statistical estimation of sample size was conducted. In total, 403 PFS events (disease progression or death) were required to have 85% power to demonstrate superiority at an alternative hazard ratio (HR) of 0.74 for the carfilzomib group vs the bortezomib group, with a log-rank test at a 1-sided overall significance level of 0.025 in a group sequential design with 1 interim and 1 final analysis. Based on the assumptions of exponentially distributed PFS, median PFS of 28.4 months in the carfilzomib group and 21 months in the bortezomib group, and a 3% dropout rate, 882 patients planned to be enrolled.
PFS and OS were compared between treatment groups using a log-rank test stratified by the randomization stratification factors. The corresponding HRs and their 95% confidence intervals (CIs) were estimated using a Cox proportional hazards model stratified by the same randomization stratification factors. The graphical approach by Maurer and Bretz was used to adjust for multiplicity in the primary and secondary endpoint testing, such that overall type I error rate was strongly controlled under 0.025 (1-sided).11
Rates of overall response and ≥ CR were calculated by treatment group, and the associated 95% CIs were estimated using the Clopper-Pearson method. These rates were compared between treatment groups using stratified Cochran-Mantel-Haenszel χ2 tests. The incidence of grade ≥ 2 PN was compared between treatment groups using a Pearson χ2 test. Overall differences between treatment groups in the EORTC QLQ-C30 and QLQ-MY20 scores were compared using a linear mixed model for repeated measures (supplemental data). Safety and tolerability, including PN rates, were assessed in the safety population (all randomized patients who received ≥1 dose of study treatment). All other secondary endpoints were assessed in the intent-to-treat population (all randomized patients).
The distribution of time-to-event endpoints were summarized descriptively using the Kaplan-Meier method. Corresponding 95% CIs for the medians were constructed using the method of Klein and Moeschberger12 with log-log transformation. All reported P values are 1-sided.
The funder collected and analyzed the data. The corresponding author had full access to data and final responsibility to submit for publication.
Results
Patients
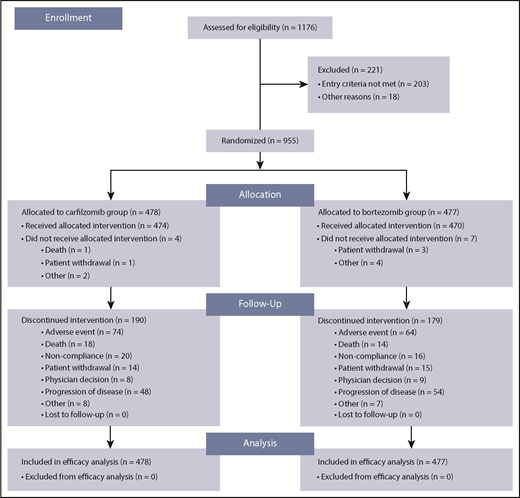
Between July 8, 2013 and June 30, 2015, 955 patients were randomly assigned to study treatment (carfilzomib group, n = 478; bortezomib group, n = 477). A total of 944 patients (carfilzomib group, n = 474; bortezomib group, n = 470) received ≥1 dose of study treatment. Patient disposition is shown in Figure 1 and supplemental Table 3. A total of 68% (324/477) patients in the bortezomib group received subcutaneous bortezomib exclusively. There were no major imbalances in terms of baseline characteristics between the 2 treatment groups. The median age was 72 years in both groups; 31.6% (151/478) and 30.4% (145/477) of patients in the carfilzomib and bortezomib groups, respectively, were aged ≥75 years (Table 1). The cutoff date for the final analysis was July 15, 2016. At data cutoff, 0.8% (4/474) and 0.2% (1/470) of patients in the carfilzomib and bortezomib groups, respectively, were still receiving treatment.
Baseline characteristics of the intention-to-treat population
| Characteristic | Carfilzomib group (n = 478) | Bortezomib group (n = 477) | Total (N = 955) |
|---|---|---|---|
| Age | |||
| Median, y | 72 | 72 | 72 |
| Range, y | 42-89 | 43-91 | 42-91 |
| Distribution, no. of patients (%) | |||
| <65 | 16 (3.3) | 35 (7.3) | 51 (5.3) |
| 65-74 | 311 (65.1) | 297 (62.3) | 608 (63.7) |
| ≥75 | 151 (31.6) | 145 (30.4) | 296 (31.0) |
| Sex, no. (%) | |||
| Male | 243 (50.8) | 239 (50.1) | 482 (50.5) |
| Female | 235 (49.2) | 238 (49.9) | 473 (49.5) |
| International Staging System stage, no. (%) | |||
| Stage 1 | 84 (17.6) | 94 (19.7) | 178 (18.6) |
| Stage 2 | 211 (44.1) | 203 (42.6) | 414 (43.4) |
| Stage 3 | 182 (38.1) | 180 (37.7) | 362 (37.9) |
| Unknown | 1 (0.2) | 0 | 1 (0.1) |
| Cytogenetics, no. (%)* | |||
| High risk | 54 (11.3) | 67 (14.0) | 121 (12.7) |
| Standard risk | 320 (66.9) | 324 (67.9) | 644 (67.4) |
| Unknown | 104 (21.8) | 86 (18.0) | 190 (19.9) |
| Race, no. (%) | |||
| White | 329 (68.8) | 339 (71.1) | 668 (69.9) |
| Asian | 123 (25.7) | 121 (25.4) | 244 (25.5) |
| American Indian or Alaska Native | 1 (0.2) | 2 (0.4) | 3 (0.3) |
| Other | 6 (1.3) | 3 (0.6) | 9 (0.9) |
| Not reported | 19 (4.0) | 12 (2.5) | 31 (3.2) |
| Serum β2microglobulin, mg/L, no. (%) | |||
| <2.5 | 40 (8.4) | 39 (8.2) | 79 (8.3) |
| 2.5 to <5.5 | 256 (53.6) | 256 (53.7) | 512 (53.6) |
| ≥5.5 | 182 (38.1) | 182 (38.2) | 364 (38.1) |
The high-risk group consisted of patients with the genetic subtypes t(4;14), t(14;16), or deletion 17p in ≥60% of plasma cells. The standard-risk group consisted of patients without t(4;14), t(14;16), and <60% of plasma cells with deletion 17p. The unknown risk group consisted of patients with fluorescence in situ hybridization result not done, failed, or quantity was not sufficient.
PFS, TTP, and OS
At the time of the final analysis, 421 PFS events had occurred (carfilzomib group, n = 207; bortezomib group, n = 214). The median follow-up time for PFS was ∼22 months. The median PFS was 22.3 months (95% CI, 20.9-26.7) in the carfilzomib group vs 22.1 months (95% CI, 20.8-24.4) in the bortezomib group (HR, 0.906; 95% CI, 0.746-1.101; P=.1590) (Figure 2). Results for PFS were consistent across all prespecified subgroups (including age, cytogenetic risk groups, and International Staging System stage; Figure 3). Because the primary endpoint of PFS was not statistically significant, statistical significance of secondary endpoints could not be established, regardless of nominal P values due to the prespecified multiplicity adjustment procedure.
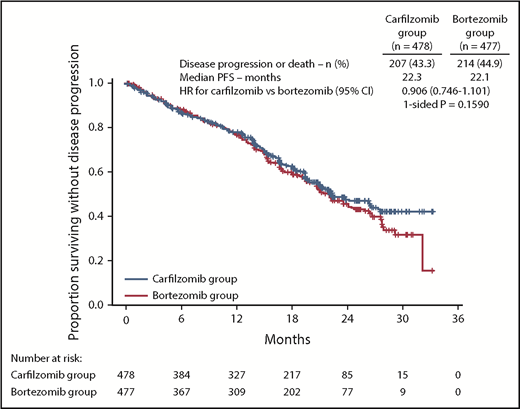
PFS by ORCA. Kaplan-Meier curves and median PFS in the intention-to-treat population.
PFS by ORCA. Kaplan-Meier curves and median PFS in the intention-to-treat population.
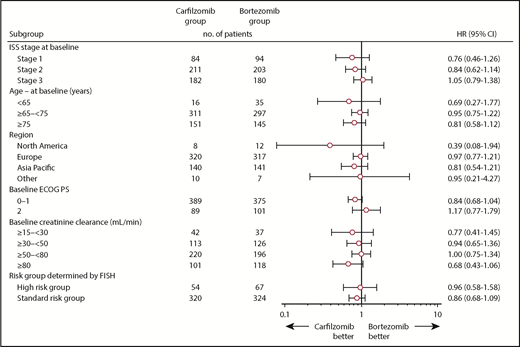
PFS in subgroups. ECOG PS, Eastern Cooperative Oncology Group performance status; FISH, fluorescence in situ hybridization; ISS, International Staging System.
PFS in subgroups. ECOG PS, Eastern Cooperative Oncology Group performance status; FISH, fluorescence in situ hybridization; ISS, International Staging System.
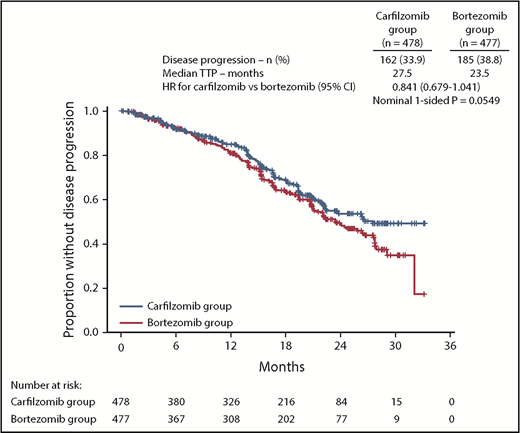
The median TTP was 27.5 months (95% CI, 22.4-not estimable) in the carfilzomib group vs 23.5 months (95% CI, 21.0-27.7) in the bortezomib group (HR, 0.841; 95% CI, 0.679-1.041) (Figure 4).
OS data were immature at the time of final analysis of PFS, with 99 (20.7%) and 78 (16.4%) death events in the carfilzomib and bortezomib groups, respectively (HR, 1.211; 95% CI, 0.896-1.637). An ad hoc OS assessment (data cutoff November 4, 2016) was performed in line with the data cutoff for database lock. This analysis demonstrated that 22.4% (107/478) and 19.9% (95/477) of patients in the carfilzomib and bortezomib treatment arms, respectively, had died (HR, 1.084; 95% CI, 0.819-1.434) (Figure 5). The median follow-up time for the updated assessment of OS was ∼27 months.
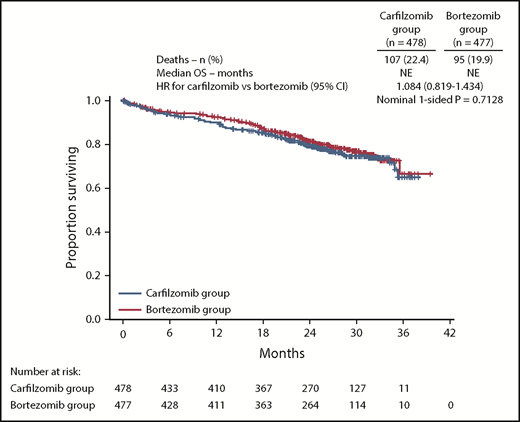
OS. Kaplan-Meier curves and median OS in the intention-to-treat population. NE, not estimable.
OS. Kaplan-Meier curves and median OS in the intention-to-treat population. NE, not estimable.
Response
Best overall responses are shown in Table 2. The proportion of patients who achieved a PR or better was 84.3% (95% CI, 80.7-87.5) in the carfilzomib group and 78.8% (95% CI, 74.9-82.4) in the bortezomib group (odds ratio [OR], 1.41; 95% CI, 1.01-1.97). The proportion of patients who achieved ≥ CR was 25.9% (95% CI, 22.1-30.1) in the carfilzomib group and 23.1% (95% CI, 19.4-27.1) in the bortezomib group (OR, 1.18; 95% CI, 0.88-1.59). The proportion of patients who achieved a very good PR or better was 61.3% (95% CI, 56.8-65.7) in the carfilzomib group and 49.3% (95% CI, 44.7-53.9) in the bortezomib group. The median duration of response (≥ PR) was 25.2 months (95% CI, 21.3-not estimable) in the carfilzomib group and 22.8 months (95% CI, 20.2-25.8) in the bortezomib group.
Treatment responses in the intention-to-treat population (determined by the sponsor using ORCA)
| Variable | Carfilzomib group (n = 478) | Bortezomib group (n = 477) | P (1-sided) |
|---|---|---|---|
| Best response, no. (%)* | |||
| sCR | 13 (2.7) | 10 (2.1) | |
| CR | 111 (23.2) | 100 (21.0) | |
| Very good PR | 169 (35.4) | 125 (26.2) | |
| PR | 110 (23.0) | 141 (29.6) | |
| Stable disease | 50 (10.5) | 75 (15.7) | |
| Progressive disease | 3 (0.6) | 3 (0.6) | |
| Not evaluable | 22 (4.6) | 23 (4.8) | |
| CR or better, % (95% CI) | 25.9 (22.1-30.1) | 23.1 (19.4-27.1) | |
| OR, carfilzomib group/bortezomib group (95% CI) | 1.179 (0.875-1.589) | .14 | |
| ORR, % (95% CI)† | 84.3 (80.7-87.5) | 78.8 (74.9-82.4) | |
| OR, carfilzomib group/bortezomib group (95% CI) | 1.412 (1.010-1.973) | .02 | |
| Duration of response, mo | |||
| Median | 25.2 | 22.8 | |
| 95% CI | 21.3-NE | 20.2-25.8 | |
Treatment responses were assessed by the sponsor using ORCA.
An sCR was defined by a negative immunofixation test for myeloma protein in urine and the disappearance of any soft tissue plasmacytomas, with <5% plasma cells in bone marrow, a normal serum free light chain ratio, and an absence of clonal cells in the bone marrow. See the supplemental Table 1 for definitions of “complete response,” “very good partial response,” “partial response,” “minimal response,” “stable disease,” and “progressive disease.”
Overall response was defined as a PR or better.
In subgroup analyses, median PFS, ORR, and CR+ rates were similar for patients receiving bortezomib subcutaneously or by IV (supplemental Table 4).
MRD
A total of 327 patients consented to optional MRD analysis at EOT. Of these, 223 had MRD analyses performed at the time of first suspected CR/sCR and/or EOT.
Overall, 51/327 (15.6%) patients had undetectable MRD (ie, <2 × 10⁻⁶) by NGF at the latest time point in which MRD was assessed and were thus classified as MRD-negative. Conversely, 172/327 (52.6%) patients were MRD positive: 36.4% with MRD positive ≥10−4, 11.9% with MRD-positive ≥10−5 and <10−4, and 4.3% with ≥2 × 10⁻⁶ and <10−5. There were no significant differences in MRD-negative rates between the carfilzomib vs bortezomib treatment arms (15.7% vs 15.5%) (supplemental Table 5).
PFS rates at 2 years were 83%, 79%, 63%, and 38% for patients who were MRD negative, MRD positive ≥2 × 10⁻⁶ and <10−5, MRD positive ≥10−5 and <10−4, and MRD positive ≥10−4, respectively (supplemental Figure 1). In both MRD-negative and MRD-positive patients, PFS was not significantly different between treatment arms (supplemental Figure 1).
Quality-of-life assessment
A total of 467 patients in the carfilzomib group and 464 in the bortezomib group had ≥1 quality-of-life assessment performed after starting treatment and were included in the health-related quality of life analysis. The difference in the least-square means of the health-related quality of life QLQ-C30 GHS/QoL score was 4.99 (95% CI, 3.48-6.51) with a nominal 1-sided P < .0001 in favor of the carfilzomib group. The difference in least-square means also favored the carfilzomib group (nominal 1-sided P < .0001) for EORT QLQ-C30 domain subscales of physical functioning, role functioning, fatigue, and pain and for the QLQ-MY20 subscale of side effects (supplemental Table 6).
For FACT/GOG-Ntx scores, the difference in least-square means was 3.32 (95% CI, 2.83-3.81) with a nominal 1-sided P < .0001 in favor of the carfilzomib group.
Exposure
Median treatment duration was 52.3 weeks (range, 0-68) in the carfilzomib group and 52.1 weeks (range, 1-68) in the bortezomib group. A total of 59% and 61% of patients in the carfilzomib and bortezomib groups, respectively, received the entire 54 weeks of planned treatment. The relative dose intensity was 93.0% for carfilzomib and 80.7% for bortezomib. The relative dose intensity of melphalan was 90.2% in both treatment groups, whereas the relative dose intensity of prednisone was 99.7% in the carfilzomib group and 100% in the bortezomib group. Dose reductions of study drug occurred in 32.1% of patients in the carfilzomib group and 37.4% of patients in the bortezomib group.
Safety
The most common AEs are shown in Table 3. AEs (preferred terms) of any grade that occurred with a higher patient incidence (≥5%) in the carfilzomib group compared with the bortezomib group were anemia, pyrexia, nausea, vomiting, hypertension, peripheral edema, dyspnea, and chills. AEs (preferred terms) of any grade that occurred with a higher patient incidence (≥5%) in the bortezomib group compared with the carfilzomib group were diarrhea, constipation, PN, peripheral sensory neuropathy, polyneuropathy, and neuralgia.
Treatment-emergent AEs in the safety population
| Carfilzomib group (n = 474) | Bortezomib group (n = 470) | |||
|---|---|---|---|---|
| All grades | Grade ≥3 | All grades | Grade ≥3 | |
| Any AE | 460 (97.0) | 354 (74.7) | 454 (96.6) | 358 (76.2) |
| Common hematologic AEs, preferred terms | ||||
| Anemia | 174 (36.7) | 80 (16.9) | 146 (31.1) | 64 (13.6) |
| Neutropenia/neutrophil count decreased | 170 (35.9) | 107 (22.6) | 186 (39.6) | 138 (29.4) |
| Thrombocytopenia/platelet count decreased | 127 (26.8) | 73 (15.4) | 151 (32.1) | 99 (21.1) |
| Leukopenia/white blood cell count decreased | 81 (17.1) | 42 (8.9) | 94 (20.0) | 60 (12.8) |
| Lymphopenia/lymphocyte count decreased | 37 (7.8) | 23 (4.9) | 34 (7.2) | 24 (5.1) |
| Common nonhematologic AEs, preferred terms | ||||
| Pyrexia | 172 (36.3) | 10 (2.1) | 86 (18.3) | 2 (0.4) |
| Peripheral edema | 84 (17.7) | 4 (0.8) | 54 (11.5) | 2 (0.4) |
| Fatigue | 79 (16.7) | 6 (1.3) | 85 (18.1) | 17 (3.6) |
| Asthenia | 72 (15.2) | 18 (3.8) | 70 (14.9) | 19 (4.0) |
| Pneumonia | 68 (14.3) | 46 (9.7) | 52 (11.1) | 35 (7.4) |
| Upper respiratory tract infection | 51 (10.8) | 4 (0.8) | 51 (10.9) | 7 (1.5) |
| Nausea | 168 (35.4) | 6 (1.3) | 133 (28.3) | 2 (0.4) |
| Vomiting | 118 (24.9) | 7 (1.5) | 91 (19.4) | 6 (1.3) |
| Diarrhea | 96 (20.3) | 6 (1.3) | 133 (28.3) | 27 (5.7) |
| Constipation | 66 (13.9) | 2 (0.4) | 114 (24.3) | 6 (1.3) |
| Decreased appetite | 67 (14.1) | 1 (0.2) | 88 (18.7) | 7 (1.5) |
| Hypokalemia | 53 (11.2) | 16 (3.4) | 63 (13.4) | 28 (6.0) |
| Dyspnea | 76 (16.0) | 16 (3.4) | 36 (7.7) | 3 (0.6) |
| Cough | 63 (13.3) | 0 | 63 (13.4) | 0 |
| PN | 29 (6.1) | 1 (0.2) | 155 (33.0) | 37 (7.9) |
| Peripheral sensory neuropathy | 8 (1.7) | 0 | 64 (13.6) | 7 (1.5) |
| Back pain | 57 (12.0) | 7 (1.5) | 59 (12.6) | 5 (1.1) |
| Hypertension | 104 (21.9) | 43 (9.1) | 32 (6.8) | 14 (3.0) |
| Rash | 26 (5.5) | 1 (0.2) | 49 (10.4) | 4 (0.9) |
| Insomnia | 49 (10.3) | 1 (0.2) | 65 (13.8) | 2 (0.4) |
| Cardiac failure | 31 (6.5) | 24 (5.1) | 10 (2.1) | 7 (1.5) |
| Acute kidney injury | 30 (6.3) | 20 (4.2) | 13 (2.8) | 7 (1.5) |
| Renal failure | 29 (6.1) | 14 (3.0) | 7 (1.5) | 3 (0.6) |
| Lung infection | 12 (2.5) | 10 (2.1) | 17 (3.6) | 13 (2.8) |
| Hyponatremia | 17 (3.6) | 9 (1.9) | 26 (5.5) | 15 (3.2) |
| Hypotension | 20 (4.2) | 3 (0.6) | 42 (8.9) | 16 (3.4) |
Data are n (%). AEs (preferred terms) reported in at least 10% (any grade) or 2% (grade ≥3) of patients in either treatment group are listed. The safety population included all patients who received at least 1 dose of a study drug.
The patient incidence of grade ≥3 AEs was 74.7% in the carfilzomib group and 76.2% in the bortezomib group. The most common grade ≥3 AEs in the carfilzomib group vs bortezomib group were neutropenia/neutrophil count decreased (22.6% vs 29.4%), anemia (16.9% vs 13.6%), and thrombocytopenia/platelet count decreased (15.4% vs 21.1%). Grade ≥3 AEs that occurred more frequently (≥2%) in the carfilzomib group compared with the bortezomib group were anemia, pneumonia, hypertension, cardiac failure, acute kidney injury, dyspnea, and renal failure.
The proportion of patients with grade ≥2 PN was 2.5% in the carfilzomib group vs 35.1% in the bortezomib group (OR, 0.048, 95% CI, 0.026-0.088; nominal P < .0001). The rate of any grade PN (preferred term) by bortezomib administration route is shown in supplemental Table 7.
The incidence rates for AEs of clinical interest (cardiac failure, acute renal failure, ischemic heart disease, and PN) are shown in Table 4.
Treatment-emergent AEs of interest in the safety population
| Carfilzomib group (n = 474) | Bortezomib group (n = 470) | |||
|---|---|---|---|---|
| All grades | Grade ≥3 | All grades | Grade ≥3 | |
| Acute renal failure | 66 (13.9) | 35 (7.4) | 29 (6.2) | 10 (2.1) |
| Cardiac failure | 51 (10.8) | 39 (8.2) | 20 (4.3) | 13 (2.8) |
| PN | 44 (9.3) | 1 (0.2) | 264 (56.2) | 56 (11.9) |
| Ischemic heart disease | 14 (3.0) | 10 (2.1) | 9 (1.9) | 6 (1.3) |
Data are n (%). AEs (Standardized MedDRA Queries narrow search) of clinical interest are shown. The safety population included all patients who received at least 1 dose of a study drug.
The incidence of AEs leading to carfilzomib discontinuation was 16.7% and for bortezomib was 14.7% (supplemental Table 8). The most frequently reported AEs (>1%) leading to carfilzomib discontinuation were acute kidney injury (1.5%), pneumonia (1.1%), asthenia (1.1%), and thrombocytopenia (1.1%). The most frequently reported AE (>1%) leading to bortezomib discontinuation was PN (3.4%).
Serious AEs were reported in 49.6% of patients in the carfilzomib group and 42.1% of patients in the bortezomib group (supplemental Table 9). The incidence of grade 5 treatment-emergent AEs was 6.5% in the carfilzomib group and 4.3% in the bortezomib group. A listing of grade 5 events by system organ class is shown in supplemental Table 10. As early as 3 months, there were more deaths due to AEs in the KMP vs the VMP arm (supplemental Figure 2).
Discussion
The CLARION study investigated KMP vs VMP in transplant-ineligible NDMM patients. The demographic and disease characteristics of patients enrolled in this study were similar to those of other trials in transplant-ineligible NDMM patients.2,13,14 With fixed duration of therapy (9 cycles), there was no statistically significant difference in PFS between the carfilzomib and bortezomib groups (median, 22.3 vs 22.1 months; HR, 0.91; 95% CI, 0.75-1.10). No significant PFS differences between treatment arms were seen in any of the preplanned subgroups. Based on the latest evaluation of OS, OS was similar between the carfilzomib and bortezomib groups (HR, 1.08; 95% CI, 0.82-1.43), and median OS was not reached in either group. Reported AEs in the treatment groups were consistent with the known toxicity profiles of the agents. The proportion of patients in the carfilzomib group with grade ≥ 2 neuropathy was lower than that in the bortezomib group, irrespective of bortezomib administration route. The carfilzomib group had, on average, better FACT/GOG-Ntx scores compared with the bortezomib group (nominal 1-sided P < .0001), with the between-group difference of 3.32 within the range of the estimated minimal important difference (MID; 3.3 to 4.3 points)15 The GHS/QoL score was higher in the carfilzomib group compared with the bortezomib group (overall treatment difference, 4.99; nominal 1-sided P < .0001), but the predefined MID (5.00 points)16-18 was not reached. The MID threshold for clinical significance was reached in favor of the KMP arm (nominal 1-sided P < .0001) for QLQ-C30 physical functioning (treatment difference, 6.18), fatigue (treatment difference, −6.16), and pain (treatment difference, −7.15) subscales.
The study design was based on a phase 1/2 study of KMP in transplant-ineligible NDMM patients, where the ORR was 90% and the median PFS was 21 months,8 and also on the VISTA study. The efficacy results observed in the carfilzomib group in the present study were consistent with those reported by Moreau et al.8 In contrast, the bortezomib group had longer PFS (median, 22.1 months) than what has been reported in other studies evaluating VMP; ∼4 months longer than in the VISTA (median, 18.3 months)19 and ALCYONE (median, 18.1 months)14 trials, and ∼5 months longer than in the UPFRONT trial (median, 17.3 months).5 Although the VMP control arm in CLARION performed better than that in previous reports evaluating the same regimen, the observed median PFS of 22.1 months was comparable with that from the prestudy estimation (21 months).
As part of the CLARION study design, the duration of therapy for patients in the carfilzomib and bortezomib groups was fixed at a maximum of 9 cycles. Most contemporary trials that have demonstrated the largest improvements in PFS for transplant-ineligible NDMM patients have used continuous treatment until disease progression.13,14,20-22 The fixed treatment duration used in CLARION may have limited the potential benefit in PFS and TTP for both arms in this trial.
In an exploratory endpoint, there was a trend for prolonged TTP in the carfilzomib group compared with bortezomib group (median, 27.5 vs 23.5 months). A potential hypothesis for the simultaneous trend of TTP benefit and lack of PFS benefit with a higher percentage of deaths in the carfilzomib group observed in CLARION is that KMP was less tolerated than VMP. Tolerability is a key concern for elderly patients with MM. In CLARION, the incidence of serious AEs, AEs leading to treatment discontinuation, and fatal AEs was higher in the carfilzomib group compared with the bortezomib group (supplemental Tables 8-10). A number of known adverse drug reactions of clinical interest were reported more frequently (≥5%) in the carfilzomib group than in the bortezomib group, including dyspnea (high-level term), hypertension, acute renal failure, and cardiac failure (grouped terms). Cardiac failure and acute renal failure are serious concerns for elderly patients. The safety results from CLARION are consistent with the hypothesis that toxicity (including more early deaths due to AEs in the KMP arm) in this elderly patient population may have contributed to the lack of PFS benefit observed in CLARION. Supporting this, disease progression was a more common PFS event in the bortezomib group, and death was a more common PFS event in the carfilzomib group. The lower incidence of AEs of interest for elderly patients (cardiac failure, acute renal failure) and grade 5 events in the VMP group may partially be a result of more experience with management strategies for the bortezomib-based combination. The lower rates of PN in the bortezomib group vs previously reported for the same regimen in the VISTA study (grade ≥3 peripheral sensory neuropathy: 1.5% vs 13%)2 supports this possibility. In addition, dose intensity was lower in the bortezomib group than in the carfilzomib group, which may have been due to investigators being more familiar with dose-modification strategies for bortezomib than carfilzomib.
Carfilzomib-based regimens have been shown to be highly active with encouraging safety profiles in the frontline setting, albeit in phase 1/2 studies with small patient numbers.23-27 The ENDEAVOR study demonstrated that carfilzomib and dexamethasone were superior to bortezomib and dexamethasone,6 and the ASPIRE study results demonstrated that the addition of carfilzomib to lenalidomide-dexamethasone improved PFS and OS,28,29 supporting the favorable efficacy and tolerability profile of carfilzomib and additional evaluation of alternative frontline carfilzomib-based combinations.
The results from this study also support the prognostic significance of MRD in MM and its use as a surrogate endpoint in clinical trials. Notably, CLARION is the first study to use NGF to characterize MRD in elderly MM patients. NGF enables highly sensitive, fast, and standardized quantification of MRD, with a limit of quantitation of <5 × 10−6.30 In CLARION, patients who achieved MRD negativity by NGF had higher 2-year PFS rates compared with MRD-positive patients, irrespective of treatment received. Furthermore, identical MRD-negative rates between treatment arms anticipated the lack of significant differences in PFS between arms, demonstrating the potential role of MRD as a surrogate endpoint in clinical trials.
The CLARION study used a twice-weekly dosing schedule of carfilzomib. A once-weekly schedule may be more convenient, particularly for elderly patients. The phase 1/2 IFM 2012-03 study evaluated weekly KMP in elderly patients with NDMM and found that this regimen was effective and well tolerated. The recommended phase 2 dose of carfilzomib was 70 mg/m2 (age <75 years) and 56 mg/m2 (age ≥75 years).31 It is unknown if a once-weekly KMP regimen using a higher dose of carfilzomib would improve outcomes compared with the twice-weekly KMP regimen (carfilzomib 36 mg/m2) used in CLARION. Further evaluation of frontline once-weekly carfilzomib regimens is warranted. The CLARION study was limited by the open-label design, which may introduce bias. In addition, the data collected do not allow for a detailed analysis of frailty according to the IMWG frailty scale, which predicts survival in elderly MM pattients.32
In conclusion, with a maximum of 9 cycles of therapy received, there was no statistically significant difference in PFS between the treatment regimens of KMP and VMP in transplant-ineligible NDMM patients. Increased toxicity in the carfilzomib group of CLARION may explain clinical outcomes, and melphalan may not be an ideal drug to combine with carfilzomib in this setting. Alternative carfilzomib-based regimens merit further evaluation in NDMM patients.
Qualified researchers may request data from Amgen clinical studies. Complete details are available at http://www.amgen.com/datasharing.
The online version of this article contains a data supplement.
The publication costs of this article were defrayed in part by page charge payment. Therefore, and solely to indicate this fact, this article is hereby marked “advertisement” in accordance with 18 USC section 1734.
Acknowledgments
Medical writing assistance was provided by Andrew Gomes (BlueMomentum, an Ashfield company, part of UDG Healthcare plc) and funded by Amgen Inc.
The CLARION study was supported by funding from Onyx Pharmaceuticals, Inc, an Amgen subsidiary.
Authorship
Contribution: T.F., J.S.-M., R.N., and J.H.L. designed the study; T.F., J.H.L., P.M., R.N., M.D., R.H., L.P., A.J., L.Q., B.P., and J.S.-M. collected data; M.O. performed the statistical analyses; T.F., J.H.L., P.M., R.N., M.D., R.H., L.P., A.J., L.Q., Z.K., A.Z.-K., M.O., B.P., and J.S.-M. participated in the analysis and interpretation of data; and all authors participated in the drafting of the manuscript and approved the final version before submission.
Conflict-of-interest disclosure: T.F. reports speakers’ bureau participation for Janssen, Celgene, Amgen, and Takeda; and serving in an advisory role for Sanofi, PharmaMar, Celgene, Janssen, Takeda, Amgen, and Karyopharm. P.M. reports consulting fees from Amgen Inc, Celgene, Takeda, Janssen, BMS, and Novartis. R.N. reports research grants and consulting fees from Celgene, Takeda, Amgen, BMS, and Janssen. M.D. reports serving in a consulting role for and receiving honoraria from Celgene, Janssen, Takeda, Amgen, and Novartis. R.H. reports research grants from Celgene, Amgen, and Novartis; and consulting fees from Janssen, Amgen, BMS, and Takeda. Z.K. and A.Z.-K. report stock ownership and employment with Amgen Inc. M.O. reports previous employment and stock ownership with Amgen. B.P. reports consultancy fees from Celgene, Takeda, Sanofi; honoraria fees Celgene, Janssen, Novartis, Merck, Amgen, and Sanofi; membership on an entity's Board of Directors or advisory committees fees from Celgene, Janssen, and Takeda; and research grants from Celgene, Takeda, EngMab, and Sanofi. J.S.-M. reports serving in a consulting/advisor role for Amgen Inc, BMS, Celgene, Janssen, MSD, Novartis, Takeda, Sanofi, and Roche. The remaining authors declare no competing financial interests.
Correspondence: Thierry Facon, Chef du Pôle des Spécialités Médicales et Oncologiques, Chef du Service des Maladies du Sang, CHRU rue Michel Polonovski, 59037 Lille, France; e-mail: thierry.facon@chru-lille.fr.

This feature is available to Subscribers Only
Sign In or Create an Account Close Modal