

Abstract
The hematopoietic system produces new blood cells throughout life. Mature blood cells all derived from a pool of rare long-lived hematopoietic stem cells (HSCs) that are mostly quiescent but occasionally divide and self-renew to maintain the stem cell pool and to insure the continuous replenishment of blood cells. Mitochondria have recently emerged as critical not only for HSC differentiation and commitment but also for HSC homeostasis. Mitochondria are dynamic organelles that orchestrate a number of fundamental metabolic and signaling processes, producing most of the cellular energy via oxidative phosphorylation. HSCs have a relatively high amount of mitochondria that are mostly inactive. Here, we review recent advances in our understanding of the role of mitochondria in HSC homeostasis and discuss, among other topics, how mitochondrial dynamism and quality control might be implicated in HSC fate, self-renewal, and regenerative potential.
Introduction
Hematopoietic stem cells (HSCs) are at the apex of the hematopoietic system. They are few in numbers and require in vitro expansion for successful stem cell–based therapies. However, the in vitro culture compromises HSC potency, which creates a challenge for in vitro expansion of HSC capacity for therapeutic purposes. Elucidating mechanisms that sustain HSC potential in their niches is of major importance for devising strategies to enhance the maintenance of HSCs with full-fledged ex vivo capacity for transplantation and gene therapy. Unveiling these mechanisms may also improve our grasp on the machinery that promotes the aging of normal HSCs as well as the generation of leukemic stem cells (LSCs), as pathways involved in these processes are likely to intersect and/or overlap.
HSCs, ROS, and mitochondria
HSCs are exquisitely sensitive to the cellular redox state and as a consequence are preferentially lodged in bone marrow niches that are thought to be hypoxic with low levels of reactive oxygen species (ROS).1,2 Balancing levels of ROS is of foremost importance as elevated ROS levels impair HSC function while subtle variations may act as a rheostat in modulating HSC fate.3 ROS-mediated compromise in HSC function is reversible in most cases.3 Mitochondria are the major source of ROS that are by-products of mitochondrial respiration. Stem cells sense mitochondrial health and activity through subtle modulations in ROS. It is thought that HSCs are maintained via restricting mitochondrial metabolism, which holds ROS at low levels and prevents HSC commitment and differentiation (Figure 1). Quiescent HSCs have low energy requirements, and are thought to rely mainly on glycolysis but not mitochondria as their source of energy sustained by hypoxic niches4-6 (Figure 1). HSC differentiation and commitment are associated with enhanced ROS level, activation of the mammalian target of rapamycin (mTOR)-signaling pathway, and increased mitochondrial biogenesis.7-13
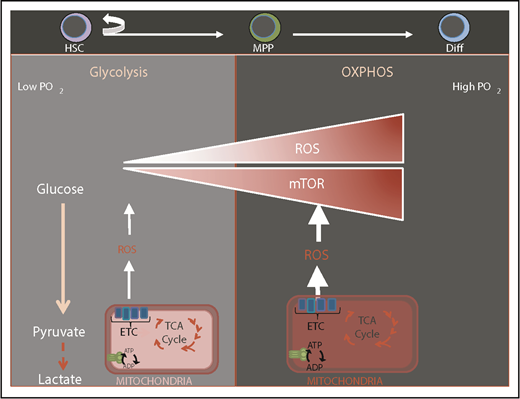
Transition from glycolysis to oxidative phosphorylation during HSC differentiation. Normal HSCs are known to be located in a low-oxygen niche environment and rely mostly on glycolysis. HSC differentiation is associated with elevation of ROS, mammalian target of rapamycin (mTOR) activation, enhanced mitochondrial biogenesis, and a switch to oxidative phosphorylation (OXPHOS) and increased oxygen consumption. ADP, adenosine 5′-diphosphate; ATP, adenosine triphosphate; Diff, differentiated cell; ETC, electron transport chain; TCA, tricarboxylic acid.
Transition from glycolysis to oxidative phosphorylation during HSC differentiation. Normal HSCs are known to be located in a low-oxygen niche environment and rely mostly on glycolysis. HSC differentiation is associated with elevation of ROS, mammalian target of rapamycin (mTOR) activation, enhanced mitochondrial biogenesis, and a switch to oxidative phosphorylation (OXPHOS) and increased oxygen consumption. ADP, adenosine 5′-diphosphate; ATP, adenosine triphosphate; Diff, differentiated cell; ETC, electron transport chain; TCA, tricarboxylic acid.
Mitochondria and ROS in the regulation of HSC commitment and differentiation
Mitochondria have key functions in many fundamental processes including oxidative phosphorylation (OXPHOS), apoptosis, ROS regulation, tricarboxylic acid (TCA) cycle, calcium signaling, and heme synthesis (Figure 2). In particular, mitochondria are the major site of adenosine triphosphate (ATP) production through OXPHOS, and constitute the metabolic center of the cell. During the process of OXPHOS, ROS are produced as the by-product of mitochondrial respiration.3 HSCs contain relatively high but inactive mitochondria5,14,15 consistent with their low levels of ROS. Recent evidence suggests that mitochondria play a key role in the maintenance of HSC quiescence and their potency to rapidly switch from dormancy to a metabolically active state.16-18 In addition, subtle but detectable differences in mitochondrial metabolism may distinguish normal blood and LSCs.19
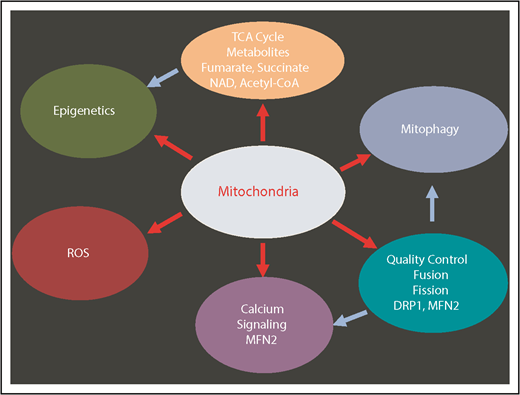
Multiple mitochondrial processes regulate HSCs. Red arrows show the mitochondrial-related processes. Blue arrows show the secondary effects. DRP1, dynamin-related protein 1; MFN2, mitofusin 2; NAD, nicotinamide adenine dinucleotide (oxidized).
Multiple mitochondrial processes regulate HSCs. Red arrows show the mitochondrial-related processes. Blue arrows show the secondary effects. DRP1, dynamin-related protein 1; MFN2, mitofusin 2; NAD, nicotinamide adenine dinucleotide (oxidized).
Cumulating evidence suggests that mitochondrial metabolism becomes the HSC’s principal source of bioenergetics during commitment and differentiation (Figure 1). This is illustrated by several genetic ablation models as observed in Stk11, Bid, Mtch2, Mortalin, and Tsc1, in which compromise in mitochondrial function was associated with either transient or sustained expansion of the hematopoietic progenitor compartment7,20-22 (Table 1). These abnormalities were concomitant with ROS elevation, loss of HSC quiescence, and a switch to OXPHOS metabolism that invariably led to reduction/exhaustion of the HSC pool. A similar phenotype is also produced by loss of hypoxia-inducible factor 1α or compromise in its inhibitor encoded by the Von Hippel-Lindau (VHL) gene. Loss of pyruvate dehydrogenase kinase (PDK) also leads to a comparable phenotype. PDK phosphorylates pyruvate dehydrogenase. This results in pyruvate dehydrogenase inactivation, which prevents pyruvate conversion into acetyl coenzyme A (acetyl-CoA) and further oxidation within the mitochondria.6 Genetic ablation of PDK in mice led to loss of quiescence, increased ROS, and exhaustion of the HSC pool, suggesting that HSCs shift from glycolysis to OXPHOS in order to switch from the maintenance state to differentiation. In contrast, deletion of phosphatase and tensin homolog (PTEN)-like mitochondrial phosphatase (PTPMT1), which leads to the blocking of pyruvate flux into mitochondria led to a large expansion of the HSC pool in the mouse while preventing HSC differentiation into downstream lineages.23 These findings suggest that interference with pyruvate entry into mitochondria deeply impact HSC fate.
Genetic models of mitochondrial impact on HSCs
| Gene | HSC profile | Mitochondrial profile | Implicated mechanism | References |
|---|---|---|---|---|
| Stk1 (LKB1) | Loss of LKB1 leads to severe pancytopenia, lethality; loss of HSC quiescence, exhaustion of the HSC pool, reduced HSC repopulating potential in vivo | Defects in mitochondrial biogenesis, reduced MMP and ATP in HSCs, defects in centrosomes and mitotic spindles, aneuploidy | AMPK/mTOR- FOXO-independent | 20,70,71 |
| Bid | Loss of BID phosphorylation results in loss of HSC quiescence, exhaustion of the HSC pool, reduction of HSC-repopulating potential in vivo | Increase in mitochondrial BID and mitochondrial oxidative stress | ATM-mediated BID phosphorylation maintains HSC quiescence | 21 |
| Mtch2 | Loss of MTCH2 increases mitochondrial OXPHOS, enhances HSC and progenitor cell entry into cycle | Elevated OXPHOS, increase in mitochondrial size, increase in ATP and ROS levels, protection from irradiation-induced apoptosis | MTCH2 is a negative regulator of mitochondrial OXPHOS downstream of BID | 72 |
| Hspa9 (Mortalin) | Mortalin KD led to loss of HSC quiescence and impaired ability to repopulate in vivo | Downregulation of cyclin-dependent kinase inhibitor- and antioxidant-related genes DJ-1 bound to Mortalin, acts as a negative regulator of ROS | Mortalin/DJ-1 complex guards against mitochondrial oxidative stress and is indispensable for the maintenance of HSCs | 22 |
| Tsc1 | TSC1−/− leads to loss of HSC quiescence and self-renewal, mTOR activation treated by an anti-ROS approach | Increased ROS and mitochondrial biogenesis | TSC-mTOR pathway maintains the quiescence and function of HSCs by repressing ROS production | 7 |
| polg | POLG mutator mice (proofreading-defective mitochondrial DNA polymerase) exhibit some similarity to HSC aging including anemia, lymphopenia, and myeloid lineage skewing; however, the HSC pool is maintained while HSC differentiation is blocked | mtDNA mutations | Intact mitochondrial function is required for multilineage stem cell differentiation, but mitochondrial DNA mutations are not a primary driver of somatic stem cell aging. | 14 |
| Uqcrfs1 (Rieske Iron-Sulfur Protein [RISP]) | RISP−/− results in loss of fetal HSC quiescence and defective repopulation ability, impaired fetal liver HSC differentiation, depletion of myeloid progenitors and erythroid precursors, severe pancytopenia | Accumulation of 2HG, fumarate and succinate leading to histone and DNA hypermethylation, histone hypoacetylation | Mitochondrial involvement in HSC maintenance and differentiation | 41 |
| Foxo3 | FOXO3−/− loss of HSC quiescence decreased HSC pool and in vivo competitive repopulation ability, myeloproliferation lack of rescue of in vivo repopulation ability by antioxidant therapy | Increased ROS, increased mitochondrial content and membrane potential, reduced ATP, increased glycolysis, reduced OXPHOS, fragmented mitochondria | Defective mitochondria might mediate HSC defects | 8,16 |
| Ptpmt1 | PTPMT1−/− led to cell cycle modulations, block in differentiation; HSC pool increased by 40-fold and a block in in vivo repopulation ability | Reduced oxygen consumption, enhanced glycolysis, enhanced fatty acid metabolism, activated AMPK, accumulation of PIP substrates, enhanced UCP2 activity | PTPMT1 is implicated in the metabolic regulation of HSC function | 23 |
| Mfn2 | MFN2−/− leads to myeloid-biased lineage commitment | Mfn2 increases buffering of intracellular Ca++ through its endoplasmic reticulum–mitochondria tethering, negatively impacting NFAT | 47 | |
| Pparg | Loss of PPAR-δ leads to loss of HSC maintenance | PML–PPAR-δ controls the asymmetric division of HSCs | 40 |
2HG, 2-hydroxyglutarate; AMPK, 5′ AMP-activated protein kinase; ATM, ataxia–telangiectasia; BID, BH3 interacting-domain death agonist; KD, knockdown; MTCH2, mitochondrial carrier homolog 2; PIP, phosphatidylinositol phosphate; PML, promyelocytic leukemia; UCP, uncoupling protein; TSC, tuberous sclerosis protein.
HSCs are relatively rich in mitochondrial content
HSCs have a significant number of mitochondria that are relatively inactive as compared with multipotent progenitors (MPPs) and more restricted progenitors.14,16,24 Bryder and colleagues conclude that mitochondrial content decreases in transition from HSCs to MPPs and increases in downstream mature progenitors such as pre–colony-forming unit erythroid and colony-forming unit erythroid in the mouse.14 However, it had long been presumed that HSCs have low mitochondrial mass. Mitochondrial mass has mostly been assessed using mitochondrial probes such as MitoTracker green (MTG) or Rhodamine 123 (Rho123) and analyzed by flow cytometry5,7,18 (Table 2). MTG is a mitochondrial-selective fluorescent label, which accumulates in the mitochondrial matrix where it covalently binds to mitochondrial proteins by reacting with free thiol groups of cysteine residues.25 Because it appears to bind to mitochondria regardless of their membrane potential, it is expected to reflect mitochondrial mass in cells. HSCs are MTG-low or Rho123-low compared with MPPs and committed erythroid, myeloid, and lymphoid progenitors.5,7,18,26-28 However, measurement of mitochondrial DNA (mtDNA) content, using quantitative polymerase chain reaction comparing selective mitochondrial DNA genes with nuclear DNA genes, indicates that bone marrow cells with high or low MTG signals in fact have similar mtDNA content.15 LSK-SLAM cells and committed progenitors also seem to have similar mtDNA content, indicating that MTG does not accurately reflect mitochondrial mass in hematopoietic cells. Our laboratories have found independently similar results of high levels of mitochondrial content in HSCs by measuring mitochondrial versus nuclear DNA (Ashwini Hinge, Jingyi He, M.-D.F., Raymond Liang, and S.G., unpublished observations). This is further supported by the use of a fluorescent reporter system to label mitochondria. In mice expressing a fluorescent protein fused to the mitochondrial targeted element of the mitochondrial protein COXviii, named mtDendra2, LSK-SLAM have higher mtDendra2 signals than MPPs and committed progenitors.15 MtDendra2-high HSCs have threefold more mtDNA than mitoDendra2-low. Together, these findings strongly suggest that the mitochondrial mass has been underestimated in HSCs. The reasons for this are several. First, MTG binding to mitochondria is in fact dependent on their membrane potential and is sensitive to changes in mitochondrial function, although not as acutely as tetramethylrhodamine ethyl ester (TMRE).25 For instance, reagents that alter mitochondrial membrane potential (MMP) such as the mitochondrial uncoupler carbonyl cyanide m-chlorophenyl hydrazine (CCCP) do cause changes in the MTG signal. In addition, as recently shown in elegant studies, HSCs possess xenobiotic efflux pumps that actively exclude MTG. When efflux pumps are blocked by verapamil, MTG staining increases in all lineage-negative hematopoietic populations, and more so in HSCs.14,15 Importantly, these authors went on to functionally validate these observations with competitive transplantation experiments and found HSC activity in the MTG-low fraction without verapamil treatment whereas HSC activity was found in the MTG-high fraction after verapamil treatment. Likewise, competitive transplantation indicated that almost all long-term (LT) repopulation activity was in the dendra2-high fraction. Remarkably, similar results were observed in human HSCs.15 Other ways to examine mitochondrial content, including electron microscopy (EM) and immunofluorescence (IF) staining of mitochondrial membrane protein, have also failed to accurately estimate HSC mitochondrial content. This could be due to technical limitation of EM or 2-dimensional (2D) imaging, which can capture single plans within each cell, rather than through the entire cell volume. Mitochondria are highly dynamic, constantly changing their shape and network organization.29 Hence, a single 2D plan view from round cells, like HSCs, cannot provide insights into the full extent of the mitochondrial network, which appears to be largely dispersed throughout the cell body. Furthermore, components of the mitochondrial membrane, which is highly enriched with phospholipid, can be extracted to some extent by permeabilizing agents including triton, such that classical IF staining can give an underestimation of the mitochondrial network. Serial sections through individual cells followed by electron tomographic reconstruction, as well as super-resolution confocal imaging and 3-dimensional reconstruction30 will be needed to capture the entire mitochondrial network in HSCs.
Comparison of methods of mitochondrial content assessment in HSCs
| Probe/Technique | Product description | Use | Pros | Cons |
|---|---|---|---|---|
| MitoTracker green | Green-fluorescent dye that covalently binds to mitochondrial proteins | Mitochondrial mass | (1) Easy to use (2) Applicable to flow cytometry (3) Can be used to assess mitochondrial morphology by IF in cells with positive MMP73 | (1) Binding to mitochondria depends on the MMP and mitochondrial OXPHOS activity25 ; hence, poor method to assess mitochondrial mass in cells with low MMP such as HSCs (2) Dye is excluded from cells with xenobiotic efflux pump activity15 (3) Does not work on fixed cells (4) Cannot be used to assess mitochondrial morphology in HSCs because it gives poor resolution by IF due to lack of retention of the dye onto mitochondria (Ashwini Hinge and M.-D.F., unpublished data) |
| Rhodamine 123 | Cell-permeant, cationic, green-fluorescent dye that is readily sequestered by active mitochondria | MMP | Dye is excluded from cells with xenobiotic efflux pump activity24 | |
| qPCR for mtDNA | mtDNA, proxy for mitochondrial mass | (1) Quantitative method (2) Independent of the MMP and mitochondrial OXPHOS activity | (1) Inaccurate and variable results when using a low number of cells (1000) (Ashwini Hinge and M.-D.F., unpublished data) (2) mtDNA quantification is not directly proportional to mitochondrial mass because mitochondria contain multiple DNA copies and because mtDNA loss is uncoupled to mitochondrial body23,74 | |
| Electron microscopy | Mitochondrial structure | (1) Information on cristae structure (2) Independent of the mitochondrial activity and membrane potential | 2D EM provides information on one single plan per cell, which is insufficient to capture the entire mitochondrial network in round cells like HSC26 | |
| Immunofluorescence | Immunostaining for mitochondrial protein like Tom20 | (1) Mitochondrial shape and morphology (2) Mitochondrial content | (1) Independent of mitochondrial activity and membrane potential (2) High-resolution confocal imaging with 3D reconstruction for information on the entire mitochondrial network (3) Assessment of mitochondrial mass with MFI measurement | Highly dependent on fixation/staining conditions; works well with 2% PFA and 0.05% Triton for 1-2 min15,26 ; classical limitations of image quantification of fluorescence signals |
Description of various methods that have been used to measure mitochondrial mass in HSCs. The pros and cons are mostly applicable to HSCs. These methods are, however, classically used successfully in other tissues and cell types to measure mitochondrial content.
3D, 3-dimensional; EM, electron microscopy; IF, immunofluorescence; MFI, mean fluorescence intensity; mtDNA, mitochondrial DNA; PFA, paraformaldehyde; qPCR, quantitative polymerase chain reaction.
Mitochondrial metabolism in the regulation of HSC maintenance
Recent studies suggest that mitochondrial function might be implicated in HSC maintenance beyond mitochondrial involvement in HSC differentiation. This is not surprising given the noticeable mitochondrial network in HSCs. Bone marrow harvest exposes HSCs to ambient oxygen (21%), which leads to a decrease in the recovery of HSCs with LT potential while the number of hematopoietic progenitors increases.31 This process, which has been labeled extraphysiologic oxygen shock/stress (EPHOSS), is mediated by the induction of the mitochondrial permeability transition pore and ROS elevation.31 These studies suggest that the number of HSCs recovered from the bone marrow harvests using current protocols are significantly below the actual number of bone marrow–resident HSCs.
Studies in FOXO3−/− HSCs illustrate, however, how ROS levels may be uncoupled from HSC LT competitive repopulation activity.16 FOXO3 is a key regulator of HSC quiescence, and maintenance of the HSC pool.9,32,33 FOXO3 regulation of HSCs is thought to be mainly through the control of stem cell redox state.8,9,32,34 Importantly, FOXO3−/− studies8,16,35-38 suggest that FOXO3 regulates mitochondrial metabolism in HSCs. These studies suggest that HSC’s mitochondrial defects rather than ROS elevation may be implicated in compromising HSC’s LT competitive repopulation activity.16 In addition, in contrast to the notion that glycolysis sustains quiescence of HSCs, these studies raise the possibility that, at least under certain circumstances enhanced glycolysis may be associated with loss of quiescence and HSC activation.16
The importance of mitochondrial activity to the maintenance of HSCs is particularly pointed out by studies of MMP. It was shown that MMP is heterogeneous in immune phenotypically defined HSCs,16-18 and low mitochondrial activity as measured by membrane potential segregates HSCs that contain LT competitive repopulating units from competitive repopulating unit–deprived HSCs.17,18 These studies suggest that LT-HSCs may actively maintain low mitochondrial activity as part of their intrinsic property.
Mitochondrial metabolism is also specifically involved in the control of HSC maintenance. For instance, the peroxisome proliferator-activated receptors (PPARs) are implicated in HSC regulation. PPARs are ligand-inducible transcription factors with important functions in a variety of processes including regulation of metabolism, mitochondrial biogenesis, glucose, and lipid homoeostasis.
In particular, PPARγ regulates mitochondrial function and turnover, energy metabolism, fatty acid oxidation (FAO), antioxidant defense, and redox balance. PPARγ coactivator 1α (PGC1α), which is the master regulator of mitochondrial biogenesis, is one of the PGCs. It was reported recently that inhibition of PPAR-γ promotes ex vivo expansion of phenotypically and functionally defined subsets of human cord blood HSCs and hematopoietic progenitor cells. It was shown that PPAR-γ antagonism enhanced glycolysis without compromising mitochondrial metabolism39 partly through downregulation of expression of fructose-bisphosphatase 1 (FBP1), which is a negative regulator of glycolysis.
Mitochondrial FAO mediated by the PPARδ is also implicated in the regulation of HSCs as it has been shown that the PML-PPARδ axis regulates HSC self-renewal through promotion of asymmetrical divisions.40
Mitochondrial metabolism in the regulation of HSC epigenome
Mitochondrial-generated metabolites by OXPHOS and TCA cycle may serve as cofactors for histone modifiers and other epigenetic factors to influence the epigenetic landscape (Figures 2 and 3). For instance, it is thought that the FAO in HSCs is there to support acetyl-CoA generation.2 Acetyl-CoA fuels the TCA cycle to produce ATP under aerobic conditions. Acetyl-CoA is also the substrate used by histone acetyl-transferase enzymes to modify histone tails as an essential element of the epigenetic state of chromatin.
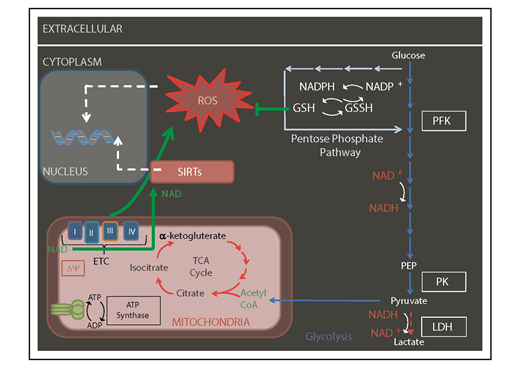
Mitochondrial metabolism regulates the epigenome. Some of the metabolites produced by OXPHOS and TCA cycle (including NAD and acetylCoA) serve as cofactors for, or used by, epigenetic factors like sirtuins (SIRTs) and histone acetyl-transferases. Δψ, mitochondrial membrane potential; CoA, coenzyme A; GSH, glutathione; GSSH, oxidized glutathione; LDH, lactate dehydrogenase; NADP, NAD phosphate; NADPH, reduced NADP; PEP, phosphoenolpyruvate; PFK, phosphofructokinase; PK, pyruvate kinase.
Mitochondrial metabolism regulates the epigenome. Some of the metabolites produced by OXPHOS and TCA cycle (including NAD and acetylCoA) serve as cofactors for, or used by, epigenetic factors like sirtuins (SIRTs) and histone acetyl-transferases. Δψ, mitochondrial membrane potential; CoA, coenzyme A; GSH, glutathione; GSSH, oxidized glutathione; LDH, lactate dehydrogenase; NADP, NAD phosphate; NADPH, reduced NADP; PEP, phosphoenolpyruvate; PFK, phosphofructokinase; PK, pyruvate kinase.
Another example is offered by studies of Rieske iron-sulfur protein (RISP), a key subunit of the mitochondrial complex III. These studies provided direct evidence of mitochondrial involvement in HSC maintenance and differentiation by showing that impaired mitochondrial respiration as a result of lack of RISP in fetal liver HSCs results in severe anemia. Loss of RISP did not impact the maintenance of HSC numbers but proliferation and repopulation ability of fetal liver HSCs were compromised. In addition, loss of RISP was associated with impaired fetal liver HSC differentiation, and depletion of myeloid progenitors and erythroid precursors. Similarly, loss of RISP led to severe pancytopenia, bone marrow hypocellularity, and rapid lethality in adult mice and was associated with a compromise in the in vivo competitive repopulation ability of adult HSCs.41
Loss of RISP had an impact on the production of metabolites such as accumulation of 2-hydroxyglutarate, fumarate, and succinate associated with histone lysine hypoacetylation and hypermethylation of histones and DNA, suggesting a link between mitochondrial-mediated metabolite production and impact on the epigenetic landscape. These studies40,41 support the notion that mitochondrial metabolism directly influences the epigenome42 (Figure 2).
Mitochondrial metabolism and dynamics
Healthy actively respiring mitochondria exist as a filamentous network, with elongated shapes, that are densely packed with cristae. Cristae are the folds made up by the inner mitochondrial membrane and allow for greater amounts of surface area to house the electron-transport chain complexes.43 Immature and inactive mitochondrial networks exhibit individual mitochondrion that are small and round with low numbers of swollen cristae. High MMP may indicate increased high proton motive force and electron transport chain activity, whereas low MMP is associated with lower amounts of respiration; complete loss of MMP can trigger apoptosis.
Mitochondrial metabolism is in part controlled by dynamic changes in their network. Mitochondrial dynamics such as fusion, fission, and motility, which together determine mitochondrial shape, contribute to mitochondrial quality control and the cellular responses to stress.43,44 The balance in fissions and fusions determine their length, enable their redistribution within the cell, and is an integral part of their quality control mechanism. Although mitochondrial fusion allows for the repair of a mildly damaged mitochondrion unit, highly damaged mitochondria or mitochondria with increased membrane potential inhibit fusion, and ongoing fission will segregate damages from healthy mitochondria, allowing the turnover of damaged mitochondria by mitophagy. These processes are mediated by dynamin and guanosine triphosphate (GTPases). Specifically, pro-fusion GTPases MFN1, MFN2, OPA1 as well as pro-fission GTPases FIS1, DRP1, MID49, MID51, and MFF29,45,46 are implicated in mitochondrial quality control (Figure 2).
Mitochondrial dynamics in the regulation of HSC maintenance
Among proteins regulating mitochondrial dynamics, mitofusin 2 (MFN2), a protein involved in mitochondrial fusion and tethering of mitochondria to the endoplasmic reticulum, has been implicated in the maintenance of HSCs with lymphoid (but not myeloid) potential.47 This capacity has been attributed to MFN2’s ability to buffer and negatively regulate intracellular calcium independent of MFN2’s ability to control mitochondrial fusion.47 The increase in intracellular calcium activates calcineurin, a phosphatase that negatively controls the nuclear factor of activated T cell (NFAT) isoforms; it turns out that MFN2 represses NFAT activity and hence maintains HSCs via its negative effect on intracellular calcium. It is noteworthy that calcineurin activity positively regulates dynamin-related protein 1 (DRP1), which mediates mitochondrial fragmentation and fission.48 Another point of debate is the regulation of Ca++ by MFN through the contact sites between mitochondria and the endoplasmic reticulum; whether MFN positively or negatively regulates calcium remains to be clarified.47-53 These combined findings raise the possibility that MFN2 regulation of calcium concentration may impact mitochondrial morphology concomitant with its effect on NFAT activity in HSCs. In line with these findings, enhanced calcium signaling promotes mitochondrial activity and has recently been implicated in HSC division54 (Figure 2).
Mitophagy or removal of mitochondria by selective autophagy in HSCs
Dynamic modulations of mitochondrial networks are the integral part of mitochondrial quality control that may specifically be involved in HSC maintenance. Although mitochondrial biogenesis, which increases mitochondrial mass and copy number by building new lipids and proteins into preexisting mitochondrial reticulum, has been associated with HSC commitment,43 clearance of mitochondria by mitophagy, a selective form of autophagy, has been implicated in HSC maintenance.55 Mitochondrial biogenesis is sustained by the activation of the mTOR-signaling pathway in HSCs, which partly controls the activity of PGC1α, the master transcription regulator in the mitochondrial biogenic regulatory cascade56 (Figure 1). In HSCs, mTOR activity is suppressed by the microRNA (miRNA) in the imprinted Gtl2 locus.12 HSCs with loss of the Gtl2 locus had a significant increase in MMP and mtDNA copy numbers as well as changes in mitochondrial cristae structure as seen by electron microscopy.
How mitochondrial content is regulated in HSCs is a major question. Few studies have examined mitochondrial biogenesis and turnover per se in HSCs in vivo. Some in vitro studies suggest that the capacity for mitochondrial turnover and mitophagy, a specific process of autophagy of mitochondria, is low in HSCs.15 This was shown in vitro using either chloroquine (CQ) to inhibit lysosomal acidification, thus blocking the mitophagy flux, or CCCP, which induces mitochondrial depolarization, and thus should trigger mitophagy. Hence, either treatment should change mtDNA content. CQ or CCCP did not significantly affect mtDNA content in HSCs, although CQ did so in progenitors. CQ and CCCP together surprisingly increased mtDNA content. These findings suggest an imbalanced mitochondrial turnover in HSCs, a point that needs further investigation. Nevertheless, the mitochondrial content of HSCs seems to be stable over the lifespan of a mouse,15 indicating that regulatory pathways that balance biogenesis and removal of mitochondria do exist in HSCs. Macroautophagy may play a role as evidenced by the fact that loss of ATG12 causes an increase in mitochondrial content, as seen with increased TOM20 immunostaining levels, and alter HSC functions.26 Mitophagy, which selectively removes dysfunctional or damaged mitochondria and maintains a healthy mitochondria population,57 may participate as well.
On the other hand, highly damaged mitochondria or mitochondria with increased membrane potential inhibit fusion. Ongoing fission will then segregate damaged from healthy mitochondria, allowing the turnover of damaged mitochondria by mitophagy (Figure 2). Mitophagy requires the stabilization of PTEN-induced putative kinase 1 (PINK1) at the outer membrane of mitochondria which initiates mitochondrial clearance. Under normal conditions PINK1 is imported into mitochondria by the translocase of outer mitochondrial membrane and the translocase of inner mitochondrial membrane. When mitochondrial protein import is compromised, PINK1 is stabilized at the outer membrane of mitochondria, and recruits and phosphorylates PARKIN, a cytosolic E3 ubiquitin ligase encoded by PARK2. This initiates the PINK1-PARKIN–dependent mitophagy. Notably, both PINK1 and PARK2 are mutated in early onset of recessive Parkinson disease.57
Mitophagy has been implicated in the maintenance and expansion of primitive symmetrically dividing HSCs using a Tie2 reporter mouse that marks the most primitive HSCs. Tie2+ HSCs showed expression of a substantial number of mitophagy genes, including PARKIN (PARK2), PINK1, Optineurin, and Map1lc3a (LC3).55 In this case, mitophagy seems to be regulated by the mitochondrial FAO pathway as indicated by the facts that most of the mitophagy genes were upregulated by activation of the PPAR-FAO pathway in vitro. Pparδ agonist treatment, which enhances cellular FAO activity, also enhanced PINK1 and mitophagic flux, whereas glucose uptake or levels of pyruvate and TCA cycle metabolites were unchanged.55 Consistently, silencing PARK2 by RNA interference–mediated knockdown decreased mitophagic flux in Pparδ agonist-treated cells and greatly decreased their regenerative potential in subsequent transplant studies. These findings show the importance of the PARK2-mediated mitophagy in response to the Pparδ agonist in vitro and in further supporting HSC regenerative potential.55 However, other studies have shown that genetic loss of PARK2 does not alter HSC functions. This could be due to compensatory mechanisms or a context-specific role for mitophagy in HSC functions.26 These findings warrant further investigations to understand the contribution of mitophagy to HSC function in vivo. It also remains unknown whether mitophagy generates a source of energy for primitive Tie2+ HSCs.
ATG12−/− HSCs also had increased numbers of mitochondria, which were more elongated than in wild-type HSCs, as examined by EM and IF staining for the mitochondrial outer membrane protein TOM20.26 These findings suggest that loss of autophagy increases mitochondrial activity in HSCs. This was accompanied by decreased HSC quiescence, and impaired HSC-regenerative capacity. Interestingly, ATG12−/− mice have a skewed ratio of circulating myeloid vs lymphoid, resembling the myeloid-biased HSC differentiation observed in old mice. Like old HSCs, ATG12−/− HSCs exhibited increased ATP and reduced nicotinamide adenine dinucleotide (NADH) as well as enhanced mitochondrial respiration activity, however, ATG12−/− HSCs unlike old HSCs had high MMP. Interestingly, old HSCs that retain high autophagy levels have better repopulation potential than HSCs displaying low autophagic activity.26 Therefore, autophagy is critically important to maintain low mitochondrial metabolic activity and for HSC functions, both in young and old HSCs. How autophagy prevents inappropriate activation of mitochondria and whether it is through removal of active mitochondria remains to be fully demonstrated. In HSCs, the loss of ATG12 significantly altered DNA methylation profile, with increased hypomethylated regions, quite interestingly mostly found in the region of genes encoding phosphoproteins.26 Further investigations into how mitochondria regulate epigenetics are warranted.
Mitochondria in aging HSCs and LSCs
The involvement of mitochondria in the regulation of HSCs under stress is poorly understood. Some inference could be made from studies of mitochondria in aging HSCs and leukemogenesis. Mitochondria are implicated in the process of aging,58,59 however, the evidence of mitochondrial involvement in the aging of HSCs is less clear. Although mutations of mitochondrial DNA lead to hematological abnormalities including defective HSC differentiation, anemia, lymphopenia, and myeloid-biased HSC differentiation, the HSC pool is maintained,14 suggesting that mitochondrial DNA mutations alone may not be responsible for the phenotype associated with aging HSCs.60,61
Modulations of nicotinamide adenine dinucleotide (NAD), which serves as a regulator of redox reactions, have been implicated in the organismal aging.59 NAD, a by-product of mitochondrial metabolism (Figure 3), is a cofactor for epigenetic regulators such as Sirtuin 1 (SIRT1) and SIRT3 that maintain the HSC pool62,63 and are key regulators of mitochondria (reviewed in Bigarella et al3 ). Alterations of NAD production with age might therefore be implicated in the phenotype of aging HSCs and its involvement should be explored.
Targeting ROS metabolism has been proposed as a therapeutic approach for eliminating cancer/LSCs.19 Although there is evidence for LSC reliance on glycolysis, cumulating evidence suggests that LSCs use mitochondrial oxidative phosphorylation as a major source of energy.19,64-67 Oxidative phosphorylation has been recognized as a targetable vulnerability of the leukemic cell. This has been explored specifically by targeting mitochondrial protein translation in models of human acute and chronic myeloid leukemia.65,66 Mitochondria may also transfer from normal stromal cells in the niche to the leukemic blasts providing leukemic cells with a survival advantage.68,69 These notable observations provide additional mitochondrial-related targets that may be explored therapeutically.
Conclusive remarks
In the recent past, the importance of mitochondrial metabolism, dynamics, and signaling for the maintenance of HSCs has been revealed. Although mitochondria are not known to produce energy through respiration in HSCs, mitochondrial homeostasis is critically important to maintain HSC functions. How HSCs exactly use mitochondria remains to be investigated. Future work should clarify (1) pathways by which mitochondria regulate priming of quiescent HSCs, (2) their lineage specification, and (3) HSC re-entry into quiescence. It will be important to understand how mitochondrial metabolism contributes to chronological aging in HSCs, and what is the role of mitochondrial remodeling in HSC functions during stress hematopoiesis, leukemic transformation, and regenerative conditions. Understanding mitochondrial metabolism is important not only for our fundamental understanding of HSC functions but also for therapeutic purposes: mitochondrial metabolism may well represent a viable target in HSC disorders and expansion or at least maintenance of HSC functions ex vivo.
Acknowledgments
The authors apologize to all authors whose work was not cited due to space limitation. The authors thank members of the laboratories of M.-D.F. and S.G. for critically reading the manuscript.
The work in the laboratory of M.-D.F. was supported by National Institutes of Health, National Institute of Diabetes and Digestive and Kidney Diseases grant R01 DK102890 and National Institute of General Medical Sciences grant R01GM112792. The work in the laboratory of S.G. was supported by National Institutes of Health, National Heart, Lung, and Blood Institute grant R01HL136255, National Cancer Institute grant R01CA205975, and funds from New York State Stem Cell Science (NYSTEM) Investigator Initiated Research Projects (IIRP) grant C32602GG.
Authorship
Contribution: M.-D.F. and S.G. contributed equally to reviewing the literature, writing and editing the manuscript.
Conflict-of-interest disclosure: The authors declare no competing financial interests.
Correspondence: Saghi Ghaffari, Department of Cell, Developmental and Regenerative Biology, Icahn School of Medicine at Mount Sinai, New York, NY 10029; e-mail: saghi.ghaffari@mssm.edu; or Marie-Dominique Filippi, Division of Experimental Hematology and Cancer Biology, Cincinnati Children’s Hospital, Cincinnati, OH 45229; e-mail: marie-dominique.filippi@cchmc.org.

This feature is available to Subscribers Only
Sign In or Create an Account Close Modal