

Key Points
The clonal diversity of the hematopoietic system declines with age and after serial transplantation.
Aged HSCs acquire mutations that might confer a selective advantage during serial transplantation.

Abstract
Although many recent studies describe the emergence and prevalence of “clonal hematopoiesis of indeterminate potential” in aged human populations, a systematic analysis of the numbers of clones supporting steady-state hematopoiesis throughout mammalian life is lacking. Previous efforts relied on transplantation of “barcoded” hematopoietic stem cells (HSCs) to track the contribution of HSC clones to reconstituted blood. However, ex vivo manipulation and transplantation alter HSC function and thus may not reflect the biology of steady-state hematopoiesis. Using a noninvasive in vivo color-labeling system, we report the first comprehensive analysis of the changing global clonal complexity of steady-state hematopoiesis during the natural murine lifespan. We observed that the number of clones (ie, clonal complexity) supporting the major blood and bone marrow hematopoietic compartments decline with age by ∼30% and ∼60%, respectively. Aging dramatically reduced HSC in vivo–repopulating activity and lymphoid potential while increasing functional heterogeneity. Continuous challenge of the hematopoietic system by serial transplantation provoked the clonal collapse of both young and aged hematopoietic systems. Whole-exome sequencing of serially transplanted aged and young hematopoietic clones confirmed oligoclonal hematopoiesis and revealed mutations in at least 27 genes, including nonsense, missense, and deletion mutations in Bcl11b, Hist1h2ac, Npy2r, Notch3, Ptprr, and Top2b.
Introduction
Advances in technology and medicine have freed modern Homo sapiens from natural selection imposed by the environment, predation, and disease, increasing the incidence of aging pathologies.1 Genomic instability, telomere attrition, epigenetic alterations, and perturbed proteostasis contribute to disrupted tissue homeostasis (ie, stem cell exhaustion) in the aged.2 Aged blood displays a loss of adaptive immunity and higher incidences of anemia and myeloid malignancies.3 Additionally, expanded hematopoietic clones are apparent in the peripheral blood (PB) of many aged individuals.4-13 More than 70% of humans older than 90 years of age display clonal hematopoiesis of indeterminate potential (CHIP; defined as ≥2% PB from a single cellular clone).4-11 DNMT3A, TET2, ASXL1, PPM1D, and JAK2 are often mutated in CHIP patients,6,7 who have a threefold and 11-fold greater risk of developing cardiovascular diseases or leukemia, respectively.6,11,14
Unknown is how many cellular clones actively contribute to hematopoiesis throughout life and how these numbers change with age.8 Previous studies interrogating clonal behavior in aged mammalian blood used hematopoietic stem cell (HSC) transplantation or mathematical modeling.15-17 Transplantation imposes tremendous stress on HSCs.18 Thus, studies based entirely on transplantation and ex vivo manipulation of HSCs may not accurately reflect steady-state hematopoiesis.19-21 Understanding the dynamics of the clonal complexity of blood throughout life requires noninvasive strategies. We recently reported a new approach to study the endogenous clonal complexity of blood that takes advantage of a Cre recombinase (CRE)–inducible multicolor allele (ie, Confetti allele).22,23 Here, using this approach and multiple CRE-labeling strategies, we observed a loss of clonal complexity in all hematopoietic compartments with age during steady-state hematopoiesis. Furthermore, repeated exposure to extreme hematopoietic stress by serial transplantation resulted in the clonal collapse of both aged and young blood. Whole-exome sequencing (WES) of serially transplanted bone marrow (BM) confirmed oligoclonal hematopoiesis and identified mutations in aged hematopoietic clones in genes not previously implicated in HSC self-renewal and maintenance (eg, Bcl11b, Hist1h2ac, Npy2r, Notch3, Ptprr, Top2b). These mutations might be important for HSC clonal expansion during aging and hematopoietic stress.
Methods
Mice
C57BL/6J, C57BL/6.SJL-PtprcaPep3b/BoyJ, Flk1+/Cre (Flk1Kdrtm1[cre]Sato/J), ROSA26+/Confetti (Gt[ROSA]26Sortm1[CAG-Brainbow2.1]Cle/J), and E2a+/Cre (B6.FVB-Tg[EIIa-cre]C5379Lmgd/J) mice (The Jackson Laboratory, Bar Harbor, ME) were housed in a pathogen-free facility. All animal experiments were carried out according to procedures approved by the St. Jude Children’s Research Hospital Institutional Animal Care and Use Committee.
Genotyping
Genotyping of Cre and Confetti alleles was as previously described.23
Transplants
A total of 0.2 × 10⁶, 1 × 10⁶, or 5 × 10⁶ whole BM cells from young (age 2 months) or old (age 24-26 months) CD45.2+ROSA26+/ConfettiVE-Cadherin+/Cre mice or from primary, secondary, or tertiary recipient mice were transplanted via tail vein into 8- to 12-week-old CD45.2+/CD45.1+ C57BL/6J mice previously subjected to 11 Gy of ionizing radiation in split doses of 5.5 Gy.
Cell-division kinetics
Single HSCs sorted into 96-well plates were inspected to follow division kinetics every 12 hours for 72 hours as described.24 Details can be found in supplemental Materials and methods (available on the Blood Web site).
Differentiation-potential assay
Single HSCs were sorted into 96-well plates and cultured in myeloid differentiation medium for 14 days as described.25 Emerging colonies were harvested, stained, and analyzed for myeloid lineages. Details can be found in supplemental Materials and methods.
PB analysis
PB was collected, stained, and analyzed as described.23
BM analysis
BM was harvested from the femurs, tibias, and pelvic bones of mice by crushing. c-Kit+ cells were enriched using anti–c-Kit microbeads (Miltenyi Biotec, San Diego, CA) followed by magnetic separation (autoMACS Pro Separator; Miltenyi Biotec). Cells were stained with antibodies to HSCs, multipotent progenitors (MPPs), common myeloid progenitors (CMPs), granulocyte/macrophage progenitors (GMPs), megakaryocyte/erythrocyte progenitors (MEPs), and common lymphoid progenitors (CLPs). Details can be found in supplemental Materials and methods.
Statistics and use of formula for predicting cell number from sample-to-sample variance
Summary statistics, including mean, median, minimum, maximum, percentile 25, percentile 75, and standard deviation, were reported. To calculate the clonal complexity of any tissue at any given time point, we used the mouse-to-mouse variance (MtMV) in Confetti color distribution.23 Details can be found in supplemental Materials and methods.
WES sample collection, preparation, and analysis
Genomic DNA was isolated using the Quick-DNA Miniprep kit (Zymo Research, Irvine, CA). Genomic libraries were generated using the SureSelectXT kit specific for the Illumina HiSeq instrument (Agilent Technologies, Santa Clara, CA), followed by exome enrichment (SureSelect XT mouse All Exon bait set). Exome-enriched libraries were then sequenced by the St. Jude Genome Sequencing Facility.
To identify somatic mutations within each transplant group, whole-exome sequences of CD45.1−Confetti clones isolated from the same donor group were compared with each other and to CD45.1−Confetti clones isolated from distinct donor groups. Details can be found in supplemental Materials and methods.
Results
The clonal complexity of native hematopoiesis declines with age
To illuminate the clonal dynamics of native hematopoiesis throughout life, we genetically labeled the hematopoietic system of mouse cohorts during embryonic development and analyzed the subsequent evolution of global clonal complexity. Specifically, we examined the MtMV in Confetti color distribution in the blood and c-Kit+ BM of cohorts of ROSA26+/ConfettiE2a+/Cre mice (Conf-E2aCre), ROSA26+/ConfettiFlk-1+/Cre mice (Conf-Flk-1Cre), ROSA26+/ConfettiVE-Cadherin+/Cre mice (Conf-VECre), and ROSA26+/ConfettiVav1+/Cre mice (Conf-Vav1Cre) from 2 to 26 months of age (Figure 1A). The Confetti reporter allele is recombined by CRE and randomly labels progeny with green fluorescent protein (GFP), yellow fluorescent protein (YFP), red fluorescent protein (RFP), or cyan fluorescent protein (CFP) (supplemental Figure 1A-B). Here, Confetti labeling is initiated in blastomeres (Conf-E2aCre), mesodermal hematopoietic precursors (Conf-Flk-1Cre), hemogenic endothelial precursors (Conf-VECre), and definitive hematopoietic stem and progenitor cells (HSPCs; Conf-Vav1Cre) (Figure 1A). As previously established, large numbers of Confetti+ precursors contributing to a given cell population result in a small MtMV of Confetti colors whereas small numbers of Confetti+ precursors results in high MtMV of Confetti colors (Figure 1B).23 The following formula estimates the number of contributing clones using the observed MtMV in Confetti colors: cell number = 10(−1.56 × log10(CV) + 1.47), where CV equals standard deviation/mean and represents the coefficient of variance. This formula yields accurate estimates of numbers of contributing clones when that number falls between 50 and 2500 clones.23 For Conf-Flk-1Cre, Conf-VECre, and Conf-Vav1Cre mice, PB clonal complexity at 2 months fell within this range (∼600 clones; Figure 1Ci). As expected, PB and BM clonal complexity of Conf-E2aCre mice fell below this range, as these mice express CRE when embryos are composed of very few cells. It therefore serves as a control for low complexity (Figure 1A-Ci). Thus, ∼600 cells labeled during embryonic development represent the precursors for the entire HSC pool in young adult mice (∼20 000 HSCs).26-30 This number serves as an initial benchmark from which we grossly examined how relative clonal complexity of blood changes with time. Across CRE lines, PB clonal complexity was stable until 16 to 20 months of age, after which it steadily declined for all cohorts except Conf-E2aCre (Figure 1Ci-ii; supplemental Figure 1D). Clonal complexity dropped slightly earlier in myeloid cells (supplemental Figure 1D). On average, we observed a 24% drop in PB clonal complexity of aged mice at 24 and 26 months relative to young mice (P = .03 and .01; false discovery rate q = 0.1 and 0.06, respectively) (Figure 1Cii). At 24 months, PB clonal complexity was reduced an average of 11.1%, 37.2%, and 44.0% in B-cell, T-cell, and myeloid cell lineages, respectively (supplemental Figure 1D).

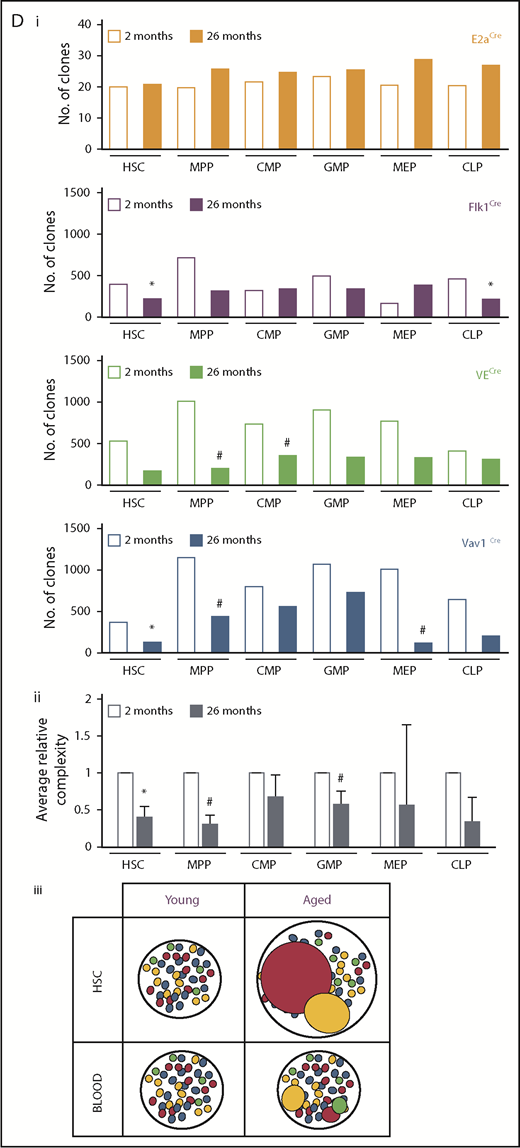
The global clonal complexity of the hematopoietic system declines with age. (A) Schematic of experimental approach. The clonal complexity of the PB and BM of cohorts of Conf-E2aCre, Conf-VECre, Conf-Flk1Cre, and Conf-Vav1Cre mice were examined at 2, 7, 12, 16, 20, 24, and 26 months of age (see supplemental Figure 1A-B for schematic of Confetti allele and Confetti color flow cytometry gating strategy). (Bi-ii) Schematic of the inverse relationship between numbers of initially labeled events and MtMV in the distribution of Confetti colors. (Ci) Analysis of the clonal complexity of the PB in cohorts of mice from 2 to 26 months of age. At 2 months old: Conf-E2aCre (n = 14), Conf-VECre (n = 13), Conf-Flk1Cre (n = 7), and Conf-Vav1Cre (n = 11). At 26 months old, Conf-E2aCre (n = 10), Conf-VECre (n = 5), Conf-Flk1Cre (n = 6), and Conf-Vav1Cre (n = 9). (Cii) Average PB clonal complexity of Conf-Flk1Cre, Conf-VECre, and Conf-Vav1Cre mice over time relative to 2 months of age. Error bars indicated standard deviation. (Di) The clonal complexity of the major BM HSPCs from cohorts of mice were calculated at 2 and 26 months of age from previously cKit+-enriched BM. At 2 months, Conf-E2aCre (n = 3), Conf-VECre (n = 6), Conf-Flk1Cre (n = 7), and Conf-Vav1Cre (n = 8). At 26 months, Conf-E2aCre (n = 7), Conf-VECre (n = 4), Conf-Flk1Cre (n = 5), and Conf-Vav1Cre (n = 5). (Dii) Average BM HSPC clonal complexities of Conf-Flk1Cre, Conf-VECre, and Conf-Vav1Cre mice over time relative to 2 months of age. Error bars indicate standard deviation (*P < .05; #P < .1). Source data are provided in supplemental Table 1. (Diii) Schematic of the consequences of aging on HSCs and PB clonal complexity. The absolute number of phenotypic HSCs increases with age (supplemental Figure 6A) due to the expansion of functionally impaired clones. In aged mice, “young-like” minimally expanded HSCs contribute disproportionately to PB, resulting in a less dramatic decrease in PB clonal complexity.
The global clonal complexity of the hematopoietic system declines with age. (A) Schematic of experimental approach. The clonal complexity of the PB and BM of cohorts of Conf-E2aCre, Conf-VECre, Conf-Flk1Cre, and Conf-Vav1Cre mice were examined at 2, 7, 12, 16, 20, 24, and 26 months of age (see supplemental Figure 1A-B for schematic of Confetti allele and Confetti color flow cytometry gating strategy). (Bi-ii) Schematic of the inverse relationship between numbers of initially labeled events and MtMV in the distribution of Confetti colors. (Ci) Analysis of the clonal complexity of the PB in cohorts of mice from 2 to 26 months of age. At 2 months old: Conf-E2aCre (n = 14), Conf-VECre (n = 13), Conf-Flk1Cre (n = 7), and Conf-Vav1Cre (n = 11). At 26 months old, Conf-E2aCre (n = 10), Conf-VECre (n = 5), Conf-Flk1Cre (n = 6), and Conf-Vav1Cre (n = 9). (Cii) Average PB clonal complexity of Conf-Flk1Cre, Conf-VECre, and Conf-Vav1Cre mice over time relative to 2 months of age. Error bars indicated standard deviation. (Di) The clonal complexity of the major BM HSPCs from cohorts of mice were calculated at 2 and 26 months of age from previously cKit+-enriched BM. At 2 months, Conf-E2aCre (n = 3), Conf-VECre (n = 6), Conf-Flk1Cre (n = 7), and Conf-Vav1Cre (n = 8). At 26 months, Conf-E2aCre (n = 7), Conf-VECre (n = 4), Conf-Flk1Cre (n = 5), and Conf-Vav1Cre (n = 5). (Dii) Average BM HSPC clonal complexities of Conf-Flk1Cre, Conf-VECre, and Conf-Vav1Cre mice over time relative to 2 months of age. Error bars indicate standard deviation (*P < .05; #P < .1). Source data are provided in supplemental Table 1. (Diii) Schematic of the consequences of aging on HSCs and PB clonal complexity. The absolute number of phenotypic HSCs increases with age (supplemental Figure 6A) due to the expansion of functionally impaired clones. In aged mice, “young-like” minimally expanded HSCs contribute disproportionately to PB, resulting in a less dramatic decrease in PB clonal complexity.
Most BM HSPC compartments displayed a drop in overall clonal complexity with age in Conf-Flk-1Cre, Conf-VECre, and Conf-Vav1Cre mice strains (Figure 1Di). On average, the clonal complexity of HSCs and MPPs in aged mice decreased by 59.3% (P = .045; q = 0.1578) and 69.6% (P = .053; q = 0.1578), respectively (Figure 1Dii). Although CLPs, CMPs, and GMPs displayed an ∼65.6% (P = .232), ∼32.3% (P = .229), and ∼42.7% (P = .0964; q = 0.1928) clonal loss, MEPs only lost 44.2% (P = .383) of clonal complexity with age (Figure 1Dii). As expected, Conf-E2aCre mice showed no loss of BM complexity (Figure 1Di). Altogether, these data reveal a global loss of clonal complexity with age in all BM compartments labeled after the blastomere stage. Interestingly, HSCs and MPPs were more sensitive to the selective pressures imposed by aging than other HSPCs.
Native hematopoiesis is characterized by clonal instability
Our study and others suggest that native hematopoiesis is polyclonal.19,20 The behavior of individual HSC clones over time can be explained by clonal succession (distinct clones progressively recruited),31-33 clonal stability (same clones steadily contributing),15,34 dynamic repetition (a specific clone recruited multiple times),35 or a combination of these models.36 Although our system cannot track individual clones, it can follow “pooled clones,” which are clones labeled with the same Confetti color. GFP-labeled pools are particularly useful because Confetti-allele driven GFP labeling is underfavored in most tissues.22,23,37 Thus, GFP+ hematopoietic cells almost certainly reflect the activity of a smaller pool of clones than RFP, CFP, or YFP and are useful for tracking the dynamics of a relatively small number of clones.
Here, we analyzed in individual mice the evolution of GFP-labeled clonal pools. Aging was occasionally accompanied by dramatic changes in PB GFP labeling (Figure 2; supplemental Figure 2). For example, we observed expansions of GFP-pooled clones with age (eg, Conf-E2aCre mouse #1 and Conf-VE/Cre mouse #1; Figure 2A). Both expansion and constriction of GFP-pooled clones (eg, Conf-Flk1Cre mouse #3, Conf-Vav1Cre mouse #3; Figure 2A) and YFP-pooled clones were also detected (eg, Conf-E2aCre mouse #3; Figure 2A). The relative change in the PB frequency of GFP from time point to time point throughout the life of individual mice revealed this as a common phenomenon observed across PB lineages (Figure 2B; supplemental Figure 2). These data support a model of PB clonal instability, in which clonal pools wax and wane throughout life.

Analysis of pooled clones over time reveals instability in the clonal composition of PB during native hematopoiesis. (A) Visualization of the distribution of GFP, YFP, RFP, and CFP in the PB of representative Conf-E2aCre, Conf-VECre, Conf-Flk1Cre, and Conf-Vav1Cre mice at 2, 7, 12, 16, 20, 24, and 26 months of age. (B) Fold change in the percentage of GFP relative to the preceding time point. Each line represents an independent mouse. Mice from all 4 cohorts are shown: Conf-E2aCre (n = 9), Conf-VECre (n = 7), Conf-Flk1Cre (n = 6), and Conf-Vav1Cre (n = 10). Evolution of percentage of GFP for individual PB lineages is shown in supplemental Figure 2 for each mouse, each mouse strain, and without normalization. Source data are provided in supplemental Table 1.
Analysis of pooled clones over time reveals instability in the clonal composition of PB during native hematopoiesis. (A) Visualization of the distribution of GFP, YFP, RFP, and CFP in the PB of representative Conf-E2aCre, Conf-VECre, Conf-Flk1Cre, and Conf-Vav1Cre mice at 2, 7, 12, 16, 20, 24, and 26 months of age. (B) Fold change in the percentage of GFP relative to the preceding time point. Each line represents an independent mouse. Mice from all 4 cohorts are shown: Conf-E2aCre (n = 9), Conf-VECre (n = 7), Conf-Flk1Cre (n = 6), and Conf-Vav1Cre (n = 10). Evolution of percentage of GFP for individual PB lineages is shown in supplemental Figure 2 for each mouse, each mouse strain, and without normalization. Source data are provided in supplemental Table 1.
Aging increases the functional heterogeneity of the HSC pool
HSCs give rise to downstream BM progenitors.21 To gain insight into the functional consequences of aging on HSCs, the division kinetics and differentiation potential of single young and aged HSCs was examined. Aged HSCs displayed slower division kinetics than young HSCs (Figure 3A). Aging also decreased the frequency of multipotent HSCs (Figure 3B; supplemental Figure 3). These data suggest an increase in HSC functional heterogeneity with age.

Aging functionally compromises HSCs and erodes the lineage relationships between BM compartments during native hematopoiesis. (A) Single HSCs from 3 independent young or aged mice were individually plated in 96-well plates in media that supports HSC expansion (i; n = 44-67 clones analyzed per mouse) or differentiation media (ii; n = 27-41 clones were analyzed per mouse). (i) Division kinetics for each well were tracked, percentages of the cumulative number of divisions are shown. (ii) Percentages of clones that generate 1, 2, 3, or 4 myeloid lineages (see supplemental Figure 3A). Averages are shown; error bars represent standard deviation (#P < .1). (B) Distribution of Confetti colors in PB and BM in young (age 2 months) and old (age 26 months) mice. Three representative examples are shown for each mouse strain at each time point. (C) Heatmaps summarize the correlation of Confetti color distribution between different hematopoietic compartments in young (i; age 2 months) and old (ii; age 26 months) mice. Heatmaps depict the Pearson correlation coefficient between 2 cell compartments. At 2 months old: Conf-E2aCre (n = 14), Conf-VECre(n = 13), Conf-Flk1Cre (n = 7), and Conf-Vav1Cre (n = 11). At 26 months old: Conf-E2aCre (n = 10), Conf-VECre(n = 5), Conf-Flk1Cre(n = 6), and Conf-Vav1Cre (n = 9). (iii) Correlation values of BM compartments relative to HSCs at 2 and 26 months of age. Paired Student t test of correlation coefficient of cells vs HSCs indicate that the correlations are significantly reduced with age (P = .03) (see also supplemental Figure 3B). Source data are provided in supplemental Table 1.
Aging functionally compromises HSCs and erodes the lineage relationships between BM compartments during native hematopoiesis. (A) Single HSCs from 3 independent young or aged mice were individually plated in 96-well plates in media that supports HSC expansion (i; n = 44-67 clones analyzed per mouse) or differentiation media (ii; n = 27-41 clones were analyzed per mouse). (i) Division kinetics for each well were tracked, percentages of the cumulative number of divisions are shown. (ii) Percentages of clones that generate 1, 2, 3, or 4 myeloid lineages (see supplemental Figure 3A). Averages are shown; error bars represent standard deviation (#P < .1). (B) Distribution of Confetti colors in PB and BM in young (age 2 months) and old (age 26 months) mice. Three representative examples are shown for each mouse strain at each time point. (C) Heatmaps summarize the correlation of Confetti color distribution between different hematopoietic compartments in young (i; age 2 months) and old (ii; age 26 months) mice. Heatmaps depict the Pearson correlation coefficient between 2 cell compartments. At 2 months old: Conf-E2aCre (n = 14), Conf-VECre(n = 13), Conf-Flk1Cre (n = 7), and Conf-Vav1Cre (n = 11). At 26 months old: Conf-E2aCre (n = 10), Conf-VECre(n = 5), Conf-Flk1Cre(n = 6), and Conf-Vav1Cre (n = 9). (iii) Correlation values of BM compartments relative to HSCs at 2 and 26 months of age. Paired Student t test of correlation coefficient of cells vs HSCs indicate that the correlations are significantly reduced with age (P = .03) (see also supplemental Figure 3B). Source data are provided in supplemental Table 1.
To address this in vivo, we again examined the behavior of “pooled” clones labeled with the same Confetti color. A similar distribution of Confetti colors among distinct BM compartments in individuals reflects a close lineage relationship. For example, when one examines the BM of Conf-E2aCre mouse #6 or Conf-VavCre mouse #5 at 26 months, HSCs and MPPs displayed a similar distribution of Confetti colors relative to downstream HSPCs (Figure 3B). To globally analyze these patterns, we calculated the correlation (Pearson correlation coefficient) in the percent contribution of each Confetti color to different cell lineages in young and old mice (Figure 3C). The correlation between lineages declined with age (see color intensity in Figure 3Ci-ii). Remarkably, the correlation between HSCs and MPPs was less eroded with age compared with the correlation of HSCs with other HSPCs (Figure 3Ciii). Additionally, the pattern of correlation among different lineages in young mice was similar in aged mice (see the color pattern in Figure 3Cii and supplemental Figure 3B where the scale is modified in young mice to facilitate comparison). These data suggest that HSCs continuously produce MPPs throughout life and that aging increases the functional heterogeneity of the HSC pool, which is reflected in the eroded correlations between HSCs and other BM compartments (P = .03).
Aging constrains HSC-repopulating activity
To further investigate the effect of aging on HSC self-renewal and function, we repeatedly challenged aged HSCs by serially transplanting Conf-VECre-BM into irradiated recipients (Figure 4; supplemental Figure 4). Here, BM from 3 independent young and aged donors was independently serially transplanted into a total of 6 cohorts of mice: young BM (groups A-C) and aged BM (groups D-F) (Figures 5 and 6; supplemental Figure 5). Thus, all Confetti+ BM within each group ultimately derives from the same primary donor.
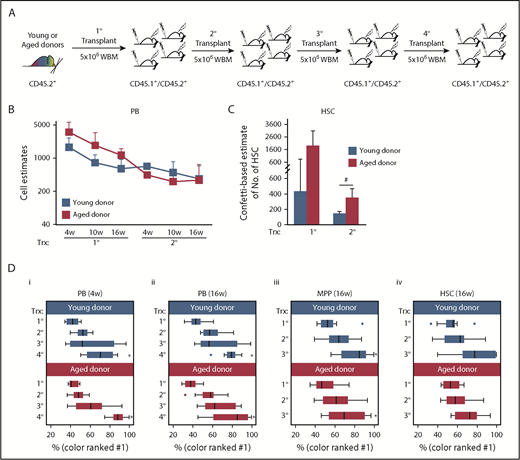
Serial transplantation of aged and young BM results in a loss of clonal complexity. (A-D) CD45.2+Conf-VECre BM was serially transplanted. (A) Schematic of serial transplantation of CD45.2+Conf-VECre BM. For primary transplant, 5 × 10⁶ BM cells were transplanted from young (age 2 months) or old (age 24 months) donors into distinct cohorts of primary CD45.2+/CD45.1+ recipients. For serial transplants, 5 × 10⁶ BM cells were transplanted. For each age group (young and old), at least 3 independent donor mice were transplanted into distinct recipient cohorts. Each cohort was composed of at least 5 mice and was transplanted with an independent donor. (B) Recipient PB was analyzed for the distribution of Confetti colors in their PB at 4, 10, and 16 weeks posttransplant. MtMV was used to estimate the number of repopulating units (see “Methods”). Primary and secondary transplants are shown (see supplemental Figure 4 for additional cell doses transplanted in primary transplants and PB lineages; see also Figure 5). (C) Recipient BM HSCs were examined at 4 months posttransplant for the MtMV in the Confetti colors (see supplemental Figure 6D for additional BM HSPC compartments). (B-C) Averages are shown; error bars denote standard deviation (*P < .05; #P < .1) (D) The median frequency of the most prevalent color is shown for the PB at 4 weeks (i) and 16 weeks (ii) and for MPPs (iii) and HSCs (iv) at 16 weeks for each transplantation stage. Whisker plots show interquartile range. Analysis of variance was run to test for the statistical significance of the transplantation stage and age for each cell type. Age did not result in statistical differences for any cell type. Transplantation stage had a significant effect in all cell types (P < .05) except HSCs (*P < .05). (B-D) Each bar or point represents the average or median obtained from at least 3 independent cohorts of mice (each cohort n ≥ 5) from 3 independent initial young or old donors. Source data are provided in supplemental Table 1. Trx, transplant; WBM, whole bone marrow.
Serial transplantation of aged and young BM results in a loss of clonal complexity. (A-D) CD45.2+Conf-VECre BM was serially transplanted. (A) Schematic of serial transplantation of CD45.2+Conf-VECre BM. For primary transplant, 5 × 10⁶ BM cells were transplanted from young (age 2 months) or old (age 24 months) donors into distinct cohorts of primary CD45.2+/CD45.1+ recipients. For serial transplants, 5 × 10⁶ BM cells were transplanted. For each age group (young and old), at least 3 independent donor mice were transplanted into distinct recipient cohorts. Each cohort was composed of at least 5 mice and was transplanted with an independent donor. (B) Recipient PB was analyzed for the distribution of Confetti colors in their PB at 4, 10, and 16 weeks posttransplant. MtMV was used to estimate the number of repopulating units (see “Methods”). Primary and secondary transplants are shown (see supplemental Figure 4 for additional cell doses transplanted in primary transplants and PB lineages; see also Figure 5). (C) Recipient BM HSCs were examined at 4 months posttransplant for the MtMV in the Confetti colors (see supplemental Figure 6D for additional BM HSPC compartments). (B-C) Averages are shown; error bars denote standard deviation (*P < .05; #P < .1) (D) The median frequency of the most prevalent color is shown for the PB at 4 weeks (i) and 16 weeks (ii) and for MPPs (iii) and HSCs (iv) at 16 weeks for each transplantation stage. Whisker plots show interquartile range. Analysis of variance was run to test for the statistical significance of the transplantation stage and age for each cell type. Age did not result in statistical differences for any cell type. Transplantation stage had a significant effect in all cell types (P < .05) except HSCs (*P < .05). (B-D) Each bar or point represents the average or median obtained from at least 3 independent cohorts of mice (each cohort n ≥ 5) from 3 independent initial young or old donors. Source data are provided in supplemental Table 1. Trx, transplant; WBM, whole bone marrow.

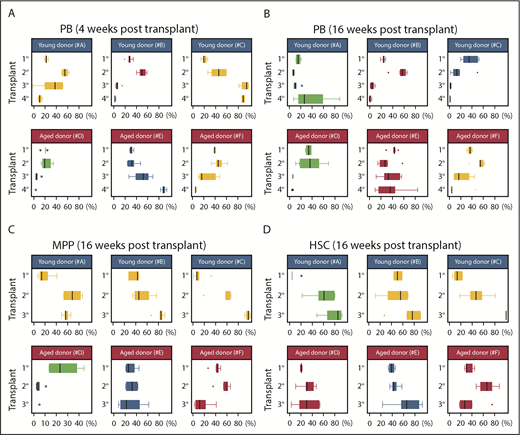
Serial transplantation of aged and young BM drives clonal collapse of reconstituted hematopoiesis. (A-B) Pie graphs show the distribution of Confetti colors in the nucleated cells of the PB, MPPs, and HSCs of each recipient. Each pie graph represents an independent mouse. Each column of pie charts refers to the same mouse. Vertical arrows indicate donor mice for the subsequent transplant. Results are shown at 4 and 16 weeks posttransplant. (A) Serial transplantation from young primary BM donors. (B) Serial transplantation from old primary BM donors. Data related to Figure 4A-C. Source data are provided in supplemental Table 1. Data for HSCs and MPPs at the quaternary stage are not shown as they were used for WES.
Serial transplantation of aged and young BM drives clonal collapse of reconstituted hematopoiesis. (A-B) Pie graphs show the distribution of Confetti colors in the nucleated cells of the PB, MPPs, and HSCs of each recipient. Each pie graph represents an independent mouse. Each column of pie charts refers to the same mouse. Vertical arrows indicate donor mice for the subsequent transplant. Results are shown at 4 and 16 weeks posttransplant. (A) Serial transplantation from young primary BM donors. (B) Serial transplantation from old primary BM donors. Data related to Figure 4A-C. Source data are provided in supplemental Table 1. Data for HSCs and MPPs at the quaternary stage are not shown as they were used for WES.
Labeled pooled clones revealed clonal instability during serial transplantation. The average frequency of CFP-, YFP-, RFP-, or GFP-labeled pooled clones in the PB at 4 (A) and 16 (B) weeks and in MPPs at 16 weeks (C) and HSCs (D) at 16 weeks throughout transplantation. Results are shown for each transplanted group (#A-F). Related to Figure 5. Whisker plots show the interquartile range; n ≥ 5 for each transplanted mouse cohort (see supplemental Figure 5 for the distribution of all pooled clones). Source data are provided in supplemental Table 1.
Labeled pooled clones revealed clonal instability during serial transplantation. The average frequency of CFP-, YFP-, RFP-, or GFP-labeled pooled clones in the PB at 4 (A) and 16 (B) weeks and in MPPs at 16 weeks (C) and HSCs (D) at 16 weeks throughout transplantation. Results are shown for each transplanted group (#A-F). Related to Figure 5. Whisker plots show the interquartile range; n ≥ 5 for each transplanted mouse cohort (see supplemental Figure 5 for the distribution of all pooled clones). Source data are provided in supplemental Table 1.
Our Confetti-based approach faithfully estimates PB repopulating units (RUs) at short and long time points posttransplant.23 In primary transplants, many short-term progenitors contributed to recipient PB regardless of donor age at 4 weeks posttransplant23,38-40 (Figure 4B). RU numbers decreased over time as these progenitors exhausted their reconstituting potential for all PB lineages23,38-40 (Figure 4B; supplemental Figure 4A-B). Counterintuitively, PB RUs trended higher in recipients of aged BM vs recipients of young BM (Figure 4B; supplemental Figure 4A). Consistently, reconstituted HSCs of aged BM recipients displayed greater clonal complexity than recipients of young BM (Figure 4C). Phenotypic HSCs are known to accumulate in aged BM.26,27,41-44 Indeed, a 10-fold increase in phenotypic HSC numbers was apparent in aged Conf-VECre mice relative to young mice (supplemental Figure 6A). Thus, the repopulating activity of phenotypic aged HSCs appears approximately one-half that of young HSCs (ratio of estimated RUs divided by the HSC number), consistent with previous reports (supplemental Figure 6B).45,46 Thus, although the phenotypic HSC compartment expands with age, its activity is compromised relative to young HSCs and many more aged clones are recruited to reconstitute homeostasis.
Serial transplantation dramatically reduces clonal diversity
Continued serial transplantation of aged and young BM reproducibly resulted in the dominance of a single Confetti color in reconstituted PB (Figure 5), suggesting oligoclonality. Accordingly, in secondary transplants of aged and young Conf-VECre-BM, we observed a loss of clonal diversity in the CD45.2+ PB (including myeloid and lymphoid lineages) and HSPCs (Figure 4B-C; supplemental Figure 4B).
As the Confetti formula cannot accurately estimate the clonal complexity of an oligoclonal system,23 we developed an alternate strategy to quantify this progressive loss of complexity in subsequent transplants, focusing on the frequency of the most prevalent color as an indicator of clonal diversity expressed as percentage of total (Figure 4D; supplemental Figure 4C). There was no difference in the rate that young and old serially transplanted BM achieved clonal dominance in the HSCs, MPPs, and myeloid compartments (Figure 4D; supplemental Figure 4C). The differences observed in B- and T-cell lineages are probably due to the earlier myeloid bias developed by the aged BM and that depletes the aged BM from the lymphoid lineages, precluding a proper comparison (supplemental Figures 4C and 6C). Thus, serial transplantation steadily and dramatically reduces the clonal diversity of transplanted BM, regardless of the age of the primary donor.
Serial transplantation exacerbates clonal instability
To examine the flux of HSC output during serial transplantation, we again analyzed the behavior of “Confetti-pooled clones” in individual mice (Figure 5). Dramatic expansions and constrictions of PB-pooled clones were apparent throughout serial transplantation of young BM (YFP and RFP in groups A and B in Figures 5 and 6A-B; supplemental Figures 5Ai-ii and 3Di-ii). Furthermore, in group A, GFP-pooled clones steadily increased in frequency in HSCs during serial transplantation (Figures 5 and 6D; supplemental Figure 5Biv). In contrast, the sudden expansion of GFP-pooled clones in the tertiary and quaternary PB of group B recipients was never apparent in recipient HSCs and MPPs (Figure 5; supplemental Figure 5B). For example, the secondary group B recipient whose BM was transplanted into tertiary recipients had predominantly CFP+ HSCs. However, the frequency of these CFP-pooled clones constricted dramatically in tertiary recipient PB by 16 weeks posttransplant and were a minority fraction in tertiary HSCs, which was overtaken by YFP-pooled clones (Figure 5). In groups D-F (Figure 5), which were serially transplanted with aged BM, large expansions of GFP-pooled clones were mostly followed by constrictions (Figures 5 and 6B; supplemental Figure 5B). This supports the presence of small HSC clones with large contribution to PB. For example, the distribution of PB-pooled clones in groups D-F secondary recipients were not reflected in their MPPs and HSCs (Figure 5; supplemental Figure 5). In total, these data suggest PB and HSC clonal instability during serial transplantation.
Serially transplanted aged BM bears a heavier mutation load than serially transplanted young BM
Confetti labeling suggests that serial transplantation of BM results in a loss of clonal complexity (Figure 4). By quaternary transplants, the majority of reconstituted blood is only 1 or 2 Confetti colors (Figure 5). To confirm clonal hematopoiesis, we performed WES on CD45.2+ BM labeled with individual Confetti colors (ie, Confetti clones) isolated by fluorescence-activated cell sorting (FACS) from quaternary recipients of CD45.2+ Conf-VECre aged or young BM. Eleven Confetti clones were sequenced: 4 isolated from recipients of young BM (groups A-B) and 7 from recipients of aged BM (groups D-F) (Figures 5 and 7; Table 1; supplemental Tables 2 and 3). To ensure identification of true somatic mutations, at least 2 Confetti clones labeled with different colors were isolated from each transplant group. Because Confetti clones in each group originate from the same initial donor, somatic mutations acquired either during aging or serial transplantation can be distinguished from polymorphisms by comparing independent Confetti clones within a group.
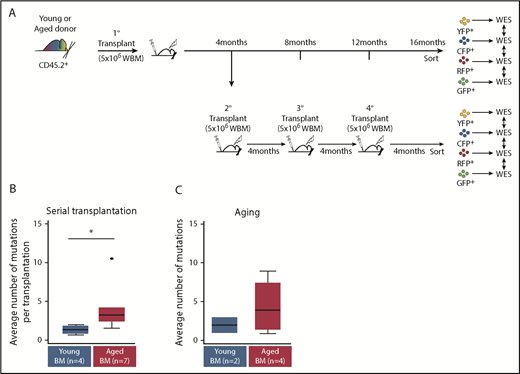
Aged Confetti clones exhibit higher mutational rates than young Confetti clones. Transplanted Conf-VECre BM from aged or young donors was either maintained for 16 months in primary recipients or serially transplanted every 4 months for a total of 16 months. Confetti-sorted clones were subjected to WES. (A) Experimental schematic. (B) WES of aged (n = 7) and young (n = 4) sorted Confetti clones after serial transplantation. Mutation analysis revealed that aged clones accumulated a significantly higher number of mutations than young clones when serially transplanted (*P < .05). (C) WES of aged (n = 4) and young (n = 2) sorted Confetti clones 16 months postprimary transplant. No overlap was observed in mutations detected after primary transplant compared with repeated transplantation (please see supplemental Tables 2 and 3). (B) See Table 1 and “Methods” for experimental details.
Aged Confetti clones exhibit higher mutational rates than young Confetti clones. Transplanted Conf-VECre BM from aged or young donors was either maintained for 16 months in primary recipients or serially transplanted every 4 months for a total of 16 months. Confetti-sorted clones were subjected to WES. (A) Experimental schematic. (B) WES of aged (n = 7) and young (n = 4) sorted Confetti clones after serial transplantation. Mutation analysis revealed that aged clones accumulated a significantly higher number of mutations than young clones when serially transplanted (*P < .05). (C) WES of aged (n = 4) and young (n = 2) sorted Confetti clones 16 months postprimary transplant. No overlap was observed in mutations detected after primary transplant compared with repeated transplantation (please see supplemental Tables 2 and 3). (B) See Table 1 and “Methods” for experimental details.
Mutations identified that altered amino acid sequences
| Symbol | Reference | Allele | Coding/amino acid change | Group | Mutation type | Conserved region in human genome† | Predicted functional effect‡ |
|---|---|---|---|---|---|---|---|
| Csmd1 | C | T | NM_053171:c.5755G>A,p.Ala1919Thr | Young | Missense | No | N/A |
| Lmln | C | T | NM_172823:c.1597C>T,p.Gln533* | Young | Nonsense | Yes | Damaging |
| Mrgpra6 | G | A | NM_001308537:c.799C>T,p.Arg267Trp | Young | Missense | No | N/A |
| Sidt2 | G | C | NM_172257:c.[1062C>G],p.[Tyr354*] | Young | Nonsense | Yes | Stop gain |
| Slc5a9 | C | T | NM_145551:c.298G>A,p.Gly100Ser | Young | Missense | Yes | Damaging |
| Ahnak | C | T | NM_009643:c.[3092C>T],p.Pro1031Leu | Old | Missense | Yes | Damaging |
| Bcl11b§ | G§ | A§ | NM_021399:c.610C>T,p.Gln204*§ | Old | Nonsense§ | Yes | Damaging |
| Carm1 | A | G | NM_021531:c.[1441A>G],p.[Thr481Ala] | Old | Missense | Yes | Benign |
| Cdr1 | G | A | NM_001166658:c.892C>T,p.Arg298Trp | Old | Missense | No | N/A |
| Hist1h2ac§ | G§ | A§ | NM_178189:c.97C>T,p.Arg33Trp§ | Old | Missense§ | Yes | Damaging |
| Grin3a | A | — | NM_001033351:c.[1797delT],p.[Ile599fs] | Old | Deletion | Yes | Frameshift |
| Itpkb | A | G | NM_001081175:c.2521A>G,p.Lys841Glu | Old | Missense | Yes | Benign |
| Notch3§ | C§ | T§ | NM_008716:c.668G>A,p.Cys223Tyr§ | Old | Missense§ | Yes | Damaging |
| Npy2r§ | G§ | A§ | NM_008731:c.244C>T,p.Arg82Cys§ | Old | Missense§ | Yes | Damaging |
| Olfr1111 | G | T | NM_146593:c.20C>A,p.Thr7Asn | Old | Missense | Yes | Probably damaging |
| Pde6a | G | A | NM_146086:c.161G>A,p.Ser54Asn | Old | Missense | Yes | Benign |
| Prb1 | G | T | NM_053251:c.702C>A,p.Asp234Glu | Old | Missense | No | N/A |
| Ptprr§ | C§ | T§ | NM_011217:c.1135C>T,p.Arg379Trp§ | Old | Missense§ | Yes | Damaging |
| Rapgef1 | G | A | NM_001039086:c.2164G>A,p.Glu722Lys | Old | Missense | No | N/A |
| Rnf6 | C | T | NM_028774:c.1003G>A,p.Val335Ile | Old | Missense | No | N/A |
| Scn2a | A | C | NM_001099298:c.5480A>C,p.Asp1827Ala | Old | Missense | Yes | Benign |
| Tada1 | T | G | NM_030245:c.803T>G,p.Leu268Arg | Old | Missense | Yes | Benign |
| Tjp1 | A | G | NM_009386:c.4991T>C,p.Ile1664Thr | Old | Missense | Yes | Benign |
| Top2b§ | G§ | —§ | NM_009409:c.1487delG,p.Gly497fs§ | Old | Deletion§ | Yes | Frameshift |
| Vmn2r49 | G | A | NM_001105156:c.647C>T,p.Pro216Leu | Old | Missense | No | N/A |
| Zcwpw1 | G | A | NM_001005426:c.34G>A,p.Glu12Lys | Old | Missense | No | N/A |
| Zfp735 | G | T | NM_001126489:c.510G>T,p.Lys170Asn | Old | Missense | No | N/A |
Gene identifier, nucleotide change, amino acid change, age group, type of mutation, conservation in human sequence, and predicted functional consequences in the protein function are indicated.
—, base pair deletion; N/A, not applicable.
Homologous region was identified in human protein.
Predicted based on Polyphen-2 tool.
Mutated genes with predicted damaging consequences.
WES revealed 27 mutations (23 missense and 4 nonsense) that change the amino acid sequences (Table 1; supplemental Tables 2 and 3). Five aged Confetti clones (O-1, O-3, O-4, O-7, O-11) acquired mutations with variant allele frequencies (VAFs) close to 50%, consistent with monoclonal hematopoiesis (supplemental Table 3). For example, virtually all cells in O-4 carried a Cdr1 mutation (VAF = 53%), yet this variant was not observed in O-3, which received cells from the same primary donor. Interestingly, O-4 also harbored a subclone, as one-half of the sample carried an Npy2r mutation (VAF = 25.9%) (supplemental Table 3). Two aged Confetti clones (O-2, O-6) were oligoclonal (eg, O-2 was composed of at least 2 clones [VAFs = 10.4% and 14.9%]) (supplemental Table 3). Two of 4 young Confetti clones (Y-2 and Y-3) were clonal (VAF = 44% for each) or oligoclonal (Y-1, subclones were detected with VAFs = 16.7% and 13.9%; supplemental Table 3). Interestingly, the average counts of sample-specific mutations per transplant event (including missense, nonsense, silent and those outside the coding regions) in aged Confetti clones (4.2 mutations per transplant event) exceeded those of young Confetti clones (1.4 mutations per transplant event; P = .02; Figure 7A). These data suggest that most mutations are acquired during aging or alternatively that aged HSCs are more susceptible to mutagenesis under repeated stress.
To distinguish between these possibilities, we performed WES on Confetti-labeled young or aged BM isolated from primary recipients 16 months posttransplant or quaternary recipients 4 months posttransplant that were transplanted with cells from the same primary donor (Figure 7B). Comparing these primary and quaternary samples allowed us to assess the effect of time and time plus repeated serial transplantation. If the observed mutations accumulated during the aging prior to transplant, then similar mutations should be observed in both cases. Clones of the same Confetti color within each transplant group (2 young clones (Y-5 and Y-6) and 4 aged clones (O-5, O-8, O-9, and O-10) were sequenced (supplemental Table 2). WES showed no overlap in mutations detected in primary vs quaternary samples (supplemental Table 2). These data support a model in which most quaternary mutations are acquired during serial transplantation and aged BM is more susceptible to mutation during intense hematopoietic stress. Alternatively, small undetectable clones in primary samples may have been favored by serial transplantation.
We assessed whether detected mutations were previously identified as variants in hematologic disease or cancer using Pecan Pathogenicity Information Exchange (PIE) (https://pecan.stjude.cloud/pie).47 A nonsense mutation in the B-cell chronic lymphocytic leukemia/lymphoma 11b (Bcl11b) locus (c. 610 C>T transition) has been implicated in T-cell acute lymphoblastic leukemia (T-ALL) leukemogenesis. Low BCL11b expression correlates with poor prognosis in T-ALL patients.48-50 We also identified a missense damaging mutation (Cys223Tyr) in a conserved, putative Ca+2-binding domain of the Notch3 locus (Cys222 in the human protein).51-53 Elevated NOTCH3 is seen in most T-ALL cases (Table 1; supplemental Table 3).54 A C>T transition resulted in p379Arg→Trp in protein tyrosine phosphatase receptor type (Ptprr). Eleven PTPRR R376 mutations have been reported in carcinomas and melanomas.47 In addition, a C>T transition observed in the neuropeptide Y receptor Y2 (Npy2r) has also been seen in carcinoma patients (Arg82Cys).47,55 A G>A transversion in the histone cluster 1, H2ac (Hist1h2ac), leading to an Arg33Trp was also observed. Reduced expression of Hist1h2ac correlates with increased cell proliferation.56,57 Finally, we observed a frameshift deletion in topoisomerase (DNA) II β (Top2b), a target for several anticancer drugs.58,59
In sum, WES of young and aged Confetti clones confirmed oligoclonal hematopoiesis and suggest that aged HSCs may be hypersensitive to mutation when subjected to hematopoietic stress.
Discussion
We comprehensively examined the global clonal complexity of the murine hematopoietic system throughout life during steady-state hematopoiesis. Although the presence of overrepresented clones in aged PB is known, we showed for the first time that aging correlates with a global loss of clonal diversity in the entire blood system. These data caution against the use of aged donors for HSC transplantation. We also visualized the dynamics of clonal instability during native hematopoiesis and extended previous reports on aged HSC clones.15 Our study further illuminated that serial transplantation drives a collapse of hematopoietic clonal complexity in reconstituted blood. Finally, we identified mutations that may confer a selective advantage during hematopoietic stress.
Here, we used a novel, noninvasive approach that depends on the observed MtMV in Confetti color distribution in cell populations. We previously validated the fidelity of this approach for estimating clonal numbers and reconstituting events in the blood system both during ontogeny and transplantation.23 The behavior of individual clones is not tracked in this approach. Rather, much like classic limiting dilution transplantation assays based on Poisson statistics,34,60 MtMV is a statistical, indirect measure of clonal content and populations. Thus, an important caveat is that if a cell population consistently contains clones too small to perturb the distribution of Confetti colors in individual mice, those clones are essentially “hidden” from MtMV measurements. However, this caveat can be mitigated by increasing the size of mouse cohorts and numbers of cells analyzed. Furthermore, with respect to aged HSCs, these small “hidden” clones can reflect important biology, which is discussed at length below. MtMV is also influenced by cellular behavior (ie, changes in the number of clones actively contributing to blood compartments). Many variables can influence the behavior of cells overtime (eg, stress, infection, inflammation, epigenetic remodeling). Behavioral changes with age reflect the cumulative effect of these many variables on cells (and systems) throughout life. Here, we applied the MtMV in Confetti color distribution to measure the sum total effect of these insults on the blood and observed a loss of actively contributing clones in most blood compartments (Figure 1; supplemental Figure 1). Further experimentation will be necessary to decipher the biology driving changes in active clone numbers in aged blood.
Aging is accompanied by a large expansion in phenotypic HSCs (supplemental Figure 6A)26,27,41-44 and a 20-fold decrease in transplantable HSCs (supplemental Figure 6B).8,36-40,53,55,56,61 The precipitous drop in HSC clonal complexity with age suggests that the expansion of phenotypic HSCs results from just a few clones with a selective advantage, as suggested for CHIP.1,8 Furthermore, this loss of HSC complexity does not correlate in magnitude with the loss of clonal complexity seen in PB (Figure 4B-C; supplemental Figure 1D). As aged HSCs display poor repopulating activity relative to young HSCs (supplemental Figure 6B),61 they are likely also compromised in their contribution to native hematopoiesis. Indeed, the BM frequency of expanded aged HSCs Confetti pools is often not reflected in the blood, suggesting compromised output. We repeatedly observed aged PB GFP-pooled clones that were undetectable in BM (eg, Conf-E2aCre #4, Conf-Flk1Cre #6, Conf-VECre #6, Conf-Vav1Cre #6; Figure 3B), consistent with the model that small “young-like” HSC clones actively support aged PB, as proposed by de Haan and Lazare.8 Although, in our study, we cannot measure the precise composition of clonal pools. Nonetheless, very likely, only HSC clones that have not expanded dramatically preserve their functional potential, and aged native hematopoiesis is maintained by a reduced pool of HSC clones.8,62 Thus, although PB complexity drops with age, this drop is not equivalent to that seen in HSCs. The pathological significance of harboring large numbers of phenotypic HSCs compromised in differentiative potential is unclear. This may contribute to the selection of PB clones in elderly CHIP patients.
Our study complements a recent report estimating that ∼50 000 to 200 000 HSCs contribute to the blood at any given moment in middle-aged individuals.63 Sixteen- to 20-month-old mice are equivalently middle-aged and did not display a loss of PB clonal complexity (Figure 1C). It would be interesting to assess whether the 30% drop in complexity seen in our study is conserved in an elderly individual (>80 years). However, this may be difficult to detect, given the large range of contributing HSCs reported in Lee-Six et al.63
HSCs are heterogeneous.36,42,64-67 Aging is accompanied by delay in HSC cell division ex vivo, as previously described,68 and a loss of multipotency (Figure 3A), which suggests a global decline in HSC function. This decline could stem from increasing HSC functional heterogeneity or from a homogeneous loss of HSC function. Reduced correlation in Confetti-labeling patterns between BM HSPCs with age supports a model of increased heterogeneity (Figure 3C). To preserve Confetti color distribution between 2 BM compartments: (1) the immature compartment must evenly contribute to the downstream compartment, (2) cell expansion and death must be evenly distributed across compartments, and (3) these requirements must hold for any intermediates. Deviation from these requirements would weaken Confetti color correlations between compartments (ie, functional heterogeneity in HSPCs negatively impacts the preservation of Confetti color distribution between populations). Thus, we favor a model in which aging increases HSC functional heterogeneity (Figure 3A,C).
Interestingly, HSCs and MPPs were highly correlated in aged mice (Figure 3Cii-iii). It has been proposed that MPPs support native hematopoiesis with rare contribution from HSCs,19,20 which suggests that aged MPPs emerge from HSCs early in life or that HSCs steadily (but rarely) contribute to MPPs. This would also require MPPs and HSCs to preserve identical relative rates of symmetric and asymmetric cell division throughout life (ie, to preserve Confetti color distributions after a long separation). A simpler model is that HSCs actively and evenly generate MPPs throughout life, consistent with the classic model of hematopoieisis.21
We also examined the effect of age and stress on HSC function. Primary transplantation of aged BM resulted in recruitment of larger clone numbers than young BM to reestablish hematopoietic homeostasis (Figure 4B-C; supplemental Figure 6D), likely because aged HSCs display less repopulating activity per cell than young HSCs. Repeated serial transplantation drove a clonal collapse of the blood in recipients of both aged and young BM (Figures 4-6). Our data highlight significant differences between native and stress hematopoiesis (Figures 1, 4, and 5; supplemental Figures 1D and 4). Stress (ie, transplantation) dramatically impacts the diversity of clones contributing to hematopoiesis (Figures 4 and 5; supplemental Figure 4). Although clonal complexity also falls during native hematopoiesis (Figure 1; supplemental Figure 1D), this loss is more gradual and smaller in magnitude than that seen posttransplant. Thus, to fully appreciate hematopoietic clonal dynamics, it is critical to interrogate both native and stress hematopoiesis.
We identified mutations in 6 genes (ie, Bcl11b, Hist1h2ac, Npy2r, Notch3, Ptprr, and Top2b) that may confer a selective advantage to HSCs during aging and/or serial transplantation (Table 1; supplemental Table 3). Bcl11b regulates thymocyte development.48,49 Structural variants and mutations in BCL11B have been seen in acute myeloid leukemia, pediatric and adult T-ALL, and T/myeloid acute bilineage leukemia.51,69-79 PTPRR is a protein tyrosine phosphatase linked to colorectal and cervical cancer.80-82 NOTCH3 mutations have been causally linked to cerebral autosomal-dominant arteriopathy.83 High levels of NOTCH3 are detected regularly in T-ALL.54,84 Variations in the levels of HIST1H2AC might contribute to carcinogenesis.56,57 TOP2B is a DNA topoisomerase that alleviates topological stress during DNA replication and transcription.85 TOP2B mutations correlate with drug resistance and chromosome translocations in therapy-induced leukemia.58,59,86-89 Finally, Npy2r (a G-protein–coupled receptor) regulates memory.90,91 We did not detect the most frequent mutations in CHIP patients (eg, Dnmt3a, Asxl1, Tet2; total frequency, ≈30%). This could simply be due to the small number of clones interrogated in our study.6,7
In summary, our noninvasive approach constitutes, to our knowledge, the first study of the dynamics of the absolute clonal complexity of steady-state hematopoiesis during a natural mammalian lifespan. Here, aging resulted in a global loss of clonal complexity, and intense repeated hematopoietic stress compromised HSC self-renewal, regardless of age, ending in clonal collapse and loss of lymphoid potential. Moreover, we identified novel mutations that potentially select for HSCs capable of extensive self-renewal in the face of hematopoietic stress. Understanding the functional significance of these mutations could shed light on similar processes in human clonal hematopoiesis and warrants further investigation.
For original data, please contact shannon.mckinney-freeman@stjude.org.
The online version of this article contains a data supplement.
The publication costs of this article were defrayed in part by page charge payment. Therefore, and solely to indicate this fact, this article is hereby marked “advertisement” in accordance with 18 USC section 1734.
Acknowledgments
The authors thank W. Clements, J. Klco, E. Obeng, A. Morales, and the rest of the McKinney-Freeman laboratory and Department of Hematology at St. Jude Children’s Research Hospital for critical discussions and reading of the manuscript; D. Ashmun, S. Schwemberger, and J. Laxton for FACS support; and C. Davis-Goodrum, Krista Millican, Amber Reap, and C. Savage for help with injections and timed pregnancies. Vav1-Cre+/T mice were a gift from the laboratory of Thomas Graf (Center for Genomic Regulation, Barcelona, Spain) by way of Nancy Speck (University of Pennsylvania, Philadelphia, PA). VE-Cadherin-Cre+/T mice were a gift from the laboratory of Guillermo Oliver (Northwestern University, Evanston, IL).
This work was supported by the American Society of Hematology (S.M.-F.), the Hartwell Foundation (S.M.-F.), the National Institutes of Health, National Institute of Diabetes and Digestive and Kidney Diseases (R01DK104028 [S.M.-F.]), and the American Lebanese Syrian Associated Charities (S.M.-F.).
Authorship
Contribution: M.G. designed the study, performed and analyzed transplants, collected and analyzed data, and wrote the paper; T.H. contributed to study design, collected data, and wrote the paper; D.F. performed statistical analysis for estimating cell numbers and tracking clonal complexity evolution, analyzed data, contributed to study design, and wrote relevant sections of the paper; A.C. analyzed Confetti+ blood and resulting data; Y.-D.W. and G.W. performed WES analysis; G.K. and W.B. performed statistical analyses; S.M.-F. designed the study, analyzed data, and wrote the paper; and all authors discussed the results and commented on the manuscript.
Conflict-of-interest disclosure: The authors declare no competing financial interests.
Correspondence: Shannon McKinney-Freeman, St. Jude Children’s Research Hospital, 262 Danny Thomas Pl, Memphis, TN 38105-3678; e-mail: shannon.mckinney-freeman@stjude.org.

This feature is available to Subscribers Only
Sign In or Create an Account Close Modal