

Abstract
Single-cell transcriptomics has recently emerged as a powerful tool to analyze cellular heterogeneity, discover new cell types, and infer putative differentiation routes. The technique has been rapidly embraced by the hematopoiesis research community, and like other technologies before, single-cell molecular profiling is widely expected to make important contributions to our understanding of the hematopoietic hierarchy. Much of this new interpretation relies on inference of the transcriptomic landscape as a representation of existing cellular states and associated transitions among them. Here we review how this model allows, under certain assumptions, charting of time-resolved differentiation trajectories with unparalleled resolution and how the landscape of multipotent cells may be rather devoid of discrete structures, challenging our preconceptions about stem and progenitor cell types and their organization. Finally, we highlight how promising technological advances may convert static differentiation landscapes into a dynamic cell flux model and thus provide a more holistic understanding of normal hematopoiesis and blood disorders.
Introduction
Hematopoiesis research spanning >150 years has been significantly driven by technological breakthroughs. Microscopy-based observations in the 19th century established that blood is composed of 2 bone marrow–derived cell lineages: myeloid and lymphoid, perhaps sharing a common stem cell origin.1 It was not until the 1950s when bone marrow transplantation rescue of lethally irradiated mice2-4 confirmed this hypothesis. Subsequently, in vitro hematopoietic colony assays provided functional evidence for intermediate stages between hematopoietic stem cells (HSCs) and terminally differentiated cells,5 ranging from multipotent (MPP) to unipotent progenitor cells. These findings arose from the shadow cast by the destructive effects of radiation on the blood system after the first use of nuclear weapons in the 1940s,6 with the first successful human bone marrow transplantation reported in 1959.7,8 This approach remains the only curative therapy for a number of hematopoietic malignancies to this date.9 Although these practical applications were developed early on, our biological understanding of hematopoiesis lagged behind until isolation of specific cell populations became possible.
A critical advance came from the related field of immunology, allowing the sorting of individual cells10 and generation of monoclonal antibodies to detect surface markers.11 At this stage, a key achievement of the hematopoietic community had begun to take form, with the establishment of the differentiation tree. By the end of the 20th century, the hematopoietic tree was rooted in long-term HSCs (LT-HSCs), followed by short-term HSCs (ST-HSCs) and MPPs, partitioned according to their ability to repopulate blood in transplantation assays over diminishing periods of time.12-16 These cells were proposed to differentiate through a set of bifurcations that produced distinct progenitor cell populations with decreasing lineage potential and self-renewal activity (Figure 1A). In the past 2 decades, this model has been subjected to constant extensions and refinements, largely because of new evidence highlighting cellular heterogeneity obtained from single-cell assays. At the same time, cell barcoding approaches have mediated clonal tracking of native hematopoiesis17-19 and stressed the importance of gaining insight into the unperturbed tissue state. The resulting evolution of the hematopoietic tree has been discussed in detail elsewhere.6,15,20,21

Comparison of a hematopoietic tree diagram with a single-cell transcriptomic landscape. (A) Schematic showing one of the classic views of the hematopoietic cell hierarchy. Dashed boxes show 3 compartments encompassing cells of different potency: multipotent cells on top, bipotent/oligopotent cells in the middle, and terminally differentiated (unipotent) cells at the bottom. (B) A dimensionality reduction projection (UMAP algorithm) of single-cell transcriptomes from the bone marrow mononuclear cell fraction. Arrows indicate main directions of differentiation, inferred from analysis of typical marker genes. Gray indicates unassigned cells, in which identity based on markers is unclear (data set downloaded from Human Cell Atlas data portal and processed by I.K.). CMP, common myeloid progenitor; CLP, common lymphoid progenitor; GMP, granulocyte-monocyte progenitor; HSPC, hematopoietic stem and progenitor cell; LMPP, lymphoid-primed MPP; MEP, megakaryocyte-erythroid progenitor; Mk, megakaryocyte.
Comparison of a hematopoietic tree diagram with a single-cell transcriptomic landscape. (A) Schematic showing one of the classic views of the hematopoietic cell hierarchy. Dashed boxes show 3 compartments encompassing cells of different potency: multipotent cells on top, bipotent/oligopotent cells in the middle, and terminally differentiated (unipotent) cells at the bottom. (B) A dimensionality reduction projection (UMAP algorithm) of single-cell transcriptomes from the bone marrow mononuclear cell fraction. Arrows indicate main directions of differentiation, inferred from analysis of typical marker genes. Gray indicates unassigned cells, in which identity based on markers is unclear (data set downloaded from Human Cell Atlas data portal and processed by I.K.). CMP, common myeloid progenitor; CLP, common lymphoid progenitor; GMP, granulocyte-monocyte progenitor; HSPC, hematopoietic stem and progenitor cell; LMPP, lymphoid-primed MPP; MEP, megakaryocyte-erythroid progenitor; Mk, megakaryocyte.
We are currently witnessing another single-cell revolution, in which vast transcriptomic data sets are transforming our understanding of hematopoiesis. As a result, the idea of cellular transitions between discrete progenitor states as they differentiate has become difficult to accommodate.20 Instead, multiple studies have proposed the idea of continuous differentiation landscapes, with little or no discrete differentiation stages and smooth transitions across the cell states. In this context, cells within a heterogeneous pool of HSPCs differentiate along a multitude of potential trajectories that contain poorly defined branch points, which determine the fate of a particular cell. In this review, we aim to highlight recent biological insights gained into the nature of these landscapes using single-cell RNA sequencing (scRNA-seq) and downstream computational tools.
scRNA-seq: opportunities and limitations
Although single-cell quantification of gene expression for small numbers of genes was achieved in the early 1990s,22 it is because of breakthroughs in parallelization in the past few years that single-cell transcriptomics is now chasing its conceptual predecessors flow and mass cytometries in terms of throughput.23 However, unlike flow or mass cytometry measurements, which are typically restricted to at most a few dozen predefined markers, scRNA-seq can measure expression of up to 104 genes simultaneously in each cell, thus offering unprecedented detail for the definition of cellular states. Two key parameters of any scRNA-seq experiment are the number of cells assayed, which determines the probability of being able to capture rare cell populations, and detection sensitivity, which dictates the number of genes available for cell-to-cell comparisons. These 2 criteria are leveraged into 2 classes of scRNA-seq platforms. High-throughput methods (eg, droplet-based methods like Drop-Seq, InDrops, 10X genomics)24-26 provide in excess of 104 cells per experiment but detect only 1000 to 3000 expressed genes per cell. In contrast, low-throughput methods (eg, plate-based methods like Smart-Seq2, CelSeq2, mcSCRB-Seq, RamDA-Seq)27-30 are typically used to profile up to ∼103 cells but detect >5000 genes per cell. The details of specific methods and their technical considerations have been extensively reviewed.23,31,32
For organ systems with a fast turnover, such as hematopoiesis, scRNA-seq offers a snapshot of cells and their expression states at a particular time point. Although temporal information is missing, much excitement has been generated by the idea that the distribution of single-cell expression profiles in the high-dimensional space can be considered as a transcriptional landscape, which encodes information on cellular transitions, enabling ordering of cells along pseudotime, from immature progenitors toward the various hematopoietic lineages.33,34 The inference of such putative differentiation trajectories requires certain assumptions and imposes some limitations, mainly differentiation is a continuous process (detection of jumps between cell states is difficult); cells differentiate asynchronously and are captured at multiple points along their differentiation routes; cells differentiate using defined (nonrandom) trajectories; cells move in one direction, so additional knowledge to determine start and finish is required; and cell-state information is complete. The last point is clearly problematic, because we cannot see hidden variables like epigenetics or cell location with current scRNA-seq protocols. Furthermore, some analytic methods require stricter assumptions, such as a tree-like structure of the data, where cells undergo a series of bifurcations during their differentiation, or absence of oscillations between cell states (eg, cell cycle), which may disregard potentially relevant biological information. For a detailed discussion of these assumptions, we refer readers to Weinreb et al.35
The past 6 years have seen an explosion of scRNA-seq studies within the hematopoiesis field, starting from profiling of previously well-defined hematopoietic populations36-39 and shifting toward less biased selection of cells,26,40-43 finally arriving at whole-tissue studies surveying >105 cells. We have summarized some of the most useful resources in Table 1. The current culmination comes from a large collaborative effort: the Human Cell Atlas,42 which aims to create reference maps for cells across >50 tissues in the human body. This includes a recently released data set with >500 000 human bone marrow and cord blood cells, providing the most complete scRNA-seq map yet of the human hematopoietic compartments.44 We present a general view of this data set in Figure 1B. Of note, we have excluded from the analysis natural killer and T lymphocytes, which account for ∼50% of cells and appear disconnected from the HSPC cluster. This separation is expected for T cells, which differentiate in the thymus but may also indicate that natural killer progenitors are rare or even absent in the bone marrow mononuclear cell fraction. Because these large-scale data sets await their full exploitation, we will focus on the main insights into hematopoietic differentiation delivered by scRNA-seq so far.
Selection of scRNA-seq data sets and resources relevant to hematopoiesis
| Reference | Cell n | Cell populations | Platform | Summary | Online resource |
|---|---|---|---|---|---|
| HSCs | |||||
| 71 | >130 | BM: LT-HSCs (LSK, CD150+, CD48−)* | C1 + SMARTer | Profiling of young and old mice reveals expansion of platelet-biased HSCs | No |
| 37 | >1 100 | BM: LT-HSCs (LSK, CD150+, CD48−), ST-HSCs (LSK, CD150−, CD48−), MPPs (LSK, CD150−, CD48+)* | SMART-Seq | Analysis of most immature stem and progenitor populations from old and young mice | Yes122 |
| 38 | >90 | BM: LT-HSCs (LSK, CD34−, Flt3−, CD48−, CD150−)* | SMART-Seq2 | Analysis of the LT-HSCs reveals subpopulations with highest repopulation potential; surface marker data allow immunophenotyping | No |
| 69 | >310 | BM: LT-HSCs (LSK, CD34−, CD48−, CD150+, CD135−), LRC/non-LRC* | C1 + SMARTer | Comparison of active and dormant HSC populations | No |
| Narrow gate data sets (HSPCs) | |||||
| 36 | >2 700 | BM: Lin−, Kit+, Sca1− cells* | MARS-Seq | Dissection of heterogeneity and lineage bias within CMPs, MEPs, GMPs; surface marker data allow immunophenotyping | No |
| 63 | >1 600 | BM: HSPCs including: LT-HSCs, LMPPs, MPPs, MEPs, CMPs, GMPs* | SMART-Seq2 | Reconstruction of 3 differentiation trajectories (erythroid, granulocytic-monocytic, lymphoid); surface marker data allow immunophenotyping | Yes123 |
| 92 | >2 800 | BM: LSK, LMPPs, CLPs + unipotent progenitors (ie, B cells, DCs, NK cells, Neu, and erythrocytes)* | CEL-Seq2 | Highlights trajectories toward B cells, neutrophils/monocytes, DCs, and erythrocytes | Yes124 |
| 39 | >380 | BM: LSK, CMPs, GMPs, (Lin− Kit+, CD34+)* | C1 + SMARTer | Dissection of heterogeneity and lineage bias in the intermediate progenitors | Yes125 |
| 19 | >4 900 | BM: LT-HSCs, ST-HSCs, MPP2s, MPP3s, MPP4s* | inDrops | Highlights lineage priming in the multipotent progenitor compartment and direct HSC-megakaryocyte differentiation trajectory | Yes126 |
| 70 | >1 400 | BM: HSPCs (CD34+, Lin−)† | Quartz-Seq | Transcriptomics/functional data suggest cloud HSC state in human followed by unipotent progenitors; surface marker data allow immunophenotyping | Yes127 |
| Broad gate data sets (HSPCs + differentiated cells) | |||||
| 47 | >2 300 | PB: range of DC and monocyte populations* | SMART-Seq2 | Analysis proposes a new taxonomy for human DCs and monocytes | Yes128 |
| 43 | >400 000 | 51 mouse tissues, including total BM and c-Kit+ fraction* | Microwell-Seq | Large-scale overview of the bone marrow and its progenitor compartment; also includes polymorphonuclear cells | Yes129 |
| BM: >38 000 | |||||
| 41 | >7 300 | BM: c-Kit+* | inDrops | Highlights basophil, megakaryocyte, and erythrocyte differentiation branches and effects of EPO stimulation | Yes130 |
| 40 | >58 000 | BM: LSK, LK* | 10X | Multiple differentiation trajectories and identification of basophil/mast cell progenitors; comparison with c-Kit–defective hematopoietic system | Yes131 |
| 26 | >180 000 | PBMCs (WT) + BMMC (AML patients + controls)† | 10X | Overview of the PBMCs (WT patients) and BMMCs before and after transplantation | No |
| 97 | >15 400 | PBMCs: CD3+ T cells, CD11b+ myeloid cells, CD19+ B cells† | 10X + REAP-Seq | Simultaneous analysis of the whole transcriptome and protein levels for 45 surface markers | No |
| 42, 44 | >270 000 | BMMCs† | 10X | Largest data set of human bone marrow yet | Yes132 |
| 10X Genomics | >8 300 | PBMCs† | 10X | PBMCs from a from a healthy human donor | No |
| 116 | >3 600 | PBMCs† | Seq-Well | Resolves major cell types and highlights heterogeneity in the monocyte population | No |
| 96 | >8 000 | CBMCs† | 10X + CITE-Seq | Simultaneous analysis of the whole transcriptome and protein levels for 13 surface markers | No |
| 117 | >21 300 | CB: CD34+† | Drop-Seq | Analysis reconstructs trajectories toward 4 distinct cell fates in the most immature compartment | Yes133 |
| 42 | >270 000 | CBMCs† | 10X | The largest data set of human cord blood yet | No |
| 118 | >8 000 | BM: unfractionated + LSK, B cells, T cells/NK cells, granulocyte and monocyte fractions* | SMART-Seq2 + 10X | >100 000 cells profiled from 20 mouse organs | Yes134 |
| Gene perturbations and diseases | |||||
| 109 | ∼70 000 | BM: DCs* | 10X | CRISPR perturbations provide insight into regulators of DCs | Yes135 |
| 112 | >10 000 | BM: myeloid cells (CD11c+) cells and HSPCs (LSK)* | MARS-Seq | CRISPR perturbations provide insight into regulators of myeloid cells in vitro and in vivo | No |
| 115 | >2 000 | BM: Lin−, CD34+, CD38− HSPCs† | SMART-Seq2 | Simultaneous analysis of leukemic and normal cells from patients with chronic myeloid leukemia; modification to SMART-Seq2 protocol allows mutation detection | No |
| 119 | >970 | BM: CD34+† | C1 + SMARTer | Use of scRNA-seq to detect aneuploidy in patients | No |
Raw and processed data can be obtained from the European Bioinformatics Institute Single Cell Expression Atlas120 or Gene Expression Omnibus121 databases.
AML, acute myeloid leukemia; BM, bone marrow; BMMC, bone marrow mononuclear cell; CB, cord blood; CBMC, cord blood mononuclear cell; DC, dendritic cell; EPO, erythropoietin; LK, Lin−, Kit+; LMPP, lymphoid-primed MPP; LRC, label-retaining cell; LSK, Lin−, Kit+, Sca1+; NK, natural killer; PB, peripheral blood; PBMC, peripheral blood mononuclear cell; WT, wild type.
Mouse.
Human.
scRNA-seq reshapes the bottom and middle tiers of the hematopoietic tree
scRNA-seq has quickly proved to be a powerful tool for distinguishing discrete cell states. Studies concerning lymphoid lineages have been reviewed previously45 ; therefore, we will discuss a couple of examples from the myeloid lineage. Single-cell profiling allowed discovery of several DC subtypes, which respond differently to lipopolysaccharides.46 A recent study laid out a new taxonomy for human DCs and monocytes in peripheral blood,47 with a new DC population responsible for T-cell activation previously misclassified as plasmacytoid DCs and a new conventional DC progenitor population (CD100Hi, CD34Int), functionally distinct from the CD34Hi HSCs. Yanez et al48 showed that Ly6Chi monocytes can be divided into neutrophil-like and monocyte-derived DC precursors arising through alternative differentiation routes, in agreement with another report.49
Recent studies have also challenged our understanding of the oligopotent progenitor compartments. Profiling of the (lineage−, Sca1−, c-Kit+) population containing the CMP/granulocyte-monocyte progenitor/megakaryocyte-erythroid progenitor populations (Figure 1A) revealed an unanticipated heterogeneity, with at least 18 distinct subtypes,36 with various degrees of lineage priming (ie, expression of lineage-specific genes), reflecting their progressive commitment. Importantly, the key surface markers FcgR and CD34, typically used to distinguish the CMP/granulocyte-monocyte progenitor/megakaryocyte-erythroid progenitor populations, turned out to be poor predictors of cell identity and lineage bias. Consistently, Olsson et al39 showed that only a small proportion of cells sorted from conventional myeloid progenitor populations displayed gene expression profiles consistent with multilineage progenitor activity. This study also elegantly demonstrates how the wealth of information provided by scRNA-seq can be exploited to infer gene regulatory information, refine cell isolation strategies, and enrich for specific bipotent progenitors by focusing on the counteracting regulators Gfi1 and Irf8.
These findings are in line with the accumulating evidence from single-cell colony assays,36,39,50-53 single-cell transplantations,36,54,55 and cellular barcoding19,56 experiments performed both in human and mouse, which collectively suggest that most cell fate decisions are taken earlier than expected from the classical hematopoietic tree model. This is also consistent with the original observations that many cells within progenitor gates (eg, CMPs or lymphoid-primed MPPs) are already lineage restricted.50,57 Therefore, the emerging picture is that unipotent cells dominate the middle tier of hematopoietic progenitors, albeit with a small contribution of bipotent/oligopotent progenitors. Whether these rare cell populations are true functional intermediates or perhaps outlier cells spilling over from less mature compartments remains to be seen.
Revisiting the HSC and MPP cell compartments by scRNA-seq
The upper tier of the hematopoietic tree classically contained 3 multipotent subpopulations with decreasing repopulation potentials: LT-HSCs, ST-HSCs (also known as MPP1), and MPPs, all 3 capable of generating both myeloid and lymphoid cells.12,54,58 Before the advent of scRNA-seq, immunophenotyping showed that MPPs have at least 4 subpopulations (MPP1-4) with distinct cell-cycle characteristics,12 molecular features,37,59-62 and functional biases.58,61,62 Subsequent molecular analysis at the single-cell level, first by single-cell quantitative polymerase chain reaction62 and later by scRNA-seq,19,37,63 showed that the HSC/MPP compartment may be characterized by a continuous landscape. Furthermore, transcriptional priming toward erythroid/megakaryocytic (MPP2), myeloid (MPP3), or lymphoid lineages (MPP4) suggested that many key fate decisions have already been initiated by earlier upstream progenitors (MPP1). Rodriguez-Fraticelli et al19 confirmed these findings in vivo by employing high-throughput scRNA-seq and lineage barcoding to quantify the degree of lineage priming and lineage contributions of each of the MPP subpopulations. Importantly, the compartment structure adapts to changing conditions; the MPP subpopulations shift toward more myeloid bias with increased animal age37 or after external stress.62
The true LT-HSC state characterized by the most durable self-renewal has been pursued for decades.12,54,58,64-68 Comparison of various HSC isolation strategies38 allowed the definition of molecular overlap and surface marker overlap scores, which describe gene expression patterns correlating with stem cell self-renewal capacity. A major component of the molecular overlap score are genes negatively regulating the cell cycle, consistent with the long-standing idea that dormancy marks stem cells with the highest self-renewal.12 The transition along the dormancy axis also seems to be gradual, with the dormant end of the spectrum characterized by deep quiescence (ie, slow return to the cell cycle), low biosynthetic activity, and high retinoic acid signaling,69 as well as quiescence and low respiration being conserved among the most immature human HSPCs.70
The other aspect of HSC heterogeneity is lineage output bias, which may manifest in lineage priming. Although Kowalczyk et al37 found no evidence for transcriptional lineage priming in HSCs regardless of age, Grover et al71 identified a subset of HSCs expressing megakaryocytic genes, including the Vwf marker, in old mice. The reason for this disparity is not clear, but it may be due to cell isolation techniques, animal breeding or ageing, or the bioinformatic tools used. Nevertheless, the presence of megakaryocyte-biased HSCs has been confirmed through transplantation experiments19,71-73 and tracking of native hematopoiesis,19 indicating that committing to a megakaryocytic fate may be one of the earliest fate decisions. Interestingly, these megakaryocyte-biased HSCs can still behave as multipotent stem cells after transplantation, highlighting that cell potential does not necessary reflect cell behavior under native conditions. HSC skewing toward myeloid and lymphoid lineages evident from transplantation experiments67,74,75 remains unexplained within the transcriptional landscape; however, data reported by Mann et al76 suggest that a myeloid-biased HSC subpopulation becomes detectable in aged mice after inflammation, consistent with previous functional data.77,78
How to navigate the hematopoietic differentiation landscape
Because the HSPC landscape seems to be at least in part continuous, traditional immunophenotyping approaches aiming to dissect distinct populations would now seem, to some extent, counterintuitive. Instead, broad and unbiased approaches tracking possible routes through the landscape are required. Recently, there has been a surge of analytical methods for differentiation trajectory inference. They commonly rely on measuring the distance between cells in a high-dimensional gene expression space, under the assumption that cells with a small distance between them are related, for example, representing stages of the same differentiation trajectory. The aim is to find a measure of distance that reflects the structure of the data, rather than just relying on a shortest possible path (Figure 2A). To perform this task, most methods use dimensionality reduction techniques to learn the data structure79-82 and simplify computation of cell-to-cell distances (Figure 2A). However, excessive dimensionality reduction will inevitably oversimplify the data (Figure 2B). Hence, there is a clear distinction between learned data (10-100 dimensional representation with minimal information loss) and visualizable data (2-3 dimensions interpretable by humans but at the expense of potentially discarding important biological information; Figure 2C). This means that although learned data are used for trajectory inference, it is not advisable to interpret complex differentiation pathways simply from a 2-dimensional representation of a data set (tSNE, UMAP).
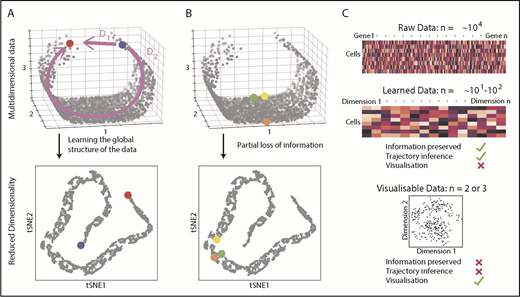
Distances and data dimensionality. (A) A set of single cells expressing 3 genes arranged along a curved shape has been simulated. There are 2 measures of distance between the blue and red cells. Whereas D1 represents the shortest possible distance between the 2 cells, D2 is the distance between the cells through the structure of the data (manifold). The two arms of the curved shape may represent continuous transition processes (eg, cell differentiation); therefore, distance D2 is the important distance measure. A dimensionality reduction technique (here tSNE) should capture such features. (B) Excessive reduction in dimensionality causes important information to be lost. In this case, a 2-dimensional representation of the data incorrectly suggests that the green cell is farther from the yellow cell than the orange cell, because information has been lost about axis 2. (C) To infer cellular trajectories from scRNA-seq data, dimensionality reduction is used to learn the structure of the data (learned data), which captures the important distances between cells in a suitable number of dimensions, typically 10 to 100. Trajectory inference can then be attempted from this learned data. For visualization, the dimensionality of the data needs to be reduced to either 2 or 3, but this will inevitably result in the loss of some of the important biological information, rendering data unsuitable for trajectory inference.
Distances and data dimensionality. (A) A set of single cells expressing 3 genes arranged along a curved shape has been simulated. There are 2 measures of distance between the blue and red cells. Whereas D1 represents the shortest possible distance between the 2 cells, D2 is the distance between the cells through the structure of the data (manifold). The two arms of the curved shape may represent continuous transition processes (eg, cell differentiation); therefore, distance D2 is the important distance measure. A dimensionality reduction technique (here tSNE) should capture such features. (B) Excessive reduction in dimensionality causes important information to be lost. In this case, a 2-dimensional representation of the data incorrectly suggests that the green cell is farther from the yellow cell than the orange cell, because information has been lost about axis 2. (C) To infer cellular trajectories from scRNA-seq data, dimensionality reduction is used to learn the structure of the data (learned data), which captures the important distances between cells in a suitable number of dimensions, typically 10 to 100. Trajectory inference can then be attempted from this learned data. For visualization, the dimensionality of the data needs to be reduced to either 2 or 3, but this will inevitably result in the loss of some of the important biological information, rendering data unsuitable for trajectory inference.
Early methods for trajectory inference focused on the idea of pseudotime, where the calculated distances are used to order cells along a putative trajectory according to their distance from a predefined starting point.33,34,83-87 This ordering allows recovery of the pseudodynamic gene expression along a trajectory. However, the need to assign cells to unidirectional trajectories restricts its applicability. Attempts to improve upon this by implementing methods that can discover putative branch points in a data set may provide a solution, but their ability to produce bifurcations consistent with functional data in an unsupervised manner has been limited.87-89 Alternative methods are aiming to identify the likely connection between clustered cells (StemID,90 PAGA91 ) or stepwise cell classification working back toward the stem cells (FateID92 ). Population balance analysis takes a physically motivated approach,35 attempting to constrain the problem of trajectory inference into a set of differential equations describing the flux of cells through the transcriptional landscape. These methods and others like them93 successfully recapitulate trajectories through the unipotent hematopoietic states but can also elucidate routes of differentiation among the heterogeneous HSPCs, as highlighted in the following section.
An evolving view of HSPC hierarchy
An early analysis of the multipotent stem/progenitor compartment examined 1600 cells spanning 10 classically defined HSPC populations.63 Although the surface marker information served as reference points for this and future studies, scRNA-seq analysis identified 3 broad trajectories in the differentiation landscape: lymphoid, erythroid, and granulocytic/monocytic, together with their gene expression signatures. A more complete view was provided by high-throughput scRNA-seq platforms, which allowed dense cell sampling of large populations (typically >4000 cells), overcoming the restriction of narrow sorting gates. Consequently, trajectories toward megakaryocytes, erythrocytes, monocytes/DCs, lymphoid cells, neutrophils, and rare populations of basophils, mast cells, and eosinophils are now beginning to be defined.40,41 The emerging cellular hierarchy is largely consistent with that inferred from recent in situ barcoding studies,18,19 with the exception of the erythroid lineage. This branch seems to be coupled with the megakaryocytic fate in scRNA-seq experiments,41,91 whereas barcoding data indicate closer linkage with monocytic/granulocytic lineages. Additional experiments focusing on native hematopoiesis will be required to resolve this issue.
The identified trajectories in scRNA-seq data contain a wealth of information. Using gene expression correlations, it is possible to extract putative regulators of fate decision and drivers or inhibitors of differentiation pathways, which will greatly facilitate future studies.41,63 In-depth analysis of a single trajectory can also help explain the dynamics of differentiation. Tusi et al41 delineated stages of early erythroid differentiation within the transcriptional landscape, including traditionally defined erythroid colony-forming unit and erythroid burst-forming unit populations, and described cell-cycle remodeling at putative cell amplification stages during differentiation. This provided a platform on which to analyze the effects of erythropoietin stimulation on the progenitor population structure and their cell-cycle profiles. Global analysis of the progenitor landscape revealed a surprising pattern of multiple types of mature cells arising via >1 trajectory. Analysis of c-Kit+ cells, for example, suggested that monocytes have 2 origins: 1 coupled with the DC branch and 1 with the neutrophil branch.41 Similarly, megakaryocytes are predicted to arise directly from megakaryocyte-biased HSCs as well as through a MPP intermediate.19 Finally, the yet unpublished PAGA analysis of the Lin− c-Kit+ population suggests that basophils can originate from the neutrophil/monocyte branch or from the megakaryocyte/erythroid branch,91 with the latter supported by recent computational results.41 Although the complexity of megakaryocyte and monocyte trajectories is supported by experimental data,19,48,71 firmly establishing the existence of alternative basophil trajectories would still benefit from further experimental validation.
Although mice have proved to be an excellent model system, there is accumulating evidence suggesting that human progenitors may be organized differently. A 2016 study used clonal assays and xenograft transplantations to show that in human adult bone marrow, unlike the fetal liver, previously described oligopotent progenitors (MPPs, CMPs, multilymphoid progenitors) are predominantly unipotent and arise directly from the multipotent stem cell compartment.55 Subsequently, a detailed scRNA-seq study analyzed the most immature HSPC compartments (Lin−, CD34+, CD38−, and Lin−, CD34+, CD38+) and revealed that although the unipotent progenitor populations described indeed form discrete subpopulations, the stem cell compartment seems to form a rather continuous structure.70 From the lack of obvious priming in the immature populations (with the exception of a minor lymphoid/myeloid vs megakaryocyte/erythroid bias), the authors concluded that HSCs exist in a fluid cloud state, which gives rise directly to committed progenitors without much cell hierarchy in between. Furthermore, even the least primed populations can give rise to single lineages in vitro, indicating that true multipotent cells constitute only a small fraction of the conventional stem cell population. These findings are at odds with evidence of the HSPC hierarchy from the murine system, where the upper tiers, although difficult to resolve molecularly, have functionally multipotent output.
Although differences between the human and mouse hematopoietic landscapes are bound to exist, drawing conclusions about the underlying reasons remains challenging, because current scRNA-seq data analyses produce a rather flat HSPC landscape, with limited ability to resolve distinct cellular states.19,37,38,41,63 Some aspects of population structure may be drowned in the noise caused by processes such as cell cycle or metabolism. Furthermore, current scRNA-seq data represent an incomplete view of cellular states as a result of the failure to detect lowly expressed genes and the absence of entire domains of information, such as protein levels or epigenetic status. Importantly, current mouse and human data sets have been analyzed using different bioinformatic methods, and careful cross analysis is required before drawing any strong conclusions.
Outlook: extending the paradigm
In light of the accumulated scRNA-seq data, the concept of clearly demarcated stem and progenitor cell types becomes questionable. Barring the caveat of hidden variables (proteins, epigenetics, cell location), the landscape encompassing the most primitive HSPCs appears mostly continuous and flat. It is difficult to argue for a reason why the progenitor hierarchy needs to be discrete, other than simplicity or aesthetics. Indeed, even the very surface markers used for progenitor isolation commonly exhibit continuous, rather than discrete, levels. The notion of progenitor types has been historically dictated by technical limitations: ability to observe cells using only a small number of markers and limited number of parallel functional assays. By contrast, in a transcriptomic landscape, each cell is positioned using information from several thousand genes.
Of note, a continuous and flat shape does not imply lack of embedded features or information. On the contrary, it is evident that positions/territories within this space are functionally relevant and associated with key functional qualities, such as durability of self-renewal38,69 or cell output,19,36,41,94 measured using a variety of techniques, including cell barcoding,19 HSC transplantation assays,36,38,69 or in vitro clonal assays.41 However, because of this continuous nature, a typical flow cytometry gating approach provides an arbitrary section through the progenitor landscape, providing a mixture of cells and covering a range of functional outputs (Figure 3A). Although undoubtedly useful, isolation of specific populations offers a fundamentally restricted insight into the organization and dynamics of stem and progenitor cells.
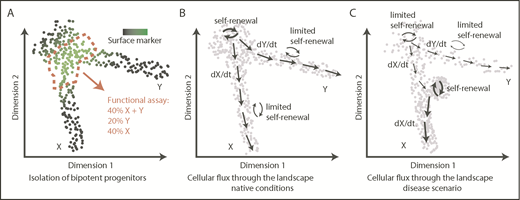
From transcriptomic landscapes to tissue function. The 3 diagrams depict 2-dimensional landscapes with single cells as points, where a pool of progenitors gives rise to 2 differentiated populations X and Y. (A) A classical approach to identify a specific bipotent progenitor population, an immunophenotypic gate drawn based on expression of a surface marker (green) sections through the landscape and yields a heterogeneous population of cells upon functional analysis. (B) Normal hematopoiesis; dynamic information about cellular fluxes (arrows) indicates directions of differentiation throughout the landscape and degree of self-renewal. (C) An example of how cell-flux analysis reveals mechanisms of a disease. In this case, the stem cell pool is exhausted (low self-renewal), compromising production of Y cells, whereas there is increased production of X cells because of acquired increased self-renewal of progenitors X.
From transcriptomic landscapes to tissue function. The 3 diagrams depict 2-dimensional landscapes with single cells as points, where a pool of progenitors gives rise to 2 differentiated populations X and Y. (A) A classical approach to identify a specific bipotent progenitor population, an immunophenotypic gate drawn based on expression of a surface marker (green) sections through the landscape and yields a heterogeneous population of cells upon functional analysis. (B) Normal hematopoiesis; dynamic information about cellular fluxes (arrows) indicates directions of differentiation throughout the landscape and degree of self-renewal. (C) An example of how cell-flux analysis reveals mechanisms of a disease. In this case, the stem cell pool is exhausted (low self-renewal), compromising production of Y cells, whereas there is increased production of X cells because of acquired increased self-renewal of progenitors X.
Transcriptomic data offer a more complex and likely more faithful representation, without the need for subjective categories. Moreover, if necessary for experimental purposes, discretization is assisted by rich expression information. Although scRNA-seq data are static, the method encodes information on cell states as they exist in vivo, and at deep coverage, it has the potential to capture molecular states representative of cellular transitions. This means that for each location within the landscape (ie, cellular state), it may become possible to infer transition directions and probabilities associated with them under native conditions. Quantitative description of this cell flux through the multidimensional space will constitute a major advance (Figure 3B). We highlight 4 directions that will facilitate this process and combined will advance our understanding of hematopoiesis.
Toward complete cell-state information
The single-cell landscape constitutes an essential framework but is currently limited to a subset of messenger RNA information and lacks potential heterogeneity hidden at protein, epigenetic, or tissue location level. Further development of scRNA-seq technology will offer denser sampling95 and increased coverage/accuracy of transcriptional profiling30 and, combined with new techniques, will enable simultaneous detection of proteins (CITE-Seq or REAP-Seq)96,97 or chromatin status.98-101 Imaging-based transcriptomics is also being developed to complement the data with spatial information.102,103 Altogether, this near-complete information will provide precise locations of cells in a multidimensional feature space and tie together information at molecular, cellular, and tissue levels.
Advanced analytic tools
As increasingly complex data sets accumulate, analysis becomes more challenging. This includes trajectory inference, identification of branching points, and extraction of gene regulatory information. Quantitative description of cell fluxes through the progenitor space is still in its infancy, but newly developed numerical frameworks already attempt to approximate cell transitions from snapshot data (described in “How to navigate the haematopoietic differentiation landscape”).35,91,104 Nonetheless, parallel experimental information remains critical to provide directionality and real-time information for cell differentiation processes.
Real-time cell flux through the progenitor space
Rather than discretizing HSPCs by immunophenotyping, a more promising approach would be to link cell positions within the landscape with experimentally derived cell output (Figure 3B), under both native and transplantation conditions. Thus, each position would encode information on cellular flow in particular directions, quantifying differentiation and self-renewal. New technologies allowing simultaneous in vivo/in vitro barcoding and single-cell transcriptional profiling (where a barcode can be assigned to cells within scRNA-seq data) are emerging, using either transposon tagging105 or CRISPR scarring.106,107 This should enable integration of real-time cell ancestry information with transcriptomic landscapes and potentially allow for the identification of transcriptomic signals generated only transiently during real-time differentiation. For finer time scales and insight into cell cycle–related effects, pulse-chase experiments may become important.108
Molecular mechanisms driving cell transitions
To manipulate hematopoiesis, we need to understand the underlying molecular mechanisms. Correlations inferred from expression data provide ample hypotheses for regulatory mechanisms, but experimental testing is essential. Gene regulatory networks and chromatin state can now be efficiently interrogated with recently developed techniques combining CRISPR screening with scRNA-seq.109-114 Targeting multiple genes and observing the effects globally will help us understand how RNA, proteins, epigenetics, and extrinsic signals establish the shape of the differentiation landscape and drive cellular fluxes.
Altogether, these approaches will provide a reference framework with computational modeling capacity, a promising starting point for understanding abnormal hematopoiesis. Even at this early stage, single-cell transcriptomics provides valuable insight. As reported by Dahlin et al,40 global analysis of the progenitor compartment revealed that c-Kit–defective signaling reshapes the top of the hematopoietic hierarchy and blocks the mast cell fate at an early stage in mice. Combining scRNA-seq with detection of mutations in single cells opens the possibility of analyzing samples directly from leukemia patients. Giustachini et al115 applied this approach to identify cell subpopulations persisting after prolonged chemotherapy and related to blast crisis in chronic myeloid leukemia patients. A global comparison of single cell landscapes between leukemic and wild-type states will reveal new cellular states or changes in the cellular fluxes associated with, for example, changes in self-renewal or enhanced/reduced differentiation in particular lineages (Figure 3C). Combining our knowledge on cell flux with regulatory mechanisms will enable a more informed development of future therapies. Thus, we expect that scRNA-seq analysis will soon shed new light on leukemia pathogenesis and become closely relevant in the clinical setting.
Acknowledgments
Work in the Gottgens Laboratory is supported by grants from Wellcome, Bloodwise, Cancer Research UK; National Institutes of Health, National Institute of Diabetes and Digestive and Kidney Diseases (DK106766); and core support grants by Wellcome to the Wellcome–Medical Research Council Cambridge Stem Cell Institute. S.W. is the recipient of a Medical Research Council Studentship.
Authorship
Contribution: S.W., I.K., and B.G. wrote the paper together; S.W. and I.K. generated the diagrams; and all authors approved the final manuscript.
Conflict-of-interest disclosure: The authors declare no competing financial interests.
Correspondence: Berthold Gottgens, Cambridge University Department of Haematology, Cambridge Institute for Medical Research & Wellcome and MRC Cambridge Stem Cell Institute Hills Rd, Cambridge CB2 0XY, UK; e-mail: bg200@cam.ac.uk; and Iwo Kucinski, Cambridge University Department of Haematology, Cambridge Institute for Medical Research & Wellcome and MRC Cambridge Stem Cell Institute Hills Rd, Cambridge CB2 0XY, UK; e-mail: idk25@cam.ac.uk.
