

Key Points
CDK9 exhibits differential binding to distinct cellular elements of mTOR complexes and forms CDK9-mTOR-like complexes (CTORC1 and CTORC2).
CTORC1 controls transcription of genes important for leukemogenesis, whereas CTORC2 controls mRNA translation.

Abstract
Aberrant activation of mTOR signaling in acute myeloid leukemia (AML) results in a survival advantage that promotes the malignant phenotype. To improve our understanding of factors that contribute to mammalian target of rapamycin (mTOR) signaling activation and identify novel therapeutic targets, we searched for unique interactors of mTOR complexes through proteomics analyses. We identify cyclin dependent kinase 9 (CDK9) as a novel binding partner of the mTOR complex scaffold protein, mLST8. Our studies demonstrate that CDK9 is present in distinct mTOR-like (CTOR) complexes in the cytoplasm and nucleus. In the nucleus, CDK9 binds to RAPTOR and mLST8, forming CTORC1, to promote transcription of genes important for leukemogenesis. In the cytoplasm, CDK9 binds to RICTOR, SIN1, and mLST8, forming CTORC2, and controls messenger RNA (mRNA) translation through phosphorylation of LARP1 and rpS6. Pharmacological targeting of CTORC complexes results in suppression of growth of primitive human AML progenitors in vitro and elicits strong antileukemic responses in AML xenografts in vivo.
Introduction
The clinical management of acute myeloid leukemia (AML) remains a challenge because there are limited treatment options, after the failure of initial therapy.1 Therapeutic targeting of the mammalian target of rapamycin (mTOR) pathway has been an area of significant interest, because mTOR signaling plays a central role in aberrant leukemia cell proliferation and survival.2 Approximately 60% of AML patients possess mutations resulting in the activation of the mTOR pathway.2 mTOR is a serine/threonine kinase that plays a central role in the regulation of cellular processes, including protein synthesis, metabolism, and growth.2-4 mTOR coexists in 2 complexes, mTORC1 and mTORC2. mTORC1 consists of mTOR, Raptor, mLST8, Deptor, and PRAS40 and controls messenger RNA (mRNA) translation and ribosome biogenesis through phosphorylation of 4E-BPs and S6K.2-4 mTORC2 consists of mTOR, Rictor, mLST8, Protor, Sin1, and Deptor and mediates antiapoptotic responses, primarily via regulation of the kinase AKT.2-4
Despite the anticipated therapeutic potential of mTOR inhibition, investigation of small molecules that inhibit mTORC1 in AML has yielded limited clinical responses.5-7 Various factors limiting the efficacy of mTORC1 inhibition in leukemia have been identified, including the presence of negative regulatory feedback loops and redundant pathways that confer a survival advantage.2,3,8,9 This has led to the development of catalytic mTOR inhibitors, which inhibit both mTORC1 and mTORC2, and combinatorial strategies using inhibitors that target PI3K, autophagy, and MAPK pathways.9-16 However, none of these approaches have been approved for clinical use thus far, in part, due to limited responses or dose limiting toxicity.2,17-20 Therefore, it is crucial to discover new elements and effectors of the mTOR pathway that could be therapeutically targeted.
Accordingly, we undertook a proteomic screen using liquid chromatography tandem mass spectrometry (LC-MS/MS) to identify novel interactors with components of mTOR complexes. Herein, we report that cyclin dependent kinase 9 (CDK9) binds to the common mTOR complex scaffold protein, mLST8, and is a key element of unique CDK9 mTOR-like complexes (CTORC). CDK9 is a well-characterized kinase, traditionally bound to cyclin T, and plays a critical role in the regulation of transcriptional elongation.21,22 As we outline below, we demonstrate a novel role for mTORC1 components in CDK9’s role in transcriptional regulation by forming a novel nuclear complex, CTORC1. Our findings also suggest the existence of a novel cytoplasmic complex, CTORC2, that functions in an “mTORC1-like” role. We demonstrate that CDK9 inhibition affects phosphorylation of the downstream mTORC1 targets, rpS6 and LARP1, thereby suppressing mRNA translation of mitogenic genes. Finally, we demonstrate that CDK9 inhibition suppresses the growth of primitive AML precursors and enhances the antileukemic effects of cytarabine in vitro and in vivo.
Methods
Cell lines
U937 and HEL leukemia cell lines were grown in RPMI 1640 medium with 10% fetal bovine serum (FBS). The MV4-11 leukemia cell line was grown in Iscove modified Dulbecco medium with 10% FBS. The Kasumi-1 leukemia cell line was grown in RPMI 1640 medium with 20% FBS. The KG-1 leukemia cell line was grown in Iscove modified Dulbecco medium with 20% FBS. All leukemia cell lines were tested by short tandem repeat analysis. The 293T cell line was obtained from Clontech and grown in Dulbecco’s modified Eagle medium with 10% FBS.
Animal xenograft studies
All animal studies were approved by the Northwestern University Institutional Animal Care and Use Committee. More detailed information can be found in the supplemental material, available on the Blood Web site.
Primary AML patient samples
Peripheral blood or bone marrow samples were collected from patients with AML after obtaining informed consent as approved by the institutional review board of Northwestern University. Mononuclear cells were isolated by Ficoll-Hypaque (Sigma-Aldrich) gradient sedimentation.
Chemicals
Atuveciclib (BAY1143572)23 was purchased from Active Biochem and used at a dose of 3 μM for U937 and 1 μM for MV4-11 cells, unless otherwise indicated. Vistusertib (AZD-2014) was purchased from Chemietek and used at a dose of 500 nM. Rapamycin was purchased from Sigma-Aldrich and used at a dose of 25 nM. Cytarabine was purchased from Sigma-Aldrich.
Cell viability assays
Clonogenic leukemic progenitor assays in methylcellulose
Plasmids and transfections
pRK5-MYC- RICTOR,26 pRK5- HA-mLST8,26 pRK5-HA-RAPTOR,27 pMSCV -MYC-mSIN1.1,28 and pYPF-C1- mTOR29 were purchased from Addgene. pCMV2- FLAG- CDK9 WT30 was kindly provided by David Gius from Northwestern University. The mutant CDK9 plasmids were generated using site-directed mutagenesis by BioInnovatise, Inc. 293T cells were transfected with plasmid using lipofectamine 2000, according to the manufacturer’s protocol.
Cell lysis and immunoblotting
Cytoplasmic and nuclear fractionation
Cell cytoplasmic and nuclear fractionations were prepared according to the protocol detailed in the NE-PER Nuclear and Cytoplasmic Extraction Reagent Kit (ThermoFisher).
Coimmunoprecipitation (IP) assays
LC-MS/MS analysis
Detailed LC-MS/MS methods and data analysis can be found in the supplemental material.
Quantitative reverse transcription polymerase chain reaction (qRT-PCR)
RNA was isolated using the RNeasy kit (Qiagen). mRNA was reverse transcribed into complementary DNA using the SuperScript IV VILOMaster Mix (ThermoFisher). Real-time PCR for MYC, PIM1, 18S, ACTB, HPRT1, and GAPDH genes was carried out by a CFX96 Real-Time PCR Detection System (Bio-Rad), using commercially available fluorescein amidite–labeled probes (Bio-Rad) and primers (Applied Biosystems). Relative quantitation of mRNA levels was calculated using the ΔΔCt method and plotted as fold increase compared with untreated samples. GAPDH was used for normalization.
Chromatin immunoprecipitation (ChIP)
ChIP was performed using the SimpleChIP Enzymatic Chromatin IP Kit with magnetic beads and antibodies from Cell Signaling, as per the manufacturer’s instructions. Normal rabbit immunoglobulin G (IgG) was used as a negative control. Quantitative polymerase chain reaction (qPCR) was performed on purified immunoprecipitated DNA for the MYC and PIM1 promoters using PowerUp SYBR Green Master Mix (ThermoFisher) with previously published primers33,34 : MYCF-ACGTTTGCGGGTTACATACAGTGC; MYCR-GAGAGGAGTATTACTTCCGTGCCT; PIM1F-AATGCAATCAACAGAAAAGCTGTAAAT; PIM1R-ACATAACATTGACCTCCA GGTTAGAAT. All qPCR signals were normalized to the input DNA.
Polysomal profiling and fractionation
Assessment of apoptosis by flow cytometry
Statistical analysis
All statistical analyses were performed using GraphPad Prism 6.0.
Results
Proteomic screening identifies CDK9 as a unique binding partner for mLST8
In the first series of experiments, mLST8 was immunoprecipitated from U937 leukemia cells; then LC-MS/MS analysis was conducted to identify novel protein interactions. mLST8 was selected because it is a constituent of both mTOR complexes.2-4 CDK9 and its known partner, Cyclin T1, were identified as potential novel binding partners for mLST8 (supplemental Table 1). Next, U937 cells were fractionated into cytoplasmic and nuclear extracts, and CDK9 was immunoprecipitated from both fractions, followed once again by LC-MS/MS analysis (supplemental Table 1). Pathway and process enrichment analysis was performed on the proteins identified by LC-MS/MS that are putative binders to mLST8, nuclear CDK9 (CDK9-nuc), and/or cytoplasmic CDK9 (CDK9-cyto) in order to identify potentially novel functions of mLST8 and CDK9 (Figure 1A; supplemental Table 2). We also sought to determine the pathways mLST8 and CDK9 may have in common. mRNA and ribosomal RNA processing were identified as the most significantly represented processes among all the proteins associated with mLST8 and/or CDK9 in LC-MS/MS (Figure 1A). Ribosomal biogenesis or regulation of gene expression/chromatin was also significantly represented (Figure 1A), suggesting potentially novel roles for mLST8 in processes related to chromatin reorganization and gene transcription. In addition, these data suggested a novel role for CDK9 in regulation of RNA processing and ribosomal biogenesis. Next, we narrowed the LC-MS/MS results (supplemental Table 1) to proteins that bind both mLST8 and CDK9 (nuclear and/or cytoplasmic) (Figure 1B). Pathway and process enrichment analysis of these proteins was performed (Figure 1C; supplemental Table 3). Our analysis identified that the most significantly represented pathways are related to RNA processing and translation, suggesting a novel role for CDK9 in these processes.
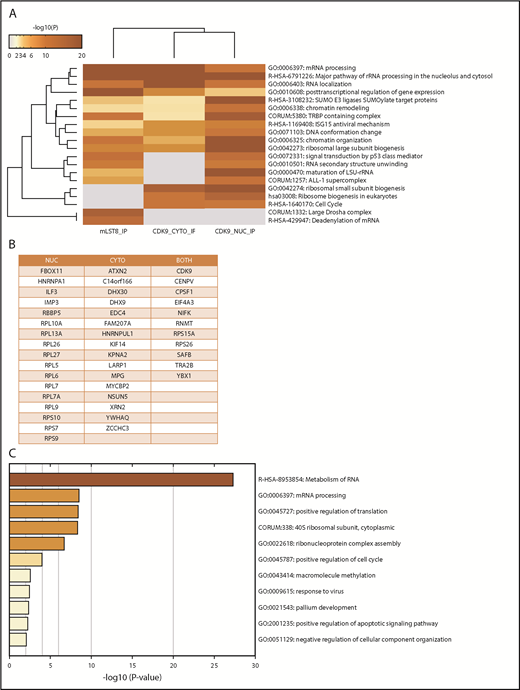
MS identifies CDK9 as a unique binding partner for mLST8, sharing common signaling pathways and associated proteins. (A) mLST8 was immunoprecipitated from U937 cell lysates using magnetic beads preconjugated with an anti-mLST8 antibody. U937 cells were also fractionated into cytoplasmic (CYTO) and nuclear (NUC) extracts; then CDK9 was immunoprecipitated with magnetic beads preconjugated with an anti-CDK9 antibody. Rabbit IgG (RIgG) preconjugated beads were used as negative controls for nonspecific binding. Immunoprecipitated proteins were resolved by sodium dodecyl sulfate–polyacrylamide gel electrophoresis (SDS-PAGE), and the gel was cut into 10 equivalent bands prior to standard in-gel digestion. Samples were prepared using standard techniques and then analyzed via nano LC-MS/MS. The results from MS were annotated using Metascape. The heat map shows the most significant pathways and the overlap between the 3 groups mLST8 IP, CDK9 CYTO IP, and CDK9 NUC IP. A full summary of the results is included in supplemental Table 1. (B) List of proteins from the MS results that overlap between the CDK9 IPs and mLST8 IPs. (C) The list of genes in panel B was annotated and analyzed for the most significant pathways represented using Metascape. The heat map shows the most significant pathways represented in the list of overlapping proteins. rRNA, ribosomal RNA.
MS identifies CDK9 as a unique binding partner for mLST8, sharing common signaling pathways and associated proteins. (A) mLST8 was immunoprecipitated from U937 cell lysates using magnetic beads preconjugated with an anti-mLST8 antibody. U937 cells were also fractionated into cytoplasmic (CYTO) and nuclear (NUC) extracts; then CDK9 was immunoprecipitated with magnetic beads preconjugated with an anti-CDK9 antibody. Rabbit IgG (RIgG) preconjugated beads were used as negative controls for nonspecific binding. Immunoprecipitated proteins were resolved by sodium dodecyl sulfate–polyacrylamide gel electrophoresis (SDS-PAGE), and the gel was cut into 10 equivalent bands prior to standard in-gel digestion. Samples were prepared using standard techniques and then analyzed via nano LC-MS/MS. The results from MS were annotated using Metascape. The heat map shows the most significant pathways and the overlap between the 3 groups mLST8 IP, CDK9 CYTO IP, and CDK9 NUC IP. A full summary of the results is included in supplemental Table 1. (B) List of proteins from the MS results that overlap between the CDK9 IPs and mLST8 IPs. (C) The list of genes in panel B was annotated and analyzed for the most significant pathways represented using Metascape. The heat map shows the most significant pathways represented in the list of overlapping proteins. rRNA, ribosomal RNA.
Given the significant overlap in proteins that potentially bind to mLST8 and CDK9, we sought to determine the potential for mLST8 and CDK9 to form novel complexes. Initially, we validated the interaction of mLST8 and CDK9 by IP of whole cell lysates with an anti-mLST8 antibody, followed by immunoblotting with an anti-CDK9 antibody (Figure 2A). As CDK9 acetylation has been shown to modify its function,30,36,37 we examined whether the acetylation status of CDK9 affects the binding of CDK9 to mLST8. In co-IP studies involving expression of various CDK9 acetylation mutants, we found that binding of CDK9 to mLST8 occurs irrespective of CDK9’s acetylation status (Figure 2B). We then assessed if CDK9 binds to other mTOR complex components. We co-overexpressed FLAG-CDK9 with HA-mLST8, HA-RAPTOR, MYC-RICTOR, MYC-mSIN1.1, or YFP-mTOR in 293T cells and assessed the ability of CDK9 to bind different mTOR complex components by co-IP. CDK9 interacted with all the main mTORC1 and mTORC2 pathway components (Figure 2C-E), suggesting an involvement of CDK9 in both mTORC1 and mTORC2 signaling.
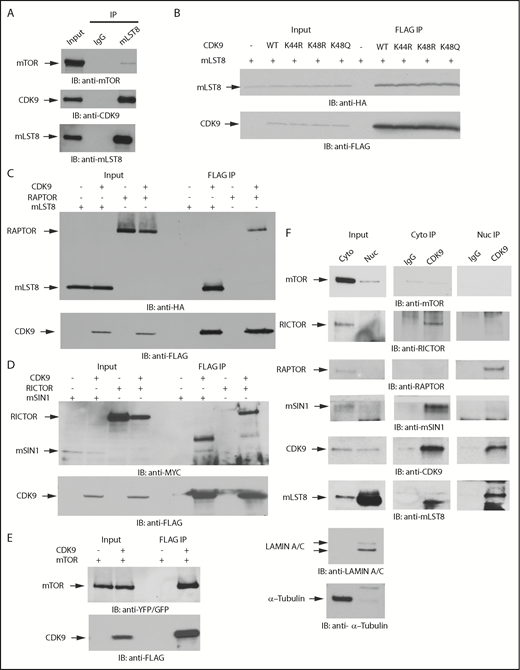
CDK9 binds to protein components of mTOR complexes. (A) U937 cells were lysed, and mLST8 was immunoprecipitated with magnetic beads preconjugated with an anti-mLST8 antibody. Rabbit IgG preconjugated beads were used as negative controls for nonspecific binding. Proteins were resolved by SDS-PAGE and immunoblotted with the indicated antibodies. mTOR was used as a positive control for binding. (B) HA-mLST8 was coexpressed with various FLAG-CDK9 acetylation mutants in 293T cells. Cells were lysed in (3-((3-cholamidopropyl) dimethylammonio)-1-propanesulfonate) (CHAPS) buffer, and FLAG-CDK9 was immunoprecipitated with Sepharose beads preconjugated with an anti-FLAG-M2 antibody. Proteins were resolved by SDS-PAGE and immunoblotted with the indicated antibodies. (C) HA-mLST8 or HA-RAPTOR was coexpressed with FLAG-CDK9 in 293T cells. Cells were lysed in CHAPS buffer, and FLAG-CDK9 was immunoprecipitated with Sepharose beads preconjugated with an anti-FLAG-M2 antibody. Proteins were resolved by SDS-PAGE and immunoblotted with the indicated antibodies. (D) MYC-RICTOR or MYC-mSIN1 was coexpressed with FLAG-CDK9 in 293T cells. Cells were lysed in CHAPS buffer, and FLAG-CDK9 was immunoprecipitated with Sepharose beads preconjugated with an anti-FLAG-M2 antibody. Empty vector coexpressed with MYC-RICTOR or MYC-SIN1 was used a negative control for nonspecific binding. Proteins were resolved by SDS-PAGE and immunoblotted with the indicated antibodies. (E) YFP-mTOR was coexpressed with FLAG-CDK9 in 293T cells. Cells were lysed in CHAPS buffer, and FLAG CDK9 was immunoprecipitated with Sepharose beads preconjugated with an anti–FLAG-M2 antibody. Empty vector coexpressed with YFP-mTOR was used as a negative control for nonspecific binding. Proteins were resolved by SDS-PAGE and immunoblotted with the indicated antibodies. (F) U937 cells were fractionated into cytoplasmic and nuclear lysates. Proteins were resolved by SDS-PAGE and transferred to polyvinylidene fluoride (PVDF) membranes. Membranes were then immunoblotted with antibodies for tubulin (cytoplasmic marker) and lamin A/C (nuclear marker) to verify cellular fractionation. IP with magnetic beads preconjugated to an anti-CDK9 antibody was performed on cytoplasmic and nuclear cell lysates from U937 cells. Rabbit IgG preconjugated beads were used as negative controls for nonspecific binding. Proteins were resolved by SDS-PAGE and immunoblotted with the indicated antibodies.
CDK9 binds to protein components of mTOR complexes. (A) U937 cells were lysed, and mLST8 was immunoprecipitated with magnetic beads preconjugated with an anti-mLST8 antibody. Rabbit IgG preconjugated beads were used as negative controls for nonspecific binding. Proteins were resolved by SDS-PAGE and immunoblotted with the indicated antibodies. mTOR was used as a positive control for binding. (B) HA-mLST8 was coexpressed with various FLAG-CDK9 acetylation mutants in 293T cells. Cells were lysed in (3-((3-cholamidopropyl) dimethylammonio)-1-propanesulfonate) (CHAPS) buffer, and FLAG-CDK9 was immunoprecipitated with Sepharose beads preconjugated with an anti-FLAG-M2 antibody. Proteins were resolved by SDS-PAGE and immunoblotted with the indicated antibodies. (C) HA-mLST8 or HA-RAPTOR was coexpressed with FLAG-CDK9 in 293T cells. Cells were lysed in CHAPS buffer, and FLAG-CDK9 was immunoprecipitated with Sepharose beads preconjugated with an anti-FLAG-M2 antibody. Proteins were resolved by SDS-PAGE and immunoblotted with the indicated antibodies. (D) MYC-RICTOR or MYC-mSIN1 was coexpressed with FLAG-CDK9 in 293T cells. Cells were lysed in CHAPS buffer, and FLAG-CDK9 was immunoprecipitated with Sepharose beads preconjugated with an anti-FLAG-M2 antibody. Empty vector coexpressed with MYC-RICTOR or MYC-SIN1 was used a negative control for nonspecific binding. Proteins were resolved by SDS-PAGE and immunoblotted with the indicated antibodies. (E) YFP-mTOR was coexpressed with FLAG-CDK9 in 293T cells. Cells were lysed in CHAPS buffer, and FLAG CDK9 was immunoprecipitated with Sepharose beads preconjugated with an anti–FLAG-M2 antibody. Empty vector coexpressed with YFP-mTOR was used as a negative control for nonspecific binding. Proteins were resolved by SDS-PAGE and immunoblotted with the indicated antibodies. (F) U937 cells were fractionated into cytoplasmic and nuclear lysates. Proteins were resolved by SDS-PAGE and transferred to polyvinylidene fluoride (PVDF) membranes. Membranes were then immunoblotted with antibodies for tubulin (cytoplasmic marker) and lamin A/C (nuclear marker) to verify cellular fractionation. IP with magnetic beads preconjugated to an anti-CDK9 antibody was performed on cytoplasmic and nuclear cell lysates from U937 cells. Rabbit IgG preconjugated beads were used as negative controls for nonspecific binding. Proteins were resolved by SDS-PAGE and immunoblotted with the indicated antibodies.
As mTOR signaling events occur primarily in the cytoplasm, whereas CDK9 is primarily thought to function in the nucleus, we next sought to define the cellular compartments where CDK9 and mTOR complex components interact. Cytoplasmic and nuclear fractions were isolated from U937 cells, immunoprecipitated with an anti-CDK9 antibody, and then immunoblotted using antibodies against different protein components of mTOR complexes (Figure 2F). We performed western blots for the cytoplasmic marker β-tubulin and the nuclear marker Lamin A/C as fractionation controls (Figure 2F). We found that CDK9 binds to RICTOR and SIN1 in the cytoplasm, whereas it was bound to RAPTOR in the nucleus (Figure 2F). mLST8 appeared to have a stronger affinity for CDK9 in the nucleus because significantly more mLST8 was found bound to CDK9 in the nuclear extracts. Notably, mTOR and CDK9 did not coimmunoprecipitate in the fractionated IPs, but did when ectopically overexpressed together (Figure 2E-F), suggesting that the binding affinity of the mTOR-CDK9 interaction is weak and/or that CDK9 is present in distinct complexes that do not include mTOR.
CDK9-, RAPTOR-, and mLST8-containing complexes bind promoter sites and control transcription of genes important for leukemogenesis
In the subsequent set of experiments, we sought to evaluate the role of CDK9 and mTORC components in the nucleus. To further confirm the interaction between mLST8, RAPTOR, and CDK9, we examined whether these components colocalize with CDK9 to promoter sites of MYC and PIM1 genes using ChIP analysis. The MYC promoter was chosen because it has been previously shown to be a specific target of CDK9-regulated transcription,34,38,39 while the PIM promoter was evaluated because PIM proteins are short half-life proteins overexpressed in AML40 primarily through regulation of gene transcription.41,42 ChIP analysis revealed that CDK9, RAPTOR, and mLST8 localized at the promoter regions of both MYC and PIM1 (Figure 3A), further indicating that these 3 proteins form a complex, CTORC1, that binds to chromatin. To examine whether promoter-bound CTORC1 complexes control gene transcription, we examined the effects of CDK9 inhibition21 on MYC and PIM1 gene expression. As expected,21,22 the CDK9 inhibitor atuveciclib potently inhibited phosphorylation of RNA polymerase II carboxy terminal domain at serine 2 but not serine 5 in leukemia cell lines (Figure 3B). Importantly, treatment with atuveciclib resulted in a dramatic decrease in c-MYC expression, both the protein and mRNA levels (Figure 3C-E). Similarly, both PIM1 mRNA and protein expression were downregulated (Figure 3C-E). Consistent with this, treatment of primary AML leukemic cells with atuveciclib resulted in significant downregulation of MYC and PIM1 gene transcription (Figure 3F). In total, these results strongly suggest a key role for the CTORC1 complex in the control of expression of genes that are important for leukemogenesis.
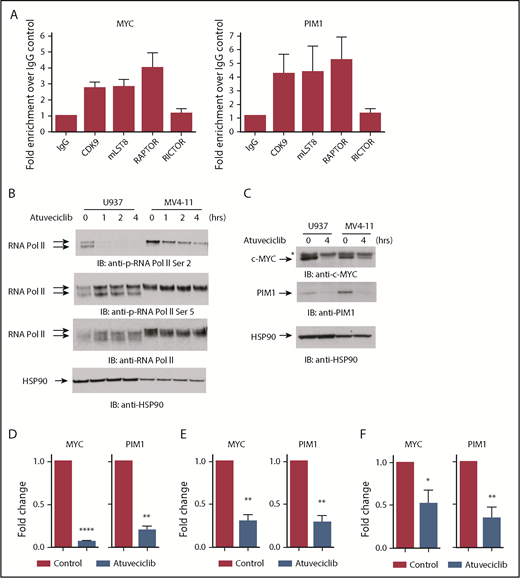
The CDK9/mLST8/RAPTOR nuclear complex regulates expression of genes important for leukemogenesis. (A) MV4-11 cells were crosslinked with 1% formaldehyde. Chromatin-protein complexes were immunoprecipitated with anti-CDK9, anti-mLST8, and anti-RAPTOR antibodies. Rabbit IgG and anti-RICTOR antibodies were used as negative controls. qPCR was performed on immunoprecipitated DNA with primers for the MYC and PIM1 promoters. Data are expressed as fold enrichment over the IgG control. Shown are means + standard error (SE) of 4 independent experiments. (B) Cells were treated with atuveciclib for 0, 1, 2, and 4 hours. Cells were then lysed, and proteins were resolved by SDS-PAGE, followed by transfer to PVDF membranes. Membranes were immunoblotted with the indicated antibodies. The immunoblots with antibodies against the phosphorylated forms of the proteins or against the total proteins were from lysates from the same experiments analyzed in parallel by SDS-PAGE. (C) Cells were treated with control (DMSO) or atuveciclib for 4 hours and lysed, and proteins resolved by SDS-PAGE followed by transfer to polyvinylidene fluoride membranes. Membranes were then immunoblotted with the indicated antibodies. *Nonspecific band in the c-MYC blot. (D) qRT-PCR analysis of the relative mRNA expression of MYC and PIM1 in U937 cells after atuveciclib treatment of 4 hours. GAPDH was used for normalization. Data are expressed as fold change over the control. Shown are means + SE of 3 independent experiments. **P < .01, ****P < .0001 using paired Student t test analysis. (E) qRT-PCR analysis of the relative mRNA expression of MYC and PIM1 in MV4-11 cells after atuveciclib treatment of 4 hours. GAPDH was used for normalization. Data are expressed as fold change over the control. Shown are means + SE of 4 independent experiments. **P < .01, using paired Student t test analysis. (F) qRT-PCR analysis of the relative mRNA expression of MYC and PIM1 in primary AML patient samples after incubation with atuveciclib for 4 hours. GAPDH was used for normalization. Data are expressed as fold change over the control. Shown are means + SE of 7 independent experiments using cells from 7 different AML patients. *P < .05, **P < .01 using paired Student t test analysis.
The CDK9/mLST8/RAPTOR nuclear complex regulates expression of genes important for leukemogenesis. (A) MV4-11 cells were crosslinked with 1% formaldehyde. Chromatin-protein complexes were immunoprecipitated with anti-CDK9, anti-mLST8, and anti-RAPTOR antibodies. Rabbit IgG and anti-RICTOR antibodies were used as negative controls. qPCR was performed on immunoprecipitated DNA with primers for the MYC and PIM1 promoters. Data are expressed as fold enrichment over the IgG control. Shown are means + standard error (SE) of 4 independent experiments. (B) Cells were treated with atuveciclib for 0, 1, 2, and 4 hours. Cells were then lysed, and proteins were resolved by SDS-PAGE, followed by transfer to PVDF membranes. Membranes were immunoblotted with the indicated antibodies. The immunoblots with antibodies against the phosphorylated forms of the proteins or against the total proteins were from lysates from the same experiments analyzed in parallel by SDS-PAGE. (C) Cells were treated with control (DMSO) or atuveciclib for 4 hours and lysed, and proteins resolved by SDS-PAGE followed by transfer to polyvinylidene fluoride membranes. Membranes were then immunoblotted with the indicated antibodies. *Nonspecific band in the c-MYC blot. (D) qRT-PCR analysis of the relative mRNA expression of MYC and PIM1 in U937 cells after atuveciclib treatment of 4 hours. GAPDH was used for normalization. Data are expressed as fold change over the control. Shown are means + SE of 3 independent experiments. **P < .01, ****P < .0001 using paired Student t test analysis. (E) qRT-PCR analysis of the relative mRNA expression of MYC and PIM1 in MV4-11 cells after atuveciclib treatment of 4 hours. GAPDH was used for normalization. Data are expressed as fold change over the control. Shown are means + SE of 4 independent experiments. **P < .01, using paired Student t test analysis. (F) qRT-PCR analysis of the relative mRNA expression of MYC and PIM1 in primary AML patient samples after incubation with atuveciclib for 4 hours. GAPDH was used for normalization. Data are expressed as fold change over the control. Shown are means + SE of 7 independent experiments using cells from 7 different AML patients. *P < .05, **P < .01 using paired Student t test analysis.
To determine whether regulation of CTORC1 is independent of mTOR, we next examined whether mTOR inhibition blocks CDK9 activity. Leukemic cells were treated with the mTORC1 inhibitor, rapamycin, or the dual catalytic inhibitor, vistusertib, that blocks both mTORC1 and mTORC2, and their effects on CDK9 phosphorylation/activation were assessed. Treatment of cells with either mTOR inhibitor did not affect phosphorylation of RNA polymerase II at serine 2 or T-loop phosphorylation of CDK9 at threonine 186, indicating that mTOR does not play a role in the regulation of CDK9 activity (supplemental Figure 1). In addition, we did not observe a significant downregulation of MYC or PIM1 mRNA expression with mTOR inhibition (supplemental Figure 1).
CDK9 regulates mRNA translation by controlling known mTORC1 targets
Few substrates of CDK9 are known beyond those associated with its role in transcriptional regulation. In order to identify phosphorylation events and uncover potential novel targets of CDK9, leukemic cells were treated with the CDK9 inhibitor, atuveciclib, followed by phosphoproteomic LC-MS/MS analysis (supplemental Table 4). Pathway and process enrichment analysis of all proteins whose phosphorylation was up- or downregulated by CDK9 inhibition was conducted to determine novel pathways regulated by CDK9 (Figure 4; supplemental Tables 5 and 6). Among the proteins whose phosphorylation was downregulated, the top 3 processes were all related to mRNA processing and splicing (Figure 4A). Some elements involved in mRNA processing were also upregulated in response to CDK9 inhibition, likely a consequence of compensatory mechanisms (Figure 4B). To uncover novel substrates of CDK9, we searched for proteins downregulated by atuveciclib in the phosphoproteomic analysis that also correspond to potential mLST8 and/or CDK9 putative protein binding partners. There were 13 proteins whose phosphorylation was suppressed upon CDK9 inhibition and also were found bound to mLST8 and/or CDK9, including the mTORC1 targets rpS6 and LARP1 (Figure 4C). CDK9 inhibition resulted in suppression of phosphorylation of rpS6 at serine 235/236 and serine 240/244 in the phosphoproteomic LC-MS/MS results (supplemental Table 4). This finding was confirmed by immunoblotting analyses of U937 and MV4-11 cell lysates after treatment with atuveciclib (Figure 5A). Notably, we did not observe effects on phosphorylation of the mTORC1 substrate and upstream regulator of rpS6, S6K, indicating that this effect of CDK9 inhibition of rpS6 phosphorylation is mTORC1 independent. Phosphoproteomic analysis revealed that CDK9 inhibition also results in inhibition of LARP1 phosphorylation at serine 526 (supplemental Table 4). LARP1 has been previously shown to be an mTORC1 effector and has been implicated as an important regulator of mRNA translation.43-46 It is important to note that the serine 526 site found altered in our phosphoproteomics results is a different phosphorylation site than those previously proposed to be regulated by mTORC1.47-49 We demonstrated an interaction between CDK9 and LARP1 through co-IP (Figure 5B-C). In addition, because we previously demonstrated an interaction between CDK9, SIN1, mLST8, and RICTOR in cytoplasmic fractions, we examined whether LARP1 is also bound to the cytoplasmic CTORC2 complex. In co-IP studies, we confirmed that LARP1 binds to SIN1, RICTOR, and mLST8 (Figure 5C), suggesting that LARP1 is directly regulated by CDK9 and mediates downstream mRNA translation of target genes.
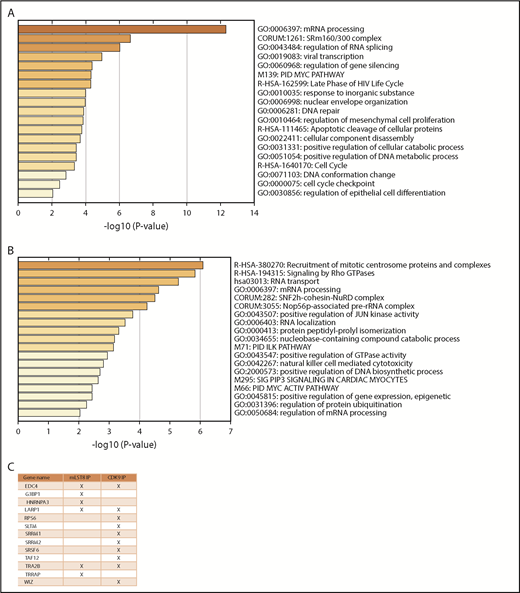
CDK9 regulates phosphorylation of proteins involved in mRNA processing and splicing. (A) MV4-11 cells were treated with atuveciclib for 1 hour and then analyzed for global phosphorylation changes, using phosphoproteomic LC-MS/MS. Proteins that exhibited significant downregulation of phosphorylation upon atuveciclib treatment were annotated using Metascape. The heat map identifies the pathways most significantly affected. (B) MV4-11 cells were treated with atuveciclib for 1 hour, and then global phosphorylation changes were analyzed using phosphoproteomic LC-MS/MS. Proteins that exhibited significant upregulation of phosphorylation upon atuveciclib treatment were annotated using Metascape. The heat map identifies the pathways most significantly affected. (C) List of proteins whose phosphorylation status was downregulated by atuveciclib treatment and were also identified as potential binders to either mLST8 or CDK9.
CDK9 regulates phosphorylation of proteins involved in mRNA processing and splicing. (A) MV4-11 cells were treated with atuveciclib for 1 hour and then analyzed for global phosphorylation changes, using phosphoproteomic LC-MS/MS. Proteins that exhibited significant downregulation of phosphorylation upon atuveciclib treatment were annotated using Metascape. The heat map identifies the pathways most significantly affected. (B) MV4-11 cells were treated with atuveciclib for 1 hour, and then global phosphorylation changes were analyzed using phosphoproteomic LC-MS/MS. Proteins that exhibited significant upregulation of phosphorylation upon atuveciclib treatment were annotated using Metascape. The heat map identifies the pathways most significantly affected. (C) List of proteins whose phosphorylation status was downregulated by atuveciclib treatment and were also identified as potential binders to either mLST8 or CDK9.
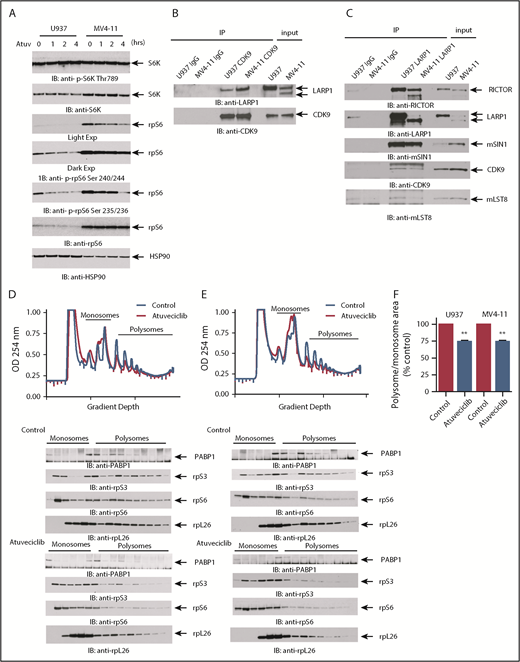
CDK9 regulates mTORC1 targets independently of mTOR and regulates mRNA translation. (A) U937 and MV4-11 cells were treated with atuveciclib for 0, 1, 2, and 4 hours and lysed, and proteins were resolved by SDS-PAGE followed by immunoblotting with the indicated antibodies. The immunoblots with antibodies against the phosphorylated forms of the proteins or against the total proteins were from lysates from the same experiments analyzed in parallel by SDS-PAGE. (B) Lysates from cytoplasmic fractions of U937 and MV4-11 cells were immunoprecipitated by CDK9- or Rabbit IgG preconjugated beads. Immunoprecipitated proteins were resolved by SDS-PAGE and immunoblotted with the indicated antibodies. (C) Lysates from U937 and MV4-11 cells were immunoprecipitated using an anti-LARP1 antibody or Rabbit IgG. Immunoprecipitated proteins were resolved by SDS-PAGE and immunoblotted with the indicated antibodies. U937 (D) and MV4-11 (E) cells were treated with control (DMSO) or atuveciclib for 2 hours, and cell lysates were separated on 10% to 50% sucrose gradients. Gradients were subjected to ultracentrifugation, and fractions were collected by continuous monitoring of optical density (OD) at 254 nm. The OD 254 nm is shown as a function of gradient depth. A representative profile of 1 of 3 independent experiments is shown. Monosomal and polysomal fractions were resolved by SDS-PAGE and immunoblotted with the indicated antibodies (lower panels). (F) The areas under the polysomal and monosomal peaks were quantified using ImageJ software. The ratio of area under the polysomal over the monosomal peaks was calculated for atuveciclib and is represented as percent control (DMSO). Shown are means + SE of 3 independent experiments. **P < .01 using a paired Student t test.
CDK9 regulates mTORC1 targets independently of mTOR and regulates mRNA translation. (A) U937 and MV4-11 cells were treated with atuveciclib for 0, 1, 2, and 4 hours and lysed, and proteins were resolved by SDS-PAGE followed by immunoblotting with the indicated antibodies. The immunoblots with antibodies against the phosphorylated forms of the proteins or against the total proteins were from lysates from the same experiments analyzed in parallel by SDS-PAGE. (B) Lysates from cytoplasmic fractions of U937 and MV4-11 cells were immunoprecipitated by CDK9- or Rabbit IgG preconjugated beads. Immunoprecipitated proteins were resolved by SDS-PAGE and immunoblotted with the indicated antibodies. (C) Lysates from U937 and MV4-11 cells were immunoprecipitated using an anti-LARP1 antibody or Rabbit IgG. Immunoprecipitated proteins were resolved by SDS-PAGE and immunoblotted with the indicated antibodies. U937 (D) and MV4-11 (E) cells were treated with control (DMSO) or atuveciclib for 2 hours, and cell lysates were separated on 10% to 50% sucrose gradients. Gradients were subjected to ultracentrifugation, and fractions were collected by continuous monitoring of optical density (OD) at 254 nm. The OD 254 nm is shown as a function of gradient depth. A representative profile of 1 of 3 independent experiments is shown. Monosomal and polysomal fractions were resolved by SDS-PAGE and immunoblotted with the indicated antibodies (lower panels). (F) The areas under the polysomal and monosomal peaks were quantified using ImageJ software. The ratio of area under the polysomal over the monosomal peaks was calculated for atuveciclib and is represented as percent control (DMSO). Shown are means + SE of 3 independent experiments. **P < .01 using a paired Student t test.
In further studies, we examined the effects of CDK9 inhibition on mRNA translation, using polysomal profiling analysis of leukemia cell lysates. CDK9 inhibition resulted in the accumulation of monosomal fractions and suppression of polysomal fractions in both U937 and MV4-11 cells (Figure 5D-F). Consistent with a suppression of polysome formation, we also found that the sedimentation of several ribosomal proteins, such as rpS3, rpS6, and rpL26 (Figure 5D), was also dependent on CDK9 activity. We also observed decreased levels of the RNA binding protein PABP1 in monosomal and polysomal fractions (Figure 5D). Because previous studies have demonstrated that LARP1 binds to PABP1 and controls recruitment of PABP1 to the ribosomal machinery,45 these studies suggest that CDK9 phosphorylation of LARP1 is required for the recruitment of PABP1 to ribosomes. We investigated whether the translation of MYC, and PIM1, as well the housekeeping genes 18S, ACTB, and HPRT1, is being affected by CDK9 inhibition (supplemental Figure 2). We do not observe significant changes in the mRNA found in the polysomal fractions compared with total mRNA expression of any of the genes we examined. This indicates that global translation is not being inhibited. In addition, this suggests that the major mechanism of CDK9 inhibition on MYC and PIM1 expression is at the transcriptional level.
To further address the interplay of mTOR and CDK9 complexes and their role in the regulation of translation, we combined CDK9 and mTOR inhibition and performed polysomal profiling analysis. Atuveciclib in combination with the mTORC1 inhibitor, rapamycin, resulted in significant further suppression of translation compared with either inhibitor alone (supplemental Figure 3). In addition, combining atuveciclib with the dual catalytic inhibitor vistusertib also demonstrated significant enhanced suppression of translation compared with either inhibitor alone (supplemental Figure 3).
CDK9 inhibition results in potent antileukemic responses in vitro and in vivo
In subsequent studies, we examined the effects of CDK9 inhibition on leukemic cell proliferation and survival. We first investigated the effects of atuveciclib on the viability of several leukemia cell lines. CDK9 inhibition resulted in potent suppressive effects, with half maximal inhibitory concentration (IC50) values of cell viability at sub-µmolar doses in all of the cell lines tested (Figure 6A). Using flow cytometry, we observed a significant increase in annexin V/propidium iodide (PI) staining after atuveciclib treatment of leukemia cells, indicative of apoptosis (Figure 6B). The induction of apoptosis by atuveciclib was also demonstrated by immunoblotting with antibodies to detect cleaved caspase 3 and cleaved PARP (Figure 6C). Furthermore, atuveciclib exerted suppressive effects on U937-, MV4-11-, Kasumi-1-, and KG-1-derived CFU-L (Figure 6D; supplemental Figure 4). Importantly, treatment with atuveciclib elicited potent suppressive effects on primitive leukemic precursors from patients with AML (Figure 6E). Specific small interfering RNA–mediated knockdown of CDK9 resulted in suppression of KG-1- and HEL-derived colony formation, consistent with the effects of atuveciclib (supplemental Figure 5). In addition, atuveciclib in combination with rapamycin resulted in synergistic suppression of cell viability in U937, KG-1, and MV4-11 cells (supplemental Figure 6A). Synergistic suppression of cell viability was also observed when atuveciclib was combined with the catalytic inhibitor vistusertib in U937 and KG-1 cells (supplemental Figure 6B), whereas only additive effects were observed in MV4-11 cells (supplemental Figure 6B).
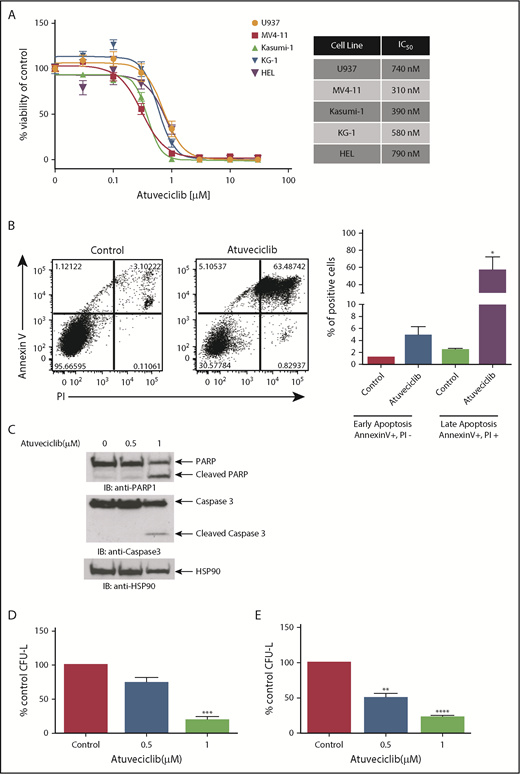
Antileukemic properties of atuveciclib in vitro. (A) The indicated AML cell lines were seeded in 96-well plates and treated with increasing concentrations of atuveciclib for 4 days. Viability was assessed using a WST-1 assay. Data are expressed as a percentage of DMSO control-treated cells. Shown are the means ± SE of at least 3 independent experiments. IC50 values are shown to the right. (B) U937 cells were treated for 48 hours with control (DMSO) or atuveciclib (1 μM), and apoptosis was assessed using flow cytometry, for Annexin V and PI staining. The left panel shows a representative flow cytometry plot. The right panel shows quantitation of the Annexin V–positive and PI-negative and double-positive Annexin V and PI-stained cells. Shown are the means + SE of 4 independent experiments. *P < .05 using a paired Student t test. (C) U937 cells were incubated with vehicle or atuveciclib at the indicated doses for 48 hours. Proteins from whole cell lysates were resolved by SDS-PAGE and immunoblotted with the indicated antibodies. (D) The effects of atuveciclib (0.5 µM and 1 µM) on U937-derived leukemic progenitors were assessed in clonogenic assays in methylcellulose. Effects on CFU-L CFU-L are shown. Data shown are the means + SE of 4 different experiments. ***P < .001 using a paired Student t test. (E) The effects of atuveciclib (0.5 µM and 1 µM) on CFU-L from different patients with AML were assessed in clonogenic assays in methylcellulose. Shown are the mean + SE of 5 independent experiments using cells from 5 different AML patients. **P < .01, ****P < .0001 using a paired Student t test.
Antileukemic properties of atuveciclib in vitro. (A) The indicated AML cell lines were seeded in 96-well plates and treated with increasing concentrations of atuveciclib for 4 days. Viability was assessed using a WST-1 assay. Data are expressed as a percentage of DMSO control-treated cells. Shown are the means ± SE of at least 3 independent experiments. IC50 values are shown to the right. (B) U937 cells were treated for 48 hours with control (DMSO) or atuveciclib (1 μM), and apoptosis was assessed using flow cytometry, for Annexin V and PI staining. The left panel shows a representative flow cytometry plot. The right panel shows quantitation of the Annexin V–positive and PI-negative and double-positive Annexin V and PI-stained cells. Shown are the means + SE of 4 independent experiments. *P < .05 using a paired Student t test. (C) U937 cells were incubated with vehicle or atuveciclib at the indicated doses for 48 hours. Proteins from whole cell lysates were resolved by SDS-PAGE and immunoblotted with the indicated antibodies. (D) The effects of atuveciclib (0.5 µM and 1 µM) on U937-derived leukemic progenitors were assessed in clonogenic assays in methylcellulose. Effects on CFU-L CFU-L are shown. Data shown are the means + SE of 4 different experiments. ***P < .001 using a paired Student t test. (E) The effects of atuveciclib (0.5 µM and 1 µM) on CFU-L from different patients with AML were assessed in clonogenic assays in methylcellulose. Shown are the mean + SE of 5 independent experiments using cells from 5 different AML patients. **P < .01, ****P < .0001 using a paired Student t test.
Next, we examined whether CDK9 inhibition enhances the antileukemic properties of cytarabine, a key component of the standard chemotherapy regimen used for the treatment of AML patients. The combination of atuveciclib and cytarabine led to more potent inhibitory effects on CFU-L growth than with either agent alone (Figure 7A-B). Employing a mouse AML xenograft model, we undertook studies to determine whether CDK9 inhibition might similarly enhance the effects of cytarabine in vivo. MV4-11 cells were injected subcutaneously into nude mice. Once tumors reached a measurable size, mice were randomized, based on tumor volume, to the following treatment groups: vehicle, atuveciclib alone, cytarabine alone, or atuveciclib plus cytarabine. Mice treated with the combination of cytarabine and atuveciclib exhibited the greatest degree of tumor suppression and enhanced survival (Figure 7C-D). Treatment with atuveciclib or the combination significantly suppressed xenograft growth when compared with the vehicle control (P < .0001 for both atuveciclib alone and the combination, using a 2-way analysis of variance [ANOVA]). The combination of atuveciclib plus cytarabine was significantly more effective than either agent alone (P = .0338 vs atuveciclib; P < .0001 vs cytarabine, using a 2-way ANOVA). In addition, the survival of mice treated with atuveciclib (P = .0089) or the combination treatment was significantly prolonged compared with that for mice that received vehicle control treatment (P = .0021), using a Log-rank Mantel-Cox test. Only the combination treatment group’s survival was significantly prolonged compared with the cytarabine alone group (P = .0198, using a Log-rank Mantel-Cox test) (Figure 7D). The survival difference between the combination and atuveciclib groups was not statistically significant but showed a trend toward significance. At study completion, 1 of the mice in the atuveciclib group and 2 of the mice in the combination group had no evidence of tumors.
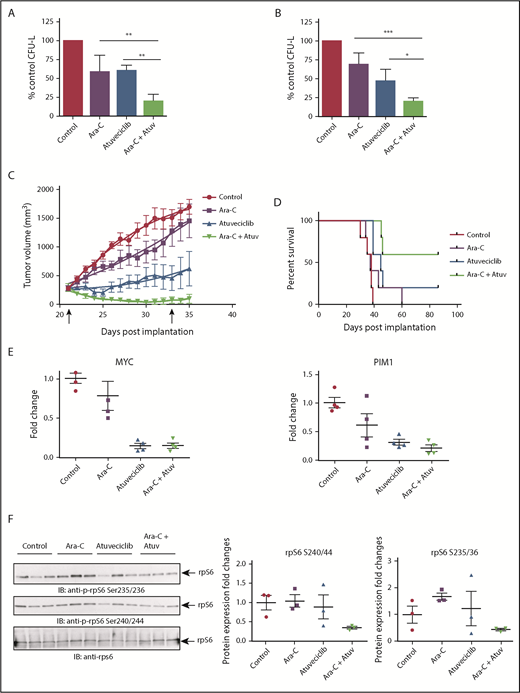
CDK9 inhibition enhances the suppressive effects of cytarabine in vitro and in vivo. (A) U937 cells were plated in methylcellulose in the presence of control (DMSO), atuveciclib (Atuv; 0.5 µM), or cytarabine (Ara-C; 5 ng/mL), or a combination of atuveciclib and cytarabine for 7 days. CFU-L was assessed in clonogenic assays in methylcellulose. Data are expressed as a percentage of DMSO control-treated cells. Shown are the means + SE of 4 independent experiments. **P < .01 using a 1-way ANOVA with Tukey’s multiple comparisons test. (B) MV4-11 cells were seeded in methylcellulose in the presence of control (DMSO), atuveciclib (0.3 µM), or cytarabine (10 ng/mL) or a combination of atuveciclib and cytarabine, for 7 days. CFU-L was assessed in clonogenic assays in methylcellulose. Data are expressed as a percentage of DMSO control-treated cells. Shown are the means + SE of 4 independent experiments. *P < .5, ***P < .001 using a 1-way ANOVA with Tukey’s multiple comparisons test. (C) Tumor volumes from an AML xenograft model are shown. MV4-11 cells were subcutaneously injected into the left flank of athymic nude mice. Once mice had measurable tumors, mice were randomized into 5 animals per group treated with control, cytarabine, atuveciclib, and the combination of atuveciclib and cytarabine. Mice were treated for a total of 12 days (days 21-33 postinjection). Start and end of treatment are indicated by arrows on the graph. (D) Survival analysis of mice that are described in panel C. Survival was determined as time to euthanasia. (E) For analysis of CDK9 target gene expression after treatment, a separate cohort of mice was treated as described in panel C for 3 days. Tumors were harvested and frozen, and then RNA was extracted. Gene expression for MYC, and PIM1 was measured by qRT-PCR, using GAPDH for normalization. Data are expressed as fold increase over the average of the expression levels in tumors from control mice, and shown are means + SE of 4 separate mice per group. (F) Immunoblotting analyses for p-rpS6 detection were conducted on frozen tumor lysates from a separate cohort of mice treated as per panel C for 3 days. Cell lysates from tumors for the indicated treatment conditions were analyzed by SDS-PAGE and immunoblotted with the indicated antibodies. The immunoblots with antibodies against the phosphorylated forms of rpS6 or against total rpS6 were analyzed in parallel by SDS-PAGE. Densitometry was performed and calculated using the total rpS6 for each respective mouse for normalization. Each lane represents an individual tumor.
CDK9 inhibition enhances the suppressive effects of cytarabine in vitro and in vivo. (A) U937 cells were plated in methylcellulose in the presence of control (DMSO), atuveciclib (Atuv; 0.5 µM), or cytarabine (Ara-C; 5 ng/mL), or a combination of atuveciclib and cytarabine for 7 days. CFU-L was assessed in clonogenic assays in methylcellulose. Data are expressed as a percentage of DMSO control-treated cells. Shown are the means + SE of 4 independent experiments. **P < .01 using a 1-way ANOVA with Tukey’s multiple comparisons test. (B) MV4-11 cells were seeded in methylcellulose in the presence of control (DMSO), atuveciclib (0.3 µM), or cytarabine (10 ng/mL) or a combination of atuveciclib and cytarabine, for 7 days. CFU-L was assessed in clonogenic assays in methylcellulose. Data are expressed as a percentage of DMSO control-treated cells. Shown are the means + SE of 4 independent experiments. *P < .5, ***P < .001 using a 1-way ANOVA with Tukey’s multiple comparisons test. (C) Tumor volumes from an AML xenograft model are shown. MV4-11 cells were subcutaneously injected into the left flank of athymic nude mice. Once mice had measurable tumors, mice were randomized into 5 animals per group treated with control, cytarabine, atuveciclib, and the combination of atuveciclib and cytarabine. Mice were treated for a total of 12 days (days 21-33 postinjection). Start and end of treatment are indicated by arrows on the graph. (D) Survival analysis of mice that are described in panel C. Survival was determined as time to euthanasia. (E) For analysis of CDK9 target gene expression after treatment, a separate cohort of mice was treated as described in panel C for 3 days. Tumors were harvested and frozen, and then RNA was extracted. Gene expression for MYC, and PIM1 was measured by qRT-PCR, using GAPDH for normalization. Data are expressed as fold increase over the average of the expression levels in tumors from control mice, and shown are means + SE of 4 separate mice per group. (F) Immunoblotting analyses for p-rpS6 detection were conducted on frozen tumor lysates from a separate cohort of mice treated as per panel C for 3 days. Cell lysates from tumors for the indicated treatment conditions were analyzed by SDS-PAGE and immunoblotted with the indicated antibodies. The immunoblots with antibodies against the phosphorylated forms of rpS6 or against total rpS6 were analyzed in parallel by SDS-PAGE. Densitometry was performed and calculated using the total rpS6 for each respective mouse for normalization. Each lane represents an individual tumor.
A smaller cohort of mice was treated for molecular analysis; their flank tumors were harvested, and qRT-PCR was performed to assess c-MYC and PIM1 expression levels (Figure 7E). We observed significant downregulation of expression of MYC in tumors from mice treated with atuveciclib (P = .0003) and the combination (P = .0003) compared with tumors from vehicle-treated mice, and significant downregulation among tumors from mice treated with atuveciclib (P = .0038) and combination (P = .0040) compared with tumors from mice treated with cytarabine alone, using a 1-way ANOVA (Figure 7E). We also observed significant downregulation of expression of PIM1 in tumors from mice treated with atuveciclib (P = .0057) and the combination (P = .0020) compared with tumors harvested from vehicle-treated mice (P = .0003), using a 1-way ANOVA (Figure 7E). In a final series of experiments, total cell protein lysates were prepared and immunoblotted for rpS6 phosphorylation. Consistent decreases in rpS6 phosphorylation at serine 235/236 and serine 240/244 were noted in tumors harvested from mice treated with the combination of atuveciclib and cytarabine therapy compared with tumors harvested from mice treated with either drug alone or the vehicle control (Figure 7F).
Discussion
Our study provides the first evidence that CDK9 forms novel CTORC complexes (CTORC1 and CTORC2) by associating with elements of mTOR pathways. Our findings expand the roles of both mLST8 and CDK9 in cellular signaling. In the case of mLST8, a protein previously identified only as a scaffold for mTOR complexes, we now show that it binds another kinase, CDK9, thereby enhancing both transcription and translation. Future studies that interrogate the role of other interactors identified by proteomics analysis in the current study may expand further the role of mLST8 in cellular processes independent of mTOR. Notably, the mLST8 knockout mice exhibit a phenotype distinct from the mTOR knockout mice,50 suggesting that mLST8’s major cellular functions may be mTOR independent.
Our studies have confirmed previous findings that CDK9 regulates the transcription of the critical oncogene, c-MYC. In addition, we report that CDK9 controls the transcription of the PIM1 kinase gene, which is an important therapeutic target in leukemia. Other PIM- and MYC-driven cancers, such as prostate cancer, breast cancer, and certain lymphoma subtypes,51-53 may therefore be good candidates for clinical trials involving CDK9 inhibition, and other future approaches that may be developed to disrupt CTORC complexes. Our findings also establish for the first time that the mTORC1 components mLST8 and RAPTOR are present in CDK9 complexes at gene promoter sites. This suggests that the CTORC complex comprising mLST8/RAPTOR/CDK9 may play an important role in the transcription of certain oncogenes. Our findings suggest that CTORC1 functions independently of mTOR. This is consistent with previous studies that had shown that although RAPTOR is found in the nucleus, there is no significant mTORC1 formation, consistent with a mTORC1-independent role for RAPTOR in the nucleus.54
The functional consequences of disruption of the CTORC1 (mLST8/RAPTOR/CDK9) complex are currently unknown. In future studies, mutation analysis will be critical to determine the residues required for complex formation. This should also help guide the design of protein-protein interaction inhibitors that specifically disrupt CDK9/mLST8/RAPTOR complexes, providing alternative means to affect specific functions of CDK9-driven transcription without kinase inhibition. This may lead to less toxicity, because potentially only the oncogenic functions of CDK9 would be inhibited without effects on CDK9’s function in nonmalignant cells.
In the cytoplasm, we show a novel role for CDK9 in the regulation of translation. CDK9 forms a complex with mTORC2 components and regulates phosphorylation of LARP1 and rpS6. Previous studies have focused solely on CDK9’s role in transcription; however, CDK9 protein is present in both cytoplasmic and nuclear fractions. Based on our studies, CDK9 appears to play a key role in oncogenic cellular processes as it has regulatory effects on both gene transcription and mRNA translation in leukemic cells. Our data demonstrate that CDK9 inhibition leads to an accumulation of monosomal fractions and a decrease in polysome formation, indicating a stalling of the translation machinery leading to lower translation efficiency. High translation efficiency is critical for many oncogenic processes.55 We did not see effects on global translation because MYC, PIM1, and the housekeeping genes 18S, ACTB, and HPRT1 were not affected by CDK9 inhibition. Future studies are required to determine what pools of RNAs are regulated by CDK9. Recent work by Shi et al proposed that distinct pools of ribosomes have differential selectivity for translating RNAs based on their subunit composition.56 In future studies, it will be important to determine if CTORC and mTORC complexes associate with the same or different subsets of ribosomes and whether this correlates with control of translation of distinct mRNAs.
Results from the LC-MS/MS studies indicate that CDK9 may regulate many other proteins involved in RNA processing and splicing. Recent evidence has shown that aberrant splicing due to multiple mutations in the splicing pathway genes in myelodysplastic syndromes and AML constitutes an important pathophysiologic mechanism.57-60 In the current study, the role of CDK9 in splicing was not fully evaluated, but future studies should address this. This would be particularly relevant, because CDK9 inhibition in both MDS and AML could potentially provide a unique therapeutic strategy to target aberrant splicing.
Unexpectedly, although the cytoplasmic CTORC2 complex seems to function similarly to mTORC1, it is comprised of CDK9 in complexes with known mTORC2 components. Therefore, targeting of both CDK9 and mTOR complexes may be critical to prevent complex compensating for the other and could lead to the development of more effective therapeutic approaches for the treatment of malignancies.
In summary, our findings provide evidence that CDK9 forms 2 distinct cellular complexes that play key roles in mRNA transcription and translation of mitogenic genes and leukemogenesis. Efforts to therapeutically target these 2 complexes may ultimately lead to advances in the treatment of AML and possibly other malignancies.
The online version of this article contains a data supplement.
The publication costs of this article were defrayed in part by page charge payment. Therefore, and solely to indicate this fact, this article is hereby marked “advertisement” in accordance with 18 USC section 1734.
Acknowledgments
The authors thank Alfred Rademaker from the Lurie Cancer Center Biostatistics core for his consultation on statistical analysis of the data.
This work was supported in part by National Institutes of Health, National Cancer Institute (NCI) grants CA121192, CA77816, and CA189074 and by grant I01CX000916 from the Department of Veterans Affairs. This work was also supported by the Lurie Cancer Center Flow Cytometry Core Facility, by the Northwestern Proteomics Core Facility via the Robert H. Lurie Comprehensive Cancer Center Support grant (NCI CA060553), and by funds from the Vassilatos Foundation.
Authorship
Contribution: E.M.B. and L.C.P. designed research; E.M.B., G.T.B., S.M.A., A.Y., C.L., S.G.R., A.N., A.D.A., O.F., I.A., M.F., and J.K.A. performed research; E.M.B., S.M.A., A.N., E.A.E., Y.A.G., P.M.T., E.N.F., and L.C.P. analyzed data/interpreted experimental results; and E.M.B., S.M.A., E.N.F., and L.C.P. wrote/edited the manuscript.
Conflict-of-interest disclosure: J.K.A. serves on a data safety and monitoring committee for GlycoMimetics and has served on advisory boards for Syros, Astellas, Janssen, Novartis, Seattle Genetics, Spectrum, Ariad, BMS, Immune Pharmaceuticals, Agios, and Celgene. The remaining authors declare no competing financial interests.
Correspondence: Leonidas C. Platanias, Robert H. Lurie Comprehensive Cancer Center, Northwestern University, 303 E Superior St, Lurie 3-125, Chicago, IL 60611; e-mail: l-platanias@northwestern.edu.

This feature is available to Subscribers Only
Sign In or Create an Account Close Modal