

Key Points
Malignant follicular lymphoma B cells segregate into multiple coexisting subclones, characterized by differential pathway activities.
In CD4+ Tregs, known immune checkpoint genes are coexpressed with transcription factors and immune regulators, including CEBPA and B2M.

Abstract
Follicular lymphoma (FL) is a low-grade B-cell malignancy that transforms into a highly aggressive and lethal disease at a rate of 2% per year. Perfect isolation of the malignant B-cell population from a surgical biopsy is a significant challenge, masking important FL biology, such as immune checkpoint coexpression patterns. To resolve the underlying transcriptional networks of follicular B-cell lymphomas, we analyzed the transcriptomes of 34 188 cells derived from 6 primary FL tumors. For each tumor, we identified normal immune subpopulations and malignant B cells, based on gene expression. We used multicolor flow cytometry analysis of the same tumors to confirm our assignments of cellular lineages and validate our predictions of expressed proteins. Comparison of gene expression between matched malignant and normal B cells from the same patient revealed tumor-specific features. Malignant B cells exhibited restricted immunoglobulin (Ig) light chain expression (either Igκ or Igλ), as well the expected upregulation of the BCL2 gene, but also downregulation of the FCER2, CD52, and major histocompatibility complex class II genes. By analyzing thousands of individual cells per patient tumor, we identified the mosaic of malignant B-cell subclones that coexist within a FL and examined the characteristics of tumor-infiltrating T cells. We identified genes coexpressed with immune checkpoint molecules, such as CEBPA and B2M in regulatory T (Treg) cells, providing a better understanding of the gene networks involved in immune regulation. In summary, parallel measurement of single-cell expression in thousands of tumor cells and tumor-infiltrating lymphocytes can be used to obtain a systems-level view of the tumor microenvironment and identify new avenues for therapeutic development.
Introduction
Follicular lymphoma (FL) initially presents as an indolent malignancy that frequently transforms to a more aggressive tumor. Multiple relapses after treatment are common, and responses to chemotherapy and immunotherapy are often transient. Mutations in genes for histone-modifying enzymes such as CREBBP and MLL2 are early founding events of the malignant clones in this disease.1,2 Accumulating evidence suggests that a small subpopulation within some FL tumors is responsible for the aggressive subtype,3,4 and that extended survival is associated with a transcriptional signature of increased cytotoxic T cells and fewer myeloid cells in the surrounding tumor microenvironment.3,4 Thus, a more complete understanding of the diversity of the tumor cellular population and the immune microenvironment in early tumor evolution may reveal opportunities for intervention.
Recently, single-cell RNA sequencing (scRNA-Seq) technologies have matured such that one can sequence and analyze thousands of cells per tumor. At this scale, one can derive significant insights into a tumor’s cellular heterogeneity, characteristics of the cellular diversity in the local tumor microenvironment, and the biological features that distinguish different cell populations.5-12 Moreover, given that bulk tumor transcriptomes can identify therapeutic sensitivity,13 scRNA-Seq has the potential to improve treatment efficacy predictions by revealing differences among the transcriptomes of coexisting tumor subpopulations.
Our primary objective was the identification and characterization of coexisting cell populations within a biopsy. To achieve this goal, we conducted scRNA-Seq analysis of 6 de novo FL tumors that were previously cryopreserved as viable single-cell suspensions from surgical biopsies. Overall, we sequenced a total of 34 188 single-cell transcriptomes from these 6 tumors. We leveraged these transcriptome-wide features to distinguish individual normal B cells from malignant B cells, and malignant B cell subclones from each other. The precise classification of these B-cell subsets allowed comparison of tumor-specific gene expression while eliminating the uncertainty associated with previous methods of enriching FL tumor B cells (ie, by light-chain enrichment). Applying multicolor fluorescence-activated cell sorting (FACS), we validated the frequencies of cell types found in the tumor’s microenvironment. Finally, we measured immune checkpoint coexpression patterns among infiltrating T cells.
Methods
Full descriptions of analytical methods and experimental procedures are found under supplemental Information, available on the Blood Web site. The data sets generated and/or analyzed during the current study are available in the National Institutes of Health dbGAP repository, identifier phs001378.
Sample collection and single-cell preparation
Six follicular lymphoma tumor specimens, 2 peripheral blood mononuclear cell (PBMC) specimens, and 2 tonsil specimens were obtained with informed consent per an approved Stanford University Institutional Review Board. All FL and tonsil samples were obtained as surgical biopsies and mechanically dissociated into single-cell suspensions. Samples were cryopreserved as single-cell suspensions in RPMI with 20% fetal bovine serum plus 10% dimethyl sulfoxide in liquid nitrogen. The single-cell suspension used for scRNA-Seq was washed twice with phosphate-buffered saline containing 0.04% bovine serum albumin, and the final cell concentration was adjusted to ∼1000 cells/μL. Cells used for flow cytometry were washed with phosphate-buffered saline containing 0.02% bovine serum albumin and then stained for surface markers.
Single-cell RNA-library construction and sequencing
We used the Chromium instrument and the Single Cell 3′ Reagent kit (V1) to prepare individually barcoded single-cell RNA-Seq libraries following the manufacturer’s protocol (10X Genomics). For quality control and to quantify the library concentration, we used both the BioAnalyzer (Agilent BioAnalyzer High Sensitivity Kit) and quantitative polymerase chain reaction (Kapa Quantification kit for Illumina Libraries). Sequencing with dual indexing was conducted on an Illumina NextSeq machine, using the 150-cycle High Output kit. Sample demultiplexing, barcode processing, and single-cell 3′ gene counting were performed with the Cell Ranger Single Cell Software Suite CR2.0.1. Each droplet partition’s contents were tagged with a unique molecule identifier, a barcode encoded as the second read of each sequenced read-pair.
Assigning sequenced single cells to hematopoietic lineages
We used scRNA-Seq data obtained from 8 bead-enriched immune lineages (BEILs)5 isolated from a healthy, previously published PBMC specimen5 to build a reference profile for lineage classification of tumor-derived cells. Within each BEIL, we grouped cells into clusters to obtain between 7 and 8 representatives of each lineage. For each patient with FL, we calculated the Spearman correlation coefficient between genes expressed in each BEIL and in each single cell. Each single cell was assigned to the BEIL whose representative had the highest correlation to the cell. In addition, we deployed a second classification tier for cells assigned to a T-cell population. Namely, we identified clusters of T cells in gene expression space as described in supplemental Methods and compared each cluster with T-cell BEILs.
Intrasample B-cell differential gene expression
We used Seurat14 version 2.3.4 to identify differentially expressed genes between tumor and normal B cells detected within the same FL sample. We compared each cluster of quiescent malignant B cells with sample-matched normal B cells. Only groups of cells with identical sample origin were compared. For each comparison, we used 2 different models: Model-based Analysis of Single-cell Transcriptomics (MAST)15 and a standard area under the curve (AUC) classifier implemented by Seurat, each time accounting for variability in gene coverage across cells.
Flow cytometry gating and quantification of hematopoietic cell types
Cells were obtained from the same cryopreserved aliquots of the 6 FLs, 2 healthy tonsils, and 2 healthy PBMCs. The cells were stained with 4 panels of 13 antibodies each for flow cytometry and then analyzed on a 17-parameter LSR-II flow instrument (BD Biosciences). The cells were manually assigned to 8 hematopoietic lineages based on the specific expression of known markers for these lineages (CD3, CD4, CD8, CD11b, CD11c, CD19, CD14, CD25, CD33, CD45RO, FoxP3, CD56, Igλ, and HLA-DR).
Characterization of B-cell intratumor heterogeneity
Bulk exome-sequencing of malignant B cells and sample-matched T cells had been performed for all 6 FLs as part of a prior study.16 This data revealed between 178 and 1549 somatic mutations in coding regions, overlapping with between 104 and 763 expressed genes per each FL’s B-cell population. We used the scRNA-Seq data of each FL’s quiescent, malignant B cells to project the expression of each corresponding set of mutated genes onto 4 to 5 principal components (PCs). These PCs were used as input for the subsequent t-distributed stochastic neighbor embedding (tSNE) projection17,18 and clustering, whereby cells were clustered in PC space to identify coexisting subclones (supplemental Methods). We used gene set variation analysis (GSVA)19 to identify differentially activated pathways among coexistent tumor B-cell subclones (supplemental Methods).
Results
ScRNA-Seq identifies multiple hematopoietic cell lineages within samples
We used the 10X Chromium platform to obtain single-cell transcriptomes of 6 FL biopsies (supplemental Table 1) and 4 control specimens from healthy individuals (2 tonsil and 2 PBMC specimens). ScRNA-Seq data were available from a third published PBMC specimen, as well as from 8 BEILs5 initially isolated from this PBMC.5 This PBMC sample was included as additional control, yielding a total of 5 control specimens for analysis (supplemental Table 3). We analyzed 34 188 cells from the 6 FL primary tumors and 22 077 from the 5 control specimens (Figure 1). Overall, this analysis generated an average of 86 580 reads per cell.
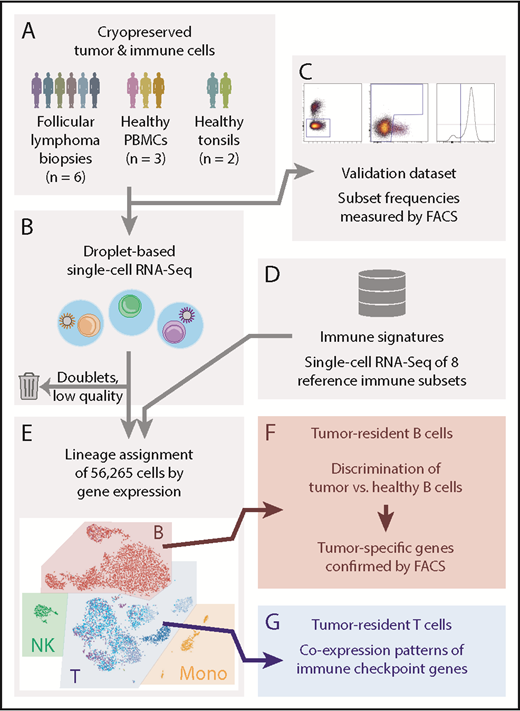
Single-cell RNA-Seq analysis and validation strategy. (A-B) Cryopreserved cells from dissociated FL tumor biopsies from 6 patients, 3 PBMC donors, and 2 healthy tonsil donors (A), were measured by droplet-based scRNA-Seq, capturing an average of 1951 to 8560 cells per sample (B). Low-quality cells and technical artifacts were identified algorithmically and discarded. (C) A portion of the same aliquots of each sample was measured by multicolor flow cytometry (FACS) to validate immune and tumor subset frequencies observed by scRNA-Seq. (D-E) Published immune signatures for 8 purified immune subsets (D) were used to assign lineages (E) to each cell based on gene expression. (F) Tumor-infiltrating normal and tumor-derived B cells had distinct gene expression profiles. Tumor-specific candidate genes were characterized by FACS on additional cryopreserved aliquots of the tumor biopsies, yielding tumor-specific expression at the protein level. (G) The scRNA-Seq data of tumor-infiltrating T cells revealed the landscape of immune checkpoint gene coexpression.
Single-cell RNA-Seq analysis and validation strategy. (A-B) Cryopreserved cells from dissociated FL tumor biopsies from 6 patients, 3 PBMC donors, and 2 healthy tonsil donors (A), were measured by droplet-based scRNA-Seq, capturing an average of 1951 to 8560 cells per sample (B). Low-quality cells and technical artifacts were identified algorithmically and discarded. (C) A portion of the same aliquots of each sample was measured by multicolor flow cytometry (FACS) to validate immune and tumor subset frequencies observed by scRNA-Seq. (D-E) Published immune signatures for 8 purified immune subsets (D) were used to assign lineages (E) to each cell based on gene expression. (F) Tumor-infiltrating normal and tumor-derived B cells had distinct gene expression profiles. Tumor-specific candidate genes were characterized by FACS on additional cryopreserved aliquots of the tumor biopsies, yielding tumor-specific expression at the protein level. (G) The scRNA-Seq data of tumor-infiltrating T cells revealed the landscape of immune checkpoint gene coexpression.
We used a curated set of 7 biological and technical features (“Methods”) to detect and remove low-quality cells.20 Specifically, we removed cells that had lost transcripts before cell lysis or multiplets. This resulted in the overall exclusion of 4519 (8.03%) cells, representing 5% to 21% per sample (supplemental Table 2). For the remaining cells of a given sample, we integrated the data with 2962 high-quality cells detected across the 8 BEILs.5 We employed the method of Macosko et al11 to rank genes according to their normalized dispersion, and used tSNE to visualize the expression of shared highly variable genes as a 2-dimensional map (Figure 2A; “Methods”).17,18 This procedure was repeated for each FL and control sample separately, each time controlling for potential batch effects (supplemental Figures 1 and 2). Derived from a healthy control, the BEIL populations serve as landmarks21 for the cell phenotype landscape displayed on the tSNE map (Figure 2A-B; supplemental Figure 3).

Integrating scRNA-Seq data derived from heterogeneous biopsies and purified immune populations enables assignment of hematopoietic lineage to each cell. (A) tSNE mapping of 8129 cells from a follicular lymphoma sample (LPJ128, gray dots) and of 2962 purified cells from 8 BEIL populations (colored dots). (B) RNA-Seq based assignment of all 11 091 cells to a hematopoietic lineage. Every single cell was compared with every BEIL representative. (C) Among the gray LPJ128 cells from panel (A), expression of an 18-gene signature of cell cycle progression is shown (colorbar legend) and was highest among B cells and Tregs. The scale shows the GSVA enrichment score19 per cell. (D-E) Overall cell type frequencies are quantified for the sample above, along with 5 additional follicular lymphoma samples. Sequencing-based (left) and FACS-based (right) cell type frequencies are shown in pairs for each specimen (D) and cell type (E). **Spearman r ≥ 0.95: *r ≥ 0.9.
Integrating scRNA-Seq data derived from heterogeneous biopsies and purified immune populations enables assignment of hematopoietic lineage to each cell. (A) tSNE mapping of 8129 cells from a follicular lymphoma sample (LPJ128, gray dots) and of 2962 purified cells from 8 BEIL populations (colored dots). (B) RNA-Seq based assignment of all 11 091 cells to a hematopoietic lineage. Every single cell was compared with every BEIL representative. (C) Among the gray LPJ128 cells from panel (A), expression of an 18-gene signature of cell cycle progression is shown (colorbar legend) and was highest among B cells and Tregs. The scale shows the GSVA enrichment score19 per cell. (D-E) Overall cell type frequencies are quantified for the sample above, along with 5 additional follicular lymphoma samples. Sequencing-based (left) and FACS-based (right) cell type frequencies are shown in pairs for each specimen (D) and cell type (E). **Spearman r ≥ 0.95: *r ≥ 0.9.
To assign each cell to 1 of 8 lineages (B cell, monocyte, natural killer cell, CD4 memory, regulatory T [Treg], CD4 naive, CD8 memory, CD8 naive), we leveraged the 8 BEIL datasets to construct reference profiles (“Methods”), comparing every FL cell with each reference profile5 (supplemental Table 3). In general, correlation to BEIL profiles distinguished well among B cells, T cells, natural killer cells, and monocytes (supplemental Figure 5). Distinct cycling subpopulations were visible for B cells and Tregs within the FL specimens (Figure 2C). Distinction within the T-cell population, however, and in particular between Tregs and CD4 memory cells, was often ambiguous (supplemental Figure 5). We therefore used a second classification tier for cells assigned to a T-cell population. Namely, we clustered T cells and assigned each cluster to that BEIL whose representative had the highest correlation to the cluster (“Methods”).
We evaluated our lineage assignments with an independent data set. We gated each of the FL and control samples into 8 immune subsets, using a 13-parameter FACS analysis (“Methods”; supplemental Figure 4; supplemental Tables 4 and 5). We compared the cell population frequencies determined by scRNA-Seq and FACS for each sample. The 2 analysis methods were concordant on the proportions of B cells, T cells, and natural killer cells in each sample (Figure 2D-E). Monocyte estimates by scRNA-Seq were higher than by FACS in 4 of 6 samples (Figure 2D-E). We conclude that scRNA-Seq enables lineage classification at single-cell resolution, with cell type assignments that are largely concordant with flow cytometry.
Light-chain restriction confirms scRNA-Seq-based tumor B-cell classification
To distinguish normal from malignant B cells, we leveraged the interpatient heterogeneity in FL development. For FLs in different individuals, premalignant B cells take divergent evolutionary paths, as defined by different somatic mutations. These patterns of genetic heterogeneity are unique to each FL tumor.16 As a consequence, we hypothesized that these differences would lead to distinct transcriptional patterns observed in the scRNA-Seq data. Visually, one sees this as distinct, nonoverlapping tumor B-cell clusters in tSNE maps. In contrast, we anticipated that normal B cells from different samples would cluster together. Such information would enable us to distinguish malignant B cells among the different FLs.
To test this hypothesis, we merged the individual B cells from all 6 FL and 5 control samples into a single scRNA-Seq data set consisting of 25 106 cells. We performed principle component analysis of the top 1418 shared highly variable genes, followed by density clustering of the first 38 PCs with a graph-based clustering approach22-24 (“Methods”). This strategy identified 10 clusters (Figure 3A-B; supplemental Figure 6). We identified 4 classes of B-cell clusters, composed of the following: cells common to both, all FLs and PBMCs (universally shared class); cells associated with all FL samples but none of the control samples (tumor-shared class); cells that were nearly exclusive (>95%) to a given FL sample (tumor-private class); and cells common to the 2 tonsil samples. Greater than 99% of the B cells from the 3 PBMC control samples, as well as 0.7% to 19.5% of the cells from the FL samples, were found in the universally shared cluster (Figure 3B; supplemental Figure 7). This result suggested that the universally shared cluster contained the normal B cells within the different tumor samples, whereas all malignant B cells were distributed among the tumor-shared and tumor-private clusters.

B cell scRNA-Seq transcriptional profiles segregate into normal and malignant phenotypes. (A) TSNE analysis of 25 106 B cells across 11 samples reveals sample-specific and shared clusters of B cells in FLs (left), PBMCs (middle), and tonsils (right). Single cells are colored according to sample origin. Shared nearest-neighbor clustering of B cells in PC space identifies 10 clusters. Normal B cells (cluster 4 and 5) were abundant in the 5 control samples and detectable in all tumor samples. Each cluster is enclosed by kernel density estimates of the coordinates of its cell members (black polygons and adjacent numbers). (B) Cluster membership and sample origin of single cells point to 3 distinct cluster phenotypes: normal, cycling and quiescent. (C) Expression of 598 genes involved in cell cycle progression (Reactome-term “Cell cycle”) was highest in cluster 9. The scale shows the GSVA enrichment score19 per cell. (D) Fraction of B-cell subsets (λ+/ κ +/ cycling), as estimated by scRNA-Seq (left) and flow cytometry (right). (E) Light chain restriction of “tumor” cluster groups in each sample show minimal contribution of nontumor cells, while the “normal” cluster group is heterogeneous.
B cell scRNA-Seq transcriptional profiles segregate into normal and malignant phenotypes. (A) TSNE analysis of 25 106 B cells across 11 samples reveals sample-specific and shared clusters of B cells in FLs (left), PBMCs (middle), and tonsils (right). Single cells are colored according to sample origin. Shared nearest-neighbor clustering of B cells in PC space identifies 10 clusters. Normal B cells (cluster 4 and 5) were abundant in the 5 control samples and detectable in all tumor samples. Each cluster is enclosed by kernel density estimates of the coordinates of its cell members (black polygons and adjacent numbers). (B) Cluster membership and sample origin of single cells point to 3 distinct cluster phenotypes: normal, cycling and quiescent. (C) Expression of 598 genes involved in cell cycle progression (Reactome-term “Cell cycle”) was highest in cluster 9. The scale shows the GSVA enrichment score19 per cell. (D) Fraction of B-cell subsets (λ+/ κ +/ cycling), as estimated by scRNA-Seq (left) and flow cytometry (right). (E) Light chain restriction of “tumor” cluster groups in each sample show minimal contribution of nontumor cells, while the “normal” cluster group is heterogeneous.
Expression of cell cycle genes was observed in cluster 9 (Figure 3C). This cluster consisted of actively proliferating cells from all 6 FL samples, representing between 0.6% and 11.2% of cells per FL sample (Figure 3D). Five of 6 FL samples had their own single tumor-private cluster. Quiescent, malignant LPJ119 cells, however, segregated into 2 tumor-private clusters (Figure 3 A-B).
As another test confirming that the universally shared cluster represented normal B cells, we took advantage of the B-cell differentiation process involving immunoglobulin light chain restriction. Using our scRNA-Seq data, we determined the light chain assignment of each individual B cell among all 6 FL samples (“Methods”). In the universally shared B-cell cluster, the frequency of immunoglobulin Lambda+ (Igλ+) B cells was between 28% and 42% per sample. This ratio approximates the 40% Igλ expression typically seen in normal B cells, and therefore supports our interpretation that the universal cluster represents normal B cells. In contrast, the tumor-shared and tumor-private clusters had an exclusive light chain assignment that consisted of either <1% or >91% Igλ+ cells. The FACS results were also concordant with scRNA-Seq cluster assignments for the distinction between Igλ+ and Igκ+ B cells, and showed the same trend for the percentage of cycling cells (Figure 3D). The dominance of cells restricted to a single light chain supported our conclusion that the tumor-shared and tumor-private clusters represented clonal tumor B-cell populations (Figure 3E).
Differential expression between normal and malignant B cells reveals tumor-specific markers
Whether patient-to-patient variability between FL biopsies derives from the averaging of many different cell types in each patient’s tumor or from fundamental differences in the expression program of the pure malignant B-cell population is not known. To address this question, we compared the gene expression profiles of normal and tumor B cells within each patient. Leveraging this matched cell population approach avoids perturbations from physical isolation (ie, FACS sorting) and is inherently controlled for each patient’s genetic background.
After accounting for variation in the number of genes detected per cell, we employed 2 methods (a standard AUC classifier and MAST15 ) to assess whether a gene is differentially expressed between 2 groups of cells (“Methods”). For this analysis, we excluded cycling B cells to avoid detecting differentially expressed genes dependent on cell cycle status. Malignant B cells from the different FL samples had highly divergent transcriptomes (Figure 3A). BCL2 overexpression, a hallmark of FL caused by IGH:BCL2 translocation, was detected in 5 of 6 patients with FL (MAST: unadjusted P ≤ 4.3E-4). Overall, MAST identified 378 genes that were differentially expressed in at least 1 sample (FDR≤ 0.05; |log2(fold-change)| ≥0.6). Of these 378 genes identified by MAST, 74 (20%) were confirmed by the AUC classifier at 60% or more power (Figure 4A). Thirteen genes were prioritized for validation by FACS, based on the availability of antibodies and the significance of the fold-change in expression. The FACS data confirmed the differential expression predicted from scRNA-Seq the majority of the time. The rate of concordance between FACS and scRNA-Seq was, on average, 69.23% for MAST (supplemental Table 6A) and 87.50% for the AUC classifier (supplemental Table 6B).
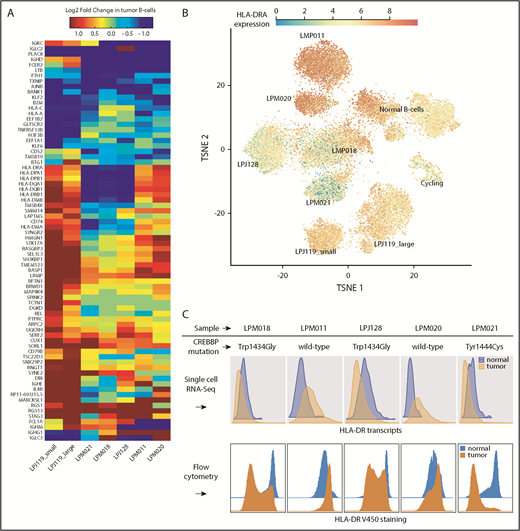
Differential expression analysis reveals gene transcripts recurrently enriched in either malignant or normal B cells from the same biopsy. (A) Genes with strong and recurrent patterns of enrichment are at the top and bottom of the heat map. The heat map is restricted to genes differentially expressed at ≥ 60% AUC power. (B) Overlay of class II MHC gene expression (HLA-DR) on the tSNE map shows strong differences between normal and malignant B cells for all samples, albeit in variable directions. (C) Tumor-specific expression of HLA-DR predicted from scRNA-Seq data (top) was confirmed by flow cytometry (bottom).
Differential expression analysis reveals gene transcripts recurrently enriched in either malignant or normal B cells from the same biopsy. (A) Genes with strong and recurrent patterns of enrichment are at the top and bottom of the heat map. The heat map is restricted to genes differentially expressed at ≥ 60% AUC power. (B) Overlay of class II MHC gene expression (HLA-DR) on the tSNE map shows strong differences between normal and malignant B cells for all samples, albeit in variable directions. (C) Tumor-specific expression of HLA-DR predicted from scRNA-Seq data (top) was confirmed by flow cytometry (bottom).
We observed downregulation of major histocompatibility complex (MHC) class I genes in all FLs. Class II MHCs were downregulated in a subset of samples while being upregulated in others (Figure 4A). In an exome-sequencing study, Green et al16 found that downregulation of MHC class II gene HLA-DR is attributable to the presence of somatic CREBBP mutations that represented early driver events during FL development. The 6 primary FL samples in this study had previously undergone exome sequencing with identified somatic mutations.16 We observed that those samples with a coding CREBBP mutation (LPM021, LPJ128, LPM018) consisted of tumor B cells of decreased HLA-DR expression, as shown in Figure 4B. The remaining 3 samples (LPM011, LPM020, LPJ119) had CREBBP wild-type status. The direction of MHC II differential expression relative to normal B cells was concordant between transcript and surface protein expression in all 5 FL patient samples tested (Figure 4C).
The AUC classifier identified 16 differentially expressed genes between the small and large quiescent malignant B-cell populations in LPJ119 (AUC: power >50%; supplemental Table 7). The intrinsic pathway for apoptosis and MHC class II antigen presentation were among the most significantly differentially expressed pathways between the 2 cell populations (GSVA, t-test: P < 2.2E-16), both being upregulated in the small compared with the large population (fold change ≥3/2).
Multiple subclones coexist within FL tumor populations
We asked whether scRNA-Seq could inform heterogeneity within the malignant B-cell populations identified. Allelic dropout, along with the sparsity of the scRNA-Seq data, makes it precarious to conclude from the absence of an expressed mutation the absence of the genetic event in the underlying DNA of a given cell. However, we hypothesized that the set of coding somatic mutations will influence the expression network of the genes they affect. If so, the expression profiles of genes affected by somatic mutations should structure the cells into subclones, reflecting genetic differences among them.
Principle component analysis on the set of mutated genes in each sample followed by density clustering grouped malignant B cells into anywhere from 4 to 5 subclones per sample (Figure 5; supplemental Table 9). We refer to genes differentially expressed in a given subclone relative to all other subclones as subclone-specific genes. Each sample’s largest subclone comprised at least 50% of the sample’s malignant B cells, and its subclone specific genes contained somatic mutations with higher allele frequencies compared with the other subclones (Figure 5C). In general, there was a correlation between scRNA-Seq-derived subclone size and exome-Seq derived allele frequencies across subclone-specific genes (r = 0.74; P < 5E-4; supplemental Figure 8), suggesting that the transcriptome-derived clonal structure does reflect genetic divergence among cells.

Multiple subclones coexist within FL tumor populations. (A) Malignant B cells in LPM011 segregate into 5 subclones (shown in tSNE space). (B) Relative proportions of tumor subclones is shown for LPM011 along with the 5 other FLs. Largest subclone dominates more than 50% of the tumor population in each analyzed FL. (C) ScRNA-Seq data recapitulates exome-Seq data: genes differentially expressed in largest subclone of each sample (clone 0) harbor somatic mutations with higher allele frequencies compared with the other genes. For each subclone and FL, the top 1 most differentially expressed, mutated gene was included in this comparison. (D) 21 canonical pathways had a strong differential activity across the subclones of at least 1 FL (analysis of variance: P < 1E-16). In 5 of 6 FLs, these pathways distinguish 1 or 2 smaller outlier subclones (red edges in dendrograms), with activity patterns diverging strongly from the corresponding sample’s other subclones, including the largest 1 (clone 0).
Multiple subclones coexist within FL tumor populations. (A) Malignant B cells in LPM011 segregate into 5 subclones (shown in tSNE space). (B) Relative proportions of tumor subclones is shown for LPM011 along with the 5 other FLs. Largest subclone dominates more than 50% of the tumor population in each analyzed FL. (C) ScRNA-Seq data recapitulates exome-Seq data: genes differentially expressed in largest subclone of each sample (clone 0) harbor somatic mutations with higher allele frequencies compared with the other genes. For each subclone and FL, the top 1 most differentially expressed, mutated gene was included in this comparison. (D) 21 canonical pathways had a strong differential activity across the subclones of at least 1 FL (analysis of variance: P < 1E-16). In 5 of 6 FLs, these pathways distinguish 1 or 2 smaller outlier subclones (red edges in dendrograms), with activity patterns diverging strongly from the corresponding sample’s other subclones, including the largest 1 (clone 0).
To find out what proportion of the total B-cell intratumor gene expression heterogeneity is explained by genetic divergence, we repeated the above analysis but used all detected genes to search for subgroups among malignant B cells. Although no subgroups were evident in 3 of the FLs, in the remaining 3 samples (LPM018, LPJ128, and LPM020) the previously detected smaller subclones were indeed enriched in certain areas of the corresponding tSNE map. However, the largest subclone was always dispersed across several areas of the map (supplemental Figure 9A-C), suggesting that stronger drivers of transcriptomic divergence, such as different cell states, overshadow genomic differences. Compared with the top genes contributing most to the variance of the first 2 principal components (on average 5.5%), genes with somatic mutations had only minimal contributions (on average, 1%; supplemental Figure 9D-E).
To investigate what phenotypes distinguish tumor subclones from each other, we looked at pathways that are differentially activated across the coexisting tumor subclones of a sample (Figure 5D). We observed several significant changes in the pathway activity of smaller subclones relative to the largest subclone, affecting a variety of pathways (Figure 5D; supplemental Figure 10). For example, deubiquitinating enzymes were upregulated in a smaller subclone of LPJ128, whereas DNA double-strand break repair was upregulated in a small subclone of LPM020 (supplemental Table 10).
Infiltrating T cells show recurrent patterns of immune checkpoint coexpression
The immune checkpoint molecules CTLA-4 and PD-1 are targets of current immunotherapies in clinical use. However, most patients do not respond to these therapies, motivating the investigation of other co-inhibitory and costimulatory receptors, including LAG3, HAVCR2 (TIM3), TIGIT,25 CD27, CD40LG, ICOS, TNFRSF9 (4-1BB), TNFRSF18 (GITR), and TNFRSF4 (OX40R).26 We evaluated these 11 aforementioned candidate markers based on published evidence of their putative role in T-cell regulation and immune response.25,27-29
Expression of immune checkpoint genes in the T cells present in the PBMCs was scarce. In striking contrast, the T cells in the FL and tonsil specimens expressed high levels of immune checkpoint genes (supplemental Figure 11A). We used the FL and tonsil scRNA-Seq data to determine what other genes were transcriptionally coexpressed with multiple of these known 11 immune checkpoint genes. Our goal was to extend the network of 11 immune checkpoint genes among the infiltrative T-cell lineages in each tumor by new actors with candidate regulatory or effector roles in immune response.
Among the CD4 memory, Tregs and CD8 memory cell lineages present for each FL and tonsil specimen, we quantified immune checkpoint coexpression at single-cell resolution, and looked for consistently coexpressed genes. Using hundreds of cells per specimen (average, 426; 90% CI, 67-854), this analysis determined the Spearman correlation coefficient between the expression profiles of any 2 expressed genes, whereby exactly 1 of the 2 genes was a known immune checkpoint gene (supplemental Methods). To extend the network of 11 immune checkpoint genes, we prioritized candidates that were significantly coexpressed with at least 2 known immune checkpoint genes with an average Spearman correlation coefficient across all FLs: r ≥ 0.2; FDR-adjusted P ≤ .05 (supplemental Methods).
This analysis extended the regulatory network of CD4+ Tregs by 31 additional candidates (Figure 6A). In total, 4 of the coexpressed genes (CEBPA, EOMES, ZNF140, and NCOR2) were transcriptional activators/repressors and another 6 (CST7, CRTAM, SRGN, B2M, HLA-A, and HLA-B) had been previously ascertained with a role in immune regulation. Of the significantly coexpressed gene-pairs, some were significantly coexpressed exclusively in controls, but not in FLs, such as ITM2A/PDCD1 (Figure 6B-C). The majority (63%), however, were coexpressed in FL as well as control samples, such as CD7 with both TNFRSF18 (Figure 6D) and TNFRSF4. Interestingly, CD7 is 1 of 42 genes previously shown to predict favorable outcome as part of a T-cell immune response signature.30 Expression of this immune response signature was particularly high in Tregs (supplemental Figure 12), and was generally higher in T cells as compared with other immune cell types, as has been previously described.30
![Figure 6. Immune checkpoint regulation network in tumor-resident and healthy CD4 Tregs. (A) Network of 10 known immune checkpoint genes (orange) and 31 coexpressed candidate genes (dark green). Edge width reflects average correlation coefficient of a given gene pair across 6 FL and 2 tonsil control specimens. (B) Heat map representation of the network shown in (A). Entries represent the average correlation coefficient across the 2 tonsil specimens subtracted from the average correlation measured across the 6 FL specimens. Entries close to zero indicate that the magnitude of coexpression is similar between FL and control specimens, whereas negative and positive entries indicate overrepresentation of the corresponding coexpressed pair in tonsil and FL specimens respectively. (C-D) Two examples are shown in this context: CEBPA is coexpressed with PDCD1 in tonsils but not in FL (C), whereas CD7 is coexpressed with TNFRSF18 in both FL and tonsils (D). (Network in panel A was visualized with Cytoscape.34 For panels C-D, least squares regression [line] is fitted on normalized and scaled unique molecule identifier counts for each gene pair [dots] and shown along with the standard error bounds.)](https://ash.silverchair-cdn.com/ash/content_public/journal/blood/133/10/10.1182_blood-2018-08-862292/3/m_blood862292f6.png?Expires=1769081691&Signature=bUj58peqD400f60dOP95Bc8zBvnYbX9FFqCD3rIPMdX2d2u2Ms01oCvkBmcrIaE80InMkbiNhb4CVCnTHzyyxcHovrEExJLMzHPyItDxcb41Wyi8fTZuIMsYvsJG9DMK4OHXH0nTsRVeAkjAVSVwFT60uK1FG9asRpgf2YC3CZuY6qZ0nul0VomxSHWXwLJHvFt8HPHha10fRbZRynzv4anvgjsv9NE3K2iYSxdUerZ-sT8qoqk1eS4DDq8nUeALu7hgsaTgylG~QANszmgLgO-k-2OOkZnCzyticRfcr9jAM6Ho0OtzeHxwgvtVFaWQwwSZ~Y7PPGhkKXwTs3fl8g__&Key-Pair-Id=APKAIE5G5CRDK6RD3PGA)
Immune checkpoint regulation network in tumor-resident and healthy CD4 Tregs. (A) Network of 10 known immune checkpoint genes (orange) and 31 coexpressed candidate genes (dark green). Edge width reflects average correlation coefficient of a given gene pair across 6 FL and 2 tonsil control specimens. (B) Heat map representation of the network shown in (A). Entries represent the average correlation coefficient across the 2 tonsil specimens subtracted from the average correlation measured across the 6 FL specimens. Entries close to zero indicate that the magnitude of coexpression is similar between FL and control specimens, whereas negative and positive entries indicate overrepresentation of the corresponding coexpressed pair in tonsil and FL specimens respectively. (C-D) Two examples are shown in this context: CEBPA is coexpressed with PDCD1 in tonsils but not in FL (C), whereas CD7 is coexpressed with TNFRSF18 in both FL and tonsils (D). (Network in panel A was visualized with Cytoscape.34 For panels C-D, least squares regression [line] is fitted on normalized and scaled unique molecule identifier counts for each gene pair [dots] and shown along with the standard error bounds.)
Immune checkpoint regulation network in tumor-resident and healthy CD4 Tregs. (A) Network of 10 known immune checkpoint genes (orange) and 31 coexpressed candidate genes (dark green). Edge width reflects average correlation coefficient of a given gene pair across 6 FL and 2 tonsil control specimens. (B) Heat map representation of the network shown in (A). Entries represent the average correlation coefficient across the 2 tonsil specimens subtracted from the average correlation measured across the 6 FL specimens. Entries close to zero indicate that the magnitude of coexpression is similar between FL and control specimens, whereas negative and positive entries indicate overrepresentation of the corresponding coexpressed pair in tonsil and FL specimens respectively. (C-D) Two examples are shown in this context: CEBPA is coexpressed with PDCD1 in tonsils but not in FL (C), whereas CD7 is coexpressed with TNFRSF18 in both FL and tonsils (D). (Network in panel A was visualized with Cytoscape.34 For panels C-D, least squares regression [line] is fitted on normalized and scaled unique molecule identifier counts for each gene pair [dots] and shown along with the standard error bounds.)
The same approach extended the network in CD4+ Memory cells by 6 candidates (supplemental Figure 11B). No single new candidate satisfied the above criteria to extend the CD8+ memory network, probably because CD8+ cells express low levels of immune checkpoint genes (supplemental Figure 11A). These conclusions were concordant when using alternative metrics, such as the percentage cells expressing a given combination (supplemental Figure 11C-D).
Discussion
We analyzed the transcriptomes of individual cells from 6 FL biopsies, sampling on average more than 5000 cells per biopsy and classifying them into 8 hematopoietic lineages. In parallel, we leveraged flow cytometry as orthogonal validation of scRNA-Seq derived findings. Because FL arises in a lymphoid organ, perfect isolation of the malignant B cell population from a surgical biopsy is a significant challenge. Conventional isolation of FL tumor B cells has limitations as the isolated cell population always included some normal B cells with the same Ig light chain as the tumor. ScRNA-Seq enabled us to directly compare the transcriptomes of entirely pure normal and malignant B cells from the same FL biopsy.
Analysis of coexpression patterns within T cell subsets identified novel candidate genes of T cell regulation that are consistently coexpressed with known immune checkpoint molecules. This included coexpression of CD59, a potent inhibitor of signal transduction for T-cell activation, with both TNFRSF18 and TNFRSF4 in CD4+ memory cells. We evaluated known immune response signatures and confirmed previous hypotheses about the cell types responsible for their expression. While the transcriptome-wide fingerprint of scRNA-Seq enabled many new observations, it came at a cost of losing information on the localization of immune cells. This information has been shown to be essential; for example, architectural patterns of CD4/CD8/FOXP3 expression, have been shown to predict survival of FL patients.31 In addition, dropout events likely accentuate synchronous variability in expression among gene-pairs, confounding coexpression patterns. Preserving the cells’ localization information, along with finding technological and analytical32 solutions to the high dropout rates are important next steps in the advancement of transcriptome-wide interrogation techniques.
Integration of the FL’s transcriptomes with their somatic mutation landscape revealed coexistence of multiple subclones of malignant B cells within the same tumor, suggesting that gene-expression heterogeneity in FL B cells is, in part, attributable to subclonal genomic diversity. This contrasts to a recent study by Milpied et al who performed single-cell gene expression analysis of a panel of 91 pre-selected genes and found no link between intra-tumor gene-expression heterogeneity and immunoglobulin heavy-chain sequence mutation heterogeneity among FL B cells.33 Instead, the authors found coexistence of distinct germinal center B-cell transitional states to account for a significant proportion of intratumor expression heterogeneity.33 Indeed, among all detectable genes, genes with somatic mutations had only moderate contributions to the B cells’ expression heterogeneity (supplemental Figure 9), suggesting other drivers of phenotypic diversity are stronger than genetic drivers at the time of sample collection. Whether the magnitude of expression heterogeneity caused by a given driver predicts the relevance of that driver for therapeutic sensitivity is an important question that can only be addressed by analyzing patient-matched biopsies before and after therapy.
Despite measuring a small number of patients, the large numbers of cells sequenced per patient in this study revealed novel biological insights that will, however, require a larger validation cohort. Droplet-based scRNA-Seq, on the order of tens of thousands of cells, provides a broad, systems-scale perspective on coexisting cell types, revealing immunogenic and malignant phenotypes that would have remained concealed when looking at a limited set of gene markers. The transcriptome-wide information provided by scRNA-Seq at single-cell resolution makes the technique an important tool if we are to understand the complex, intricate machinery responsible for immune evasion by tumors and develop new approaches for immunotherapy.
The publication costs of this article were defrayed in part by page charge payment. Therefore, and solely to indicate this fact, this article is hereby marked “advertisement” in accordance with 18 USC section 1734.
Acknowledgments
The authors acknowledge Ash Alizadeh for providing gene expression data sets for a subset of these samples. The authors thank Michael Lucero, Deanna Church, and Tarjei Mikkelsen for technology support in single-cell sequencing. They also thank Jessica M. Terry and Phillip Belgrader for generating the initial scRNA-Seq libraries and Paul Ryvkin for help with the initial analysis of the scRNA-Seq data.
This work was supported by National Institutes of Health, National Human Genome Research Institute grants P01HG000205 (H.P.J., C.W.-B., and S.M.G.) and R01HG006137 (H.P.J.), and National Cancer Institute grants U01CA176299 (N.A. and H.P.J.), K99CA215256 (N.A.), R01CA151748 (R.L.), R01CA188005 (R.L.), R35CA19735301 (R.L.), R33CA183692 (W.A.W.), U01CA176287 (W.A.W.), and P30CA082103 (W.A.W.). E.F.S. was supported by a Damon Runyon postdoctoral fellowship (DRG2190-14). N.A. received additional support from a Stanford University School of Medicine Dean’s Fellowship. J.C. and H.P.J. also received support from the American Cancer Society (124571-RSG-13-297-01).
Authorship
Contribution: N.A., E.F.S., D.K.C., R.L. and H.P.J. designed the experiments; D.K.C., J.C., C.W.-B., and M.A.K. conducted the experiments and sequencing; N.A., E.F.S., D.K.C., S.M.G., G.X.Y.Z., S.G., and H.P.J. conducted the data analysis; E.F.S. and W.A.W. identified methods and reagents for flow cytometry analysis; H.P.J. and R.L. supervised and coordinated all aspects of the research; and all authors revised, read, and approved the final manuscript.
Conflict-of-interest disclosure: G.X.Y.Z. is an employee of 10X Genomics. The remaining authors declare no competing financial interests.
Correspondence: Hanlee P. Ji, Stanford University, 269 Campus Dr, CCSR 2245, Stanford, CA 94305; e-mail: genomics_ji@stanford.edu; and Ronald Levy, Stanford University, 269 Campus Dr, CCSR 1105, Stanford, CA 94305; e-mail: levy@stanford.edu.

This feature is available to Subscribers Only
Sign In or Create an Account Close Modal