

Key Points
The 3D chromosome architecture of the PU.1 locus undergoes dynamic remodeling during myeloid differentiation, which can be impaired in AML.
PU.1 autoregulation initiates spatial remodeling and recruits LDB1 to stabilize chromosomal loops between PU.1 gene regulatory DNA elements.

Abstract
Epigenetic control of gene expression occurs within discrete spatial chromosomal units called topologically associating domains (TADs), but the exact spatial requirements of most genes are unknown; this is of particular interest for genes involved in cancer. We therefore applied high-resolution chromosomal conformation capture sequencing to map the three-dimensional (3D) organization of the human locus encoding the key myeloid transcription factor PU.1 in healthy monocytes and acute myeloid leukemia (AML) cells. We identified a dynamic ∼75-kb unit (SubTAD) as the genomic region in which spatial interactions between PU.1 gene regulatory elements occur during myeloid differentiation and are interrupted in AML. Within this SubTAD, proper initiation of the spatial chromosomal interactions requires PU.1 autoregulation and recruitment of the chromatin-adaptor protein LDB1 (LIM domain–binding protein 1). However, once these spatial interactions have occurred, LDB1 stabilizes them independently of PU.1 autoregulation. Thus, our data support that PU.1 autoregulates its expression in a “hit-and-run” manner by initiating stable chromosomal loops that result in a transcriptionally active chromatin architecture.
Introduction
Blood cell lineages arise through the coordinated expression of transcription factors. Alterations in these transcription factor networks can lead to developmental stalling, transdifferentiation, or malignant transformation.1,2 One prominent transcription factor in hematopoiesis is PU.1, a member of the ETS family (official gene name, SPI1/Sfpi1) expressed in a lineage-specific and dynamic manner.3 While PU.1 is downregulated in early progenitors to allow development into T-lymphoid and erythroid lineage cells, it has to be upregulated for myeloid cell production.4-6
We previously identified a distal regulatory element, located ∼17 kb upstream of the PU.1 gene in humans, that is indispensable for proper PU.1 expression.5,7 Deletion of this element (designated URE [upstream regulatory element]) in mice leads to 80% decreased PU.1 expression in hematopoietic stem cells, myeloid cells, and B cells.5,8,9 The URE mutants succumb to acute myeloid leukemia (AML), indicating that reduced PU.1 expression can drive hematopoietic cell transformation.8,10
AML in humans is a clonal disease in which malignant cells of the myeloid lineage are blocked during differentiation; this process is likely promoted by mutated or deregulated transcription factors.11 The PU.1 gene is rarely mutated, but its expression is suppressed by a number of AML-driving oncogenes.12 However, this downregulation never completely shuts down expression, and recent work using a mouse leukemia model driven by the mixed lineage leukemia gene suggests that certain PU.1 levels are an advantage for myeloid leukemia stem cells to survive.13,14 Thus, our current knowledge supports a model in which PU.1 expression in AML is reduced to an optimal level low enough to block differentiation but high enough to promote leukemia stem cells, arguing for an upstream regulatory control mechanism capable of fine-tuning PU.1 expression.
Epigenetic modifications of chromatin can affect gene expression in a dose-dependent manner.15 Indeed, almost 70% of AML patients carry a mutation in a gene encoding an epigenetic modifier,16 suggesting that alterations in the chromatin state may drive AML development. Disclosure of the spatial chromatin organization remains a challenging task.17 New tools, such as chromosome conformation capture (3C) and related techniques (4C, 5C, and Hi-C; for review, see Dekker et al18 ) now allow the physical interactions between distal DNA elements to be studied with unprecedented resolution. Such efforts have revealed that chromatin is spatially organized into topologically associating domains (TADs), representing discrete units in which chromosomal regions physically interact more frequently with each other than with regions outside the TAD.19
In this study, we used a circularized chromosome conformation capture sequencing (4C-seq) approach to decipher the chromosomal conformation of the PU.1 gene in myeloid cells. Using inducible knockdown experiments, we link the dynamics in PU.1 gene conformation states to an autoregulatory control mechanism.
Methods
4C-seq
4C-seq was performed as previously described.20 For chromatin digestion, NlaIII (NEB) and Csp6I (Thermo Scientific) were used as first and second restriction endonucleases. Inverse polymerase chain reaction (PCR) was performed to amplify specific viewpoints (VPs) at the PU.1 promoter or the PU.1 URE and the CD14 or the TET2 genes as controls (primers are listed in supplemental Table 1A, available on the Blood Web site). Single-end sequencing was performed using the Illumina HiSeq2500 platform. All 4C-seq data have been deposited to the National Center for Biotechnology Information Gene Expression Omnibus database (accession number GSE110683).
4C-seq data analysis
4C-seq reads were aligned against the human reference genome (hg19/GRCh37.67) using the Burrows-Wheeler Alignment Tool (bwa 0.7.10).21 The number of allowed mismatches was set to 2, whereas default settings were used for all other parameters. To visualize and identify near-cis interactions, we analyzed 4C-seq data using the R package Basic4Cseq.22 Uniquely aligned reads on nonblind restriction fragments were kept for analysis. A running median approach was chosen for near-cis visualizations (except for Figure 1D, in which we used a running mean approach without masking of the VP region); all other parameters were kept at default values.
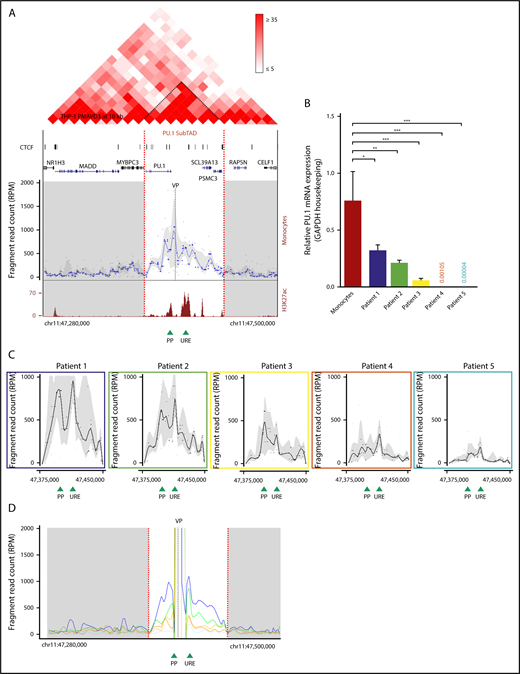
3D chromatin structure of the PU.1 locus. (A) Genome browser representation showing the Hi-C interaction profile in 72-hour PMA-differentiated THP-1 cells23 within a 220-kb TAD (chromosome 11: 47 280 000-47 500 000, hg19) containing the PU.1 locus in 10 kb resolution and at the indicated intensity range (top). Visible is the SubTAD structure (dark red triangles). Narrow peak representation of CTCF ChIP-seq data from 72-hour PMA-treated THP-1 cells (GSM2544246) (upper middle). The UCSC gene track is shown below. Interpolated 4C-seq near-cis interaction profile of the PU.1 promoter (VP) in human monocytes (gray dashed line), normalized to reads per million (lower middle). The PU.1 SubTAD is white, and other SubTADs are gray. The plot is representative of 2 biological repeats. UCSC browser view of H3K27ac ChIP-seq track from human monocytes (Gene Expression Omnibus sample accession number GSM1003559) (bottom). Green arrowheads represent position of the PU.1 promoter and the −17-kb URE. Red dashed lines mark the boundaries of the PU.1 SubTAD (chromosome 11: 47 375 000-47 450 000, hg19). (B) Real-time PCR showing PU.1 mRNA expression in healthy monocytes and blast cells isolated from 5 different FAB M5 AML patients. All values are relative to those of GAPDH used as internal control. *P < .05; **P < .01; ***P < .0002 (significantly different variances calculated by the F test, shown in reference to monocytes). Mean and standard error of mean are represented. (C) PU.1 promoter VP 4C-seq profiles within the PU.1 SubTAD boundaries of blast cells from the AML patients indicated in panel B using the same color coding. In all 4C-seq profiles of (A,C), black dots represent running medians of fragment reads, normalized to reads per million, interpolated with a locally estimated scatterplot smoothing (LOESS)–smoothed blue line and gray shading of 20 and 80% quantiles. (D) Running mean near-cis 4C-seq profile overlay visualization with the PU.1 promoter VP (gray dashed line) of the same AML patients shown in panel C with the same color coding. The shown trend lines represent LOESS-smoothed unmasked fragment reads. Red dashed lines mark the boundaries of the PU.1 SubTAD (white area). Green arrowheads at the bottom represent the position of the PU.1 proximal promoter and the URE. chr, chromosome; PP, proximal promoter; RPM, reads per million.
3D chromatin structure of the PU.1 locus. (A) Genome browser representation showing the Hi-C interaction profile in 72-hour PMA-differentiated THP-1 cells23 within a 220-kb TAD (chromosome 11: 47 280 000-47 500 000, hg19) containing the PU.1 locus in 10 kb resolution and at the indicated intensity range (top). Visible is the SubTAD structure (dark red triangles). Narrow peak representation of CTCF ChIP-seq data from 72-hour PMA-treated THP-1 cells (GSM2544246) (upper middle). The UCSC gene track is shown below. Interpolated 4C-seq near-cis interaction profile of the PU.1 promoter (VP) in human monocytes (gray dashed line), normalized to reads per million (lower middle). The PU.1 SubTAD is white, and other SubTADs are gray. The plot is representative of 2 biological repeats. UCSC browser view of H3K27ac ChIP-seq track from human monocytes (Gene Expression Omnibus sample accession number GSM1003559) (bottom). Green arrowheads represent position of the PU.1 promoter and the −17-kb URE. Red dashed lines mark the boundaries of the PU.1 SubTAD (chromosome 11: 47 375 000-47 450 000, hg19). (B) Real-time PCR showing PU.1 mRNA expression in healthy monocytes and blast cells isolated from 5 different FAB M5 AML patients. All values are relative to those of GAPDH used as internal control. *P < .05; **P < .01; ***P < .0002 (significantly different variances calculated by the F test, shown in reference to monocytes). Mean and standard error of mean are represented. (C) PU.1 promoter VP 4C-seq profiles within the PU.1 SubTAD boundaries of blast cells from the AML patients indicated in panel B using the same color coding. In all 4C-seq profiles of (A,C), black dots represent running medians of fragment reads, normalized to reads per million, interpolated with a locally estimated scatterplot smoothing (LOESS)–smoothed blue line and gray shading of 20 and 80% quantiles. (D) Running mean near-cis 4C-seq profile overlay visualization with the PU.1 promoter VP (gray dashed line) of the same AML patients shown in panel C with the same color coding. The shown trend lines represent LOESS-smoothed unmasked fragment reads. Red dashed lines mark the boundaries of the PU.1 SubTAD (white area). Green arrowheads at the bottom represent the position of the PU.1 proximal promoter and the URE. chr, chromosome; PP, proximal promoter; RPM, reads per million.
Hi-C data analysis
ChIP-seq
Chromatin immunoprecipitation (ChIP) and library construction were conducted essentially as described previously25 by using an unspecific immunoglobulin G (IgG) control antibody (rabbit, Merck Millipore #12-370) or antibodies against H3K4me1 (rabbit, Abcam #ab8895), H3K27ac (rabbit, Abcam #ab4729), PU.1 (rabbit, Santa Cruz #sc-352X), or LDB1 (rabbit, Abcam #ab96799). Sequences and genomic coordinates of ChIP–quantitative PCR (qPCR) primers are given in supplemental Table 1B. Tags for sequencing were mapped to the human reference genome (GRCh37.67/hg19) using BWA mem Aligner26 (LDB1 ChIP sequencing [ChIP-seq]) and Bowtie software (all other).27 Downstream analysis of uniquely mapped tags, including quality control, peak calling, and motif analysis, was performed as described using MACS228 (LDB1 ChIP-seq) and hypergeometric optimization of motif enrichment (HOMER) software tools (all others).29 Motif enrichment in LDB1-binding peaks was calculated with findMotifsGenome.pl from the Homer suite.
RNA-seq data analysis
RNA sequencing (RNA-seq) data from PMA + vitamin D3 (VD3)–treated and untreated THP-1 cells, as well as from primary human monocytes,30 were downloaded from the National Center for Biotechnology Information (SRP139891). Fastq files were quantified against the GENCODE transcriptome (release 28) with Salmon.31 Transcript level estimates were aggregated to the gene level with the R/Bioconductor package tximport,32 followed by count normalization and differential expression analysis using DESeq2 with default parameters.33
Quantitative 3C
Quantitative 3C was performed as previously described.34
Real-time PCR
RNA was extracted using the RNeasy Mini Kit (QIAGEN). RNase-free DNaseI (Thermo Scientific) was applied before reverse transcription, which was done with Random Hexamer Primers (Thermo Scientific), M-MuLV Reverse Transcriptase (Thermo Scientific), and a complementary DNA synthesis kit (Thermo Scientific) according to the manufacturer’s protocol. Real-time PCR was performed with a StepOne Plus PCR System (Thermo Scientific) and exon- and exon/intron-spanning primer sets including no reverse transcription controls (Power SYBRGreen PCR Mastermix, Thermo Scientific). Melting curve analysis was used to monitor specificity of the PCR products. PCR primer sequences are available upon request. The comparative CT method (ΔΔCt method) was used to analyze real-time PCR data. Errors were calculated either as standard deviation (SD) or with standard error of the mean when at least 3 biological replicates were applied. Statistical significance was indicated by P values using the Dunnett multiple comparison test in Prism 5 (GraphPad Software). Sequences and genomic coordinates of PCR primers are given in supplemental Table 1B.
Western blot
Total protein extracts were prepared and blotted with anti-PU.1 (rabbit #sc-352X, Santa Cruz Biotechnology), anti-LDB1 (rabbit, #ab96799, Abcam), or anti-valosin–containing protein (anti-VCP; mouse, #ab11433, Abcam) antibodies following standard procedures. Enhanced chemiluminescence detection reagents (Invitrogen) were applied to visualize antibodies coupled with horseradish peroxidase.
FACS
For analysis by fluorescence-activated cell sorting (FACS), we immunostained cell suspensions with fluorochrome-conjugated antibodies. Samples were measured with an FACS Aria III (Becton Dickinson) cytometer. For discrimination of dead cells, 7-aminoactinomycin D was added. Data analysis was performed using Diva software.
Inducible shRNA knockdown experiments
For inducible expression of small hairpin RNAs (shRNAs) against either PU.1 or LDB1, THP-1 cells were engineered by retroviral transduction to express a murine ecotropic receptor as previously described.35 Additionally, to allow doxycycline (Dox)–inducible expression of shRNAs, cells were engineered to express a bacterial tetracycline repressor.35,36 Transductions of shRNA constructs were performed as described elsewhere.37,38 Selection of transduced, GFP-positive cells was monitored by FACS analysis. Subsequently, shRNA expression was induced by adding 20 ng/mL Dox. Nucleotide sequences of the shRNAs are given in supplemental Table 1C.
Primary human monocytes
Blood cells were collected from healthy donors in compliance with the Declaration of Helsinki. Peripheral monocytes were separated by leukapheresis followed by density gradient centrifugation with Ficoll-Hypaque purification and subsequent countercurrent centrifugal elutriation as previously described.39 Monocytes were >85% pure as determined by morphology and expression of CD14 (data not shown).
Human AML samples
Fresh AML blasts were collected at the University Hospital Muenster from bone marrow aspirates with high blast infiltration. Prior to freezing the cell suspensions, density gradient centrifugation was done using Ficoll-Paque to isolate mononuclear cells. Immediately before processing, cells were thawed and verified to have at least 80% viability. Use of the patient material was approved by the Ethics Committee of University Hospital Muenster (approval no. 2007-390-f-S).
THP-1 cell differentiation
The human monocytic AML cell line THP-1 was cultured in RPMI 1640 (Thermo Scientific) medium supplemented with 10% fetal bovine serum (Biochrom, Superiour). Differentiation into macrophages was induced by treatment with PMA (10 nM final; Sigma-Aldrich) and cholecalciferol (VD3, 100 nM final, Sigma-Aldrich). After incubation for the indicated time points, only adherent cells were harvested.
Results
High-resolution mapping of the PU.1 locus spatial chromosomal structure
To first obtain an overview of the spatial chromosomal configuration of the SPI1 gene locus encoding PU.1 (hereafter called the PU.1 locus), we visualized the genomic TAD structure at 10 kb resolution using published Hi-C data from THP-1 cells, a monocytic cell line derived from a FAB M5 AML patient, that were differentiated into macrophage-like cells by a 72-hour treatment with PMA and VD3.23,40 Figure 1A (top) displays the TAD containing the PU.1 locus, indicating several smaller units of enhanced spatial intrachromosomal contacts (dark red triangles), termed SubTADs.41 One of these units contains the entire PU.1 coding region and the previously described PU.1 gene regulatory DNA elements.42,43 We call this region the PU.1 SubTAD. Notably, chromatin occupancy of CTCF, a zinc-finger protein involved in regulating the three-dimensional (3D) structure of chromatin,44 was enriched within the PU.1 SubTAD, being in accord with the notion that this region represents a local concentration of spatial chromosomal activity (Figure 1A, upper middle).
To explore the 3D topology of the PU.1 SubTAD in the highest possible resolution, we applied circularized chromosome conformation capturing followed by deep sequencing (4C-seq).45,46 This technology maps spatial chromosomal contacts formed by a genomic site of interest, termed the VP. We used 2 different VPs in most experiments, one near the proximal PU.1 promoter (PP VP) and one near the URE (URE VP), providing reciprocal validation. As monocytes highly express PU.1,47 we first conducted 4C-seq with primary monocytes from healthy volunteers (n = 3; supplemental Figure 1A). The 4C-seq profile with the PP VP is shown in Figure 1A (lower middle), revealing that several surrounding genomic sites were juxtaposed into close spatial proximity with the PU.1 promoter. One of the promoter’s major interactions was with the URE, being in line with the important functional role of this element. Interestingly, the spatial chromosomal activity around the promoter occurred mainly within a ∼75-kb genomic window that largely overlaps with the Hi-C–derived PU.1 SubTAD (Figure 1A, red dotted lines). The chromosomal conformation of the PU.1 SubTAD was also seen with the URE VP (supplemental Figure 1B). Moreover, ChIP-seq with an antibody against lysine 27 acetylation at histone 3 (H3K27ac), a chromatin modification associated with transcription regulatory activity in healthy monocytes,48 provided further indication that this SubTAD is the chromosomal region where PU.1 gene expression is regulated (Figure 1A, bottom).
In AML, PU.1 expression can also be impaired; however, the mechanism underlying this impairment is not entirely explored.1 To evaluate whether the chromosomal 3D architecture is involved, we performed 4C-seq with leukemic blasts from patients diagnosed with monocytic French-British-American (FAB) M5 subtype AML, and we selected 5 patients harboring different PU.1 transcript levels that were all lower than in healthy monocytes (Figure 1B; supplemental Figure 1C). The physical chromosomal interaction frequencies within the PU.1 SubTAD gradually paralleled the PU.1 expression level: the lower the PU.1 expression, the less frequent the chromosomal interactions (Figure 1C; supplemental Figure 1D). It is important to note that throughout this paper, we display 4C near-cis profiles by running median windows to correct for sequencing read outliers such as from the VP region. However, we also analyzed the patient 4C profiles using a running mean approach as previously described (Figure 1D).49 This verified the differences in the chromosomal interaction frequencies and additionally demonstrated an expected prominent VP peak representation in each of the samples. Moreover, we present a gel picture showing equal amounts of fully processed (digested and ligated) chromatin from the patient cells as a further quality control (supplemental Figure 1E).
Assessment of the differential bone marrow counts suggested that the differences in the 3D structure at the PU.1 gene were not simply a mirror image of the different stages at which the blasts from the patients had arrested during myeloid differentiation (supplemental Figure 1F). Thus, impaired spatial interactivity within the PU.1 SubTAD may have a possible pathogenic role by leading to downregulated PU.1 expression in AML.
Taken together, the 4C-seq profiling data suggest that PU.1 expression is mainly determined at the SubTAD level, providing a link between the chromosomal conformation and PU.1 expression in monocytes and AML cells.
Spatial chromosomal interactions within the PU.1 SubTAD are dynamic
Upregulation of PU.1 expression is essential for myeloid differentiation.47 Thus, we wondered if spatial activity within the PU.1 SubTAD also increases during differentiation. As a model for human monocyte-to-macrophage differentiation, we compared untreated with 72-hour PMA + VD3–treated THP-1 cells. As differentiation coincided with PU.1 upregulation, THP-1 cells were a suitable tool for our study (Figure 2A).

The PU.1 SubTAD is dynamic during monocytic differentiation. (A) Real-time PCR showing PU.1 mRNA expression in undifferentiated (monocytic) and 72-hour PMA + VD3–differentiated (macrophage-like) THP-1 cells, along with primary human monocytes for comparison. All values are relative to those of GAPDH. *P < .05; **P < .01 (significant different variances calculated by 1-way analysis of variance). Mean and standard error of the mean are presented. (B) Near-cis 4C-seq profile visualization with the PU.1 promoter VP (gray dashed line) of undifferentiated (top) and 72-hour PMA + VD3–differentiated (bottom) THP-1 cells. Raw fragment data are visible as gray dots and running medians as blue dots; the trend line is LOESS smoothed, and the gray shadowing represents quantiles. Red dashed lines mark the boundaries of the PU.1 SubTAD. The UCSC gene track is shown at the top. The plots are representative of 2 biological repeats each. (C) Quantitative 3C assay demonstrating increased crosslinking frequency of the URE with the PU.1 promoter in mouse bone marrow–derived macrophages (Macs) as compared with Lineage-Sca1+-ckit+ bone marrow stem and progenitor cells (LSK). We also measured the interaction of the PU.1 promoter with a control region outside of the SubTAD (+71 kb), revealing no increase in crosslinking frequency. The highest value was set to 1. Error bars represent SD of 2 independent experiments. (D) ChIP-seq profiles of H3K4me1 (top) and H3K27ac (bottom) in undifferentiated (THP-1) and 72-hour PMA + VD3–differentiated THP-1 cells (THP-1 PMAVD3), displayed as UCSC browser tracks. Green arrowheads represent the position of the PU.1 promoter (PP) and the URE.
The PU.1 SubTAD is dynamic during monocytic differentiation. (A) Real-time PCR showing PU.1 mRNA expression in undifferentiated (monocytic) and 72-hour PMA + VD3–differentiated (macrophage-like) THP-1 cells, along with primary human monocytes for comparison. All values are relative to those of GAPDH. *P < .05; **P < .01 (significant different variances calculated by 1-way analysis of variance). Mean and standard error of the mean are presented. (B) Near-cis 4C-seq profile visualization with the PU.1 promoter VP (gray dashed line) of undifferentiated (top) and 72-hour PMA + VD3–differentiated (bottom) THP-1 cells. Raw fragment data are visible as gray dots and running medians as blue dots; the trend line is LOESS smoothed, and the gray shadowing represents quantiles. Red dashed lines mark the boundaries of the PU.1 SubTAD. The UCSC gene track is shown at the top. The plots are representative of 2 biological repeats each. (C) Quantitative 3C assay demonstrating increased crosslinking frequency of the URE with the PU.1 promoter in mouse bone marrow–derived macrophages (Macs) as compared with Lineage-Sca1+-ckit+ bone marrow stem and progenitor cells (LSK). We also measured the interaction of the PU.1 promoter with a control region outside of the SubTAD (+71 kb), revealing no increase in crosslinking frequency. The highest value was set to 1. Error bars represent SD of 2 independent experiments. (D) ChIP-seq profiles of H3K4me1 (top) and H3K27ac (bottom) in undifferentiated (THP-1) and 72-hour PMA + VD3–differentiated THP-1 cells (THP-1 PMAVD3), displayed as UCSC browser tracks. Green arrowheads represent the position of the PU.1 promoter (PP) and the URE.
The 4C-seq data revealed little chromosomal interaction activity within the PU.1 SubTAD in undifferentiated THP-1 cells, which was similar to what we observed in the primary AML cells (Figure 2B). However, the interaction activity increased markedly in the differentiated THP-1 cells. We observed this pattern with 2 independent biological replicates and with both the PP and the URE VPs (supplemental Figure 2A-B). Moreover, we confirmed dynamic interaction frequency between the URE and the promoter also in primary material by comparing murine hematopoietic stem/progenitor cells with macrophages using quantitative 3C (Figure 2C).
By ChIP-seq with an antibody against monomethylated H3K4 (H3K4me1), a chromatin modification associated with transcriptionally poised enhancer elements,50 we observed a quantitatively similar peak pattern in both the undifferentiated and differentiated THP-1 cells (Figure 2D, 2 top tracks). In contrast, the transcriptional regulatory activity of these elements, as determined by H3K27ac ChIP-seq signal intensities,51 was increased upon differentiation (Figure 2D, 2 bottom tracks). This observation suggests that deposition of H3K4me1, but not of H3K27ac, at the PU.1 gene regulatory elements occurs before they undergo physical contacts with each other.
Collectively, these results suggest that increasing PU.1 expression during myeloid differentiation is governed by a stepwise epigenetic process in which the involved regulatory elements are first poised but not yet activated before they undergo spatial remodeling.
PU.1 initiates chromosomal looping early during myeloid differentiation
We and others reported previously that PU.1 can stimulate its own expression in an autoregulatory manner.34,47,52 Here, we asked to what extent PU.1 is involved in formation of the PU.1 SubTAD during myeloid differentiation of THP-1 cells.
We determined the PU.1-binding pattern at the PU.1 locus using ChIP-seq of THP-1 cells, finding that PU.1 binds at several sites within its SubTAD and that this binding was enhanced upon differentiation (Figure 3A). We confirmed enhanced PU.1 binding to the URE by ChIP-qPCR (ChIP followed by quantitative PCR) in 12-hour-differentiated THP-1 cells (supplemental Figure 3A).
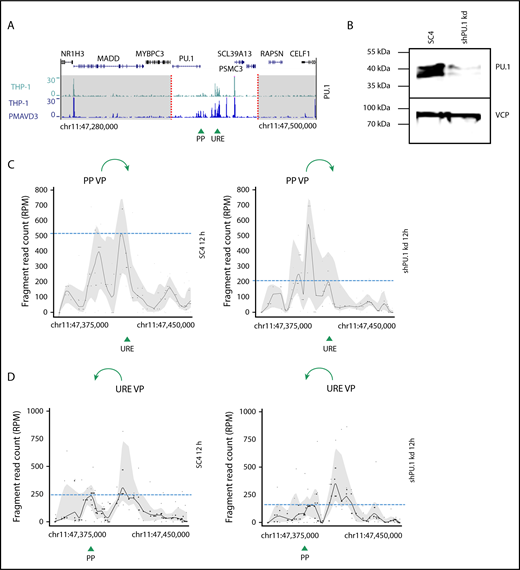
PU.1 initiates spatial chromatin activity in the PU.1 SubTAD. (A) PU.1 ChIP-seq tracks of undifferentiated THP-1 (green, top) and 72-hour PMA + VD3–treated THP-1 cells (blue, bottom) around the PU.1 gene locus (220-kb range). The dashed red lines indicate the boundaries of the PU.1 SubTAD (white region). The UCSC browser gene track is shown above. Green arrowheads represent position of the PU.1 promoter (PP) and the URE. (B) western blot confirming PU.1 knockdown in transgenic THP-1 cells carrying an inducible shRNA against PU.1 (shPU.1 kd), in comparison with control transgenic THP-1 cells carrying an inducible SC4 shRNA. The cells were first treated with Dox for 24 hours and then with PMA + VD3 for another 12 hours. VCP is shown as loading control. The molecular protein mass is indicated in kilodaltons using a prestained protein ladder (#26617, Thermo Scientific). (C-D) 4C-seq profiles from 2 independent experiments displaying impaired spatial contacts of the PU.1 promoter (PP VP; C) or the reciprocal URE (URE VP; D) VP within the PU.1 SubTAD after PU.1 knockdown early in differentiation. The THP-1 cells carrying PU.1 shRNA or SC4 control shRNA constructs were Dox and PMA + VD3 treated as in panel B. Green arrows at the top indicate the direction of VP interaction with the URE or the PU.1 promoter, respectively. Green arrowheads at the bottom represent position of the PU.1 promoter (PP) and the URE. Dashed blue lines represent heights of the URE or promoter interacting with the used VP.
PU.1 initiates spatial chromatin activity in the PU.1 SubTAD. (A) PU.1 ChIP-seq tracks of undifferentiated THP-1 (green, top) and 72-hour PMA + VD3–treated THP-1 cells (blue, bottom) around the PU.1 gene locus (220-kb range). The dashed red lines indicate the boundaries of the PU.1 SubTAD (white region). The UCSC browser gene track is shown above. Green arrowheads represent position of the PU.1 promoter (PP) and the URE. (B) western blot confirming PU.1 knockdown in transgenic THP-1 cells carrying an inducible shRNA against PU.1 (shPU.1 kd), in comparison with control transgenic THP-1 cells carrying an inducible SC4 shRNA. The cells were first treated with Dox for 24 hours and then with PMA + VD3 for another 12 hours. VCP is shown as loading control. The molecular protein mass is indicated in kilodaltons using a prestained protein ladder (#26617, Thermo Scientific). (C-D) 4C-seq profiles from 2 independent experiments displaying impaired spatial contacts of the PU.1 promoter (PP VP; C) or the reciprocal URE (URE VP; D) VP within the PU.1 SubTAD after PU.1 knockdown early in differentiation. The THP-1 cells carrying PU.1 shRNA or SC4 control shRNA constructs were Dox and PMA + VD3 treated as in panel B. Green arrows at the top indicate the direction of VP interaction with the URE or the PU.1 promoter, respectively. Green arrowheads at the bottom represent position of the PU.1 promoter (PP) and the URE. Dashed blue lines represent heights of the URE or promoter interacting with the used VP.
To assess if PU.1 promotes the reorganization of the spatial chromosomal conformation within the PU.1 SubTAD, we knocked down PU.1 expression by generating genetically engineered THP-1 cells that stably expressed Dox-inducible shRNAs53 against PU.1 (shPU.1 kd). At first, we tested the role of PU.1 during the initial establishment phase of the spatial chromosomal contacts in the PU.1 SubTAD. Therefore, we performed 4C-seq with THP-1 cells in which we first knocked down PU.1 by 24-hour Dox treatment and then induced them with PMA + VD3 for another 12 hours to initiate chromosomal looping, again in the presence of Dox. We confirmed robust PU.1 knockdown (Figure 3B; supplemental Figure 3B). As an important control, this early time point did not result in a differentiation bias between PU.1 knockdown and control cells, suggesting that the low PU.1 levels left in the knockdown cells were still sufficient to permit initial myeloid differentiation (supplemental Figure 3C-D). 4C-seq with 2 different samples and either the PP VP or the URE VP revealed that reduced PU.1 levels indeed resulted in impaired contact frequencies between the involved gene regulatory elements (Figure 3C-D). This impairment was most obvious between the PU.1 promoter and URE, suggesting that this interaction in particular requires high PU.1 levels. As a control to guarantee comparable sample preparation from both PU.1 knockdown and control knockdown THP-1 cells, we conducted 4C-seq with an unrelated VP at the CD14 gene using the same chromatin. This showed similar 4C patterns, confirming that the chromatin input and quality were comparable among the samples (supplemental Figure 3E).
Thus, PU.1 autoregulation drives the establishment of chromosomal loops between gene regulatory elements in the human PU.1 SubTAD.
PU.1 is not needed to stabilize the PU.1 SubTAD in differentiated cells
We next tested if PU.1 has a role in the stabilization of chromosomal loops within the PU.1 SubTAD in differentiated THP-1 cells. Therefore, we performed the experiment by first driving differentiation with PMA + VD3 for 48 hours, and then we knocked down PU.1 by 24-hour Dox treatment (still in the presence of PMA + VD3). This setup led to PU.1 knockdown after the contacts between the PU.1 gene regulatory DNA regions had been formed (Figure 4A). In this late differentiation phase, PU.1 knockdown did not lead to impaired spatial interaction frequencies between PU.1 gene regulatory DNA elements, indicating that PU.1 is not required to stabilize the PU.1 SubTAD (Figure 4B-C).
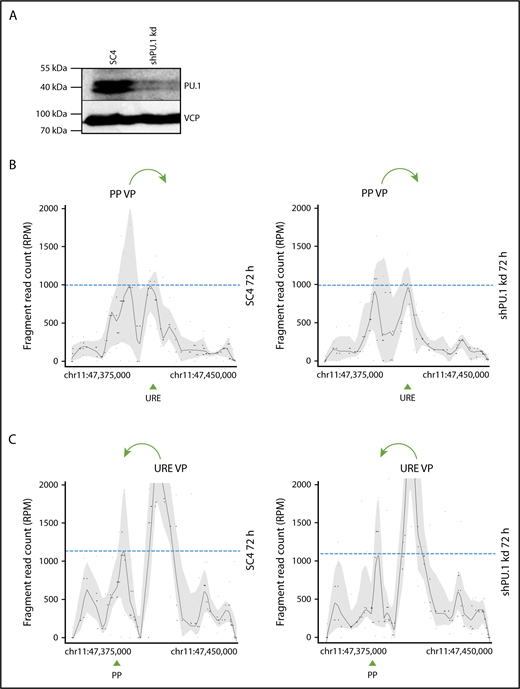
PU.1 is dispensable for stabilization of the PU.1 SubTAD. (A) PU.1 western blot with an antibody against PU.1 (top) or VCP (bottom), as loading control, of THP-1 cells carrying either the SC4 or the PU.1 shRNA. The cells were first treated with PMA and VD3 for 48 hours, and then Dox was added for another 24 hours, again in the presence of PMA and VD3. The total differentiation time was therefore 72 hours, and the PU.1 knockdown was induced late during differentiation. The molecular protein mass is indicated. (B-C) 4C-seq profiles displaying spatial contacts of the PU.1 promoter (PP VP; B) or the URE (URE VP; C) VP within the SubTAD in induced THP-1 cells carrying Dox-responsive shRNA constructs against PU.1 or the SC4 control. The cells were Dox and PMA + VD3 treated as in panel A. Green arrows at the top indicate the direction of VP interaction with the URE or the PU.1 promoter, respectively. Green arrowheads at the bottom represent position of the PU.1 promoter (PP) and the URE. Dashed blue lines represent heights of the URE or promoter interacting with the used VP.
PU.1 is dispensable for stabilization of the PU.1 SubTAD. (A) PU.1 western blot with an antibody against PU.1 (top) or VCP (bottom), as loading control, of THP-1 cells carrying either the SC4 or the PU.1 shRNA. The cells were first treated with PMA and VD3 for 48 hours, and then Dox was added for another 24 hours, again in the presence of PMA and VD3. The total differentiation time was therefore 72 hours, and the PU.1 knockdown was induced late during differentiation. The molecular protein mass is indicated. (B-C) 4C-seq profiles displaying spatial contacts of the PU.1 promoter (PP VP; B) or the URE (URE VP; C) VP within the SubTAD in induced THP-1 cells carrying Dox-responsive shRNA constructs against PU.1 or the SC4 control. The cells were Dox and PMA + VD3 treated as in panel A. Green arrows at the top indicate the direction of VP interaction with the URE or the PU.1 promoter, respectively. Green arrowheads at the bottom represent position of the PU.1 promoter (PP) and the URE. Dashed blue lines represent heights of the URE or promoter interacting with the used VP.
In summary, 4C-seq profiling with PU.1 knockdown cells uncovered a temporal role for PU.1 in promoting the initiation, but not maintenance, of chromosomal loops.
PU.1 promotes the recruitment of LDB1 to the PU.1 SubTAD
Chromosomal looping requires nuclear adaptor proteins, one of which can be LDB1 (LIM domain–binding protein 1), a broadly expressed protein capable of self-dimerization.54,55 To assess whether LDB1 plays a role in regulating spatial contacts between PU.1 gene regulatory chromatin elements, we first determined its expression in THP-1 cells using RNA-seq and western blotting data. These data showed that LDB1 is expressed by THP-1 cells and is upregulated upon differentiation at both the RNA and protein levels (Figure 5A, left and middle columns, and Figure 5B). Moreover, the data also demonstrate that LDB1 is expressed in primary monocytes (Figure 5A, right column).

PU.1-dependent LDB1 recruitment to the PU.1 locus upon differentiation. (A) RNA-seq with undifferentiated (left column, n = 3) and 72-hour PMA-differentiated THP-1 cells (middle column, n = 3) as well as with primary human monocytes (right column, n = 4). Individual data points as well as means ± SD are indicated *P < .1; **P < .05 (false discovery rate–adjusted P values. (B) LDB1 protein levels in undifferentiated and 72-hour PMA + VD3–differentiated THP-1 cells as detected by western blotting. VCP was used as loading control. The molecular protein mass is indicated. (C) LDB1 (top) and IgG (bottom) ChIP-seq tracks of 12-hour PMA + VD3–differentiated THP-1 cells around the PU.1 gene locus (220-kb range). The dashed red lines indicate the boundaries of the PU.1 SubTAD (white region). The UCSC browser gene track is shown above. Green arrowheads represent positions of the PU.1 promoter (PP) and the URE. (D) LDB1 binding to the PU.1 locus increases with differentiation. ChIP-qPCR with primers specific for the PU.1 URE (left and middle) or an adjacent negative control region (right), which was chosen based on lack of a LDB1 binding peak in the LDB1 ChIP-seq data shown in panel C. Chromatin was from undifferentiated (left) or 12-hour PMA + VD3–differentiated THP-1 cells (middle and right) that was precipitated with an antibody against LDB1 (red bars) or an IgG control antibody (black bars). (E) LDB1 chromatin binding requires PU.1. ChIP-qPCR with primers for the URE and chromatin template of 72-hour Dox-treated THP-1 cells expressing a negative control shRNA (left) or shRNAs against PU.1 (middle and right). The cells were also treated with PMA + VD3 12 hours before harvest to induce LDB1 binding. Error bars in panels D and E represent SD of the mean. n.s., not significant; **P < .01; ***P < .001 (significantly different means calculated by the Student t test).
PU.1-dependent LDB1 recruitment to the PU.1 locus upon differentiation. (A) RNA-seq with undifferentiated (left column, n = 3) and 72-hour PMA-differentiated THP-1 cells (middle column, n = 3) as well as with primary human monocytes (right column, n = 4). Individual data points as well as means ± SD are indicated *P < .1; **P < .05 (false discovery rate–adjusted P values. (B) LDB1 protein levels in undifferentiated and 72-hour PMA + VD3–differentiated THP-1 cells as detected by western blotting. VCP was used as loading control. The molecular protein mass is indicated. (C) LDB1 (top) and IgG (bottom) ChIP-seq tracks of 12-hour PMA + VD3–differentiated THP-1 cells around the PU.1 gene locus (220-kb range). The dashed red lines indicate the boundaries of the PU.1 SubTAD (white region). The UCSC browser gene track is shown above. Green arrowheads represent positions of the PU.1 promoter (PP) and the URE. (D) LDB1 binding to the PU.1 locus increases with differentiation. ChIP-qPCR with primers specific for the PU.1 URE (left and middle) or an adjacent negative control region (right), which was chosen based on lack of a LDB1 binding peak in the LDB1 ChIP-seq data shown in panel C. Chromatin was from undifferentiated (left) or 12-hour PMA + VD3–differentiated THP-1 cells (middle and right) that was precipitated with an antibody against LDB1 (red bars) or an IgG control antibody (black bars). (E) LDB1 chromatin binding requires PU.1. ChIP-qPCR with primers for the URE and chromatin template of 72-hour Dox-treated THP-1 cells expressing a negative control shRNA (left) or shRNAs against PU.1 (middle and right). The cells were also treated with PMA + VD3 12 hours before harvest to induce LDB1 binding. Error bars in panels D and E represent SD of the mean. n.s., not significant; **P < .01; ***P < .001 (significantly different means calculated by the Student t test).
We next conducted ChIP-seq with 12-hour PMA + VD3–differentiated THP-1 cells to determine whether the LDB1 protein binds the PU.1 locus; indeed, the data revealed a local enrichment of LDB1-occupied sites in the PU.1 SubTAD (Figure 5C) resembling the pattern of CTCF occupancy shown in Figure 1A. ChIP-qPCR demonstrated that LDB1 binding to the URE is induced upon differentiation (Figure 5D) and that binding is conserved in humans and mice, as both human THP-1 and murine 416B myeloid cells showed specific LDB1 occupancy at PU.1 gene regulatory elements (supplemental Figure 4A-B). Importantly, PU.1 is required for the binding of LDB1 to the PU.1 locus, because knocking down PU.1 by shRNA resulted in a substantial loss of LDB1 occupancy at the URE (Figure 5E).
Collectively, our data link the mechanism by which PU.1 controls spatial chromosomal contacts to the recruitment of LDB1.
LDB1 promotes both formation and stabilization of the PU.1 SubTAD
To test if LDB1 recruitment to the PU.1 SubTAD is of functional relevance, we stably engineered THP-1 cells expressing Dox-inducible shRNAs against LDB1, and we verified LDB1 knockdown following a 72-hour Dox treatment (Figure 6A). Importantly, reduced LDB1 levels led to impaired PU.1 protein levels, suggesting that PU.1 is controlled by LDB1 (Figure 6B). In contrast, regulation of the LDB1 gene does not appear to be downstream of PU.1, because LDB1 protein levels were not affected upon PU.1 knockdown (supplemental Figure 5A). Thus, LDB1 and PU.1 operate in a linear order.

LDB1 promotes PU.1 expression and chromosomal looping between PU.1 gene regulatory elements. (A) Western blot confirming reduced LDB1 expression upon induction of LDB1 knockdown in 2 THP-1 lines carrying different LDB1 shRNA constructs in comparison with THP-1 cells harboring the SC4 shRNA. Cells were Dox treated for 72 hours. (B) PU.1 expression was downregulated upon LDB1 knockdown as seen by western blotting with an anti-PU.1 antibody. VCP served as loading control, and the molecular protein mass is indicated (A-B). (C-D) 4C-seq profiles displaying spatial contacts of the PU.1 URE (URE VP) VP within the PU.1 SubTAD in induced THP-1 cells carrying Dox-responsive LDB1 shRNA or SC4 shRNA constructs. (C) Cells were Dox treated for a total of 36 hours, whereby PMA and VD3 were added 12 hours prior to harvest to trigger differentiation. (D) Cells were first treated with PMA + VD3 for an initial 24 hours followed by a treatment with PMA + VD3 and Dox for additional 48 hours. Green arrows at the top indicate the direction of VP interaction with the PU.1 promoter. Green arrowheads at the bottom represent position of the PU.1 promoter (PP). Dashed blue lines represent heights of the promoter interacting with the used URE VP. Each plot (C-D) is representative of at least 2 independent shRNAs against LDB1.
LDB1 promotes PU.1 expression and chromosomal looping between PU.1 gene regulatory elements. (A) Western blot confirming reduced LDB1 expression upon induction of LDB1 knockdown in 2 THP-1 lines carrying different LDB1 shRNA constructs in comparison with THP-1 cells harboring the SC4 shRNA. Cells were Dox treated for 72 hours. (B) PU.1 expression was downregulated upon LDB1 knockdown as seen by western blotting with an anti-PU.1 antibody. VCP served as loading control, and the molecular protein mass is indicated (A-B). (C-D) 4C-seq profiles displaying spatial contacts of the PU.1 URE (URE VP) VP within the PU.1 SubTAD in induced THP-1 cells carrying Dox-responsive LDB1 shRNA or SC4 shRNA constructs. (C) Cells were Dox treated for a total of 36 hours, whereby PMA and VD3 were added 12 hours prior to harvest to trigger differentiation. (D) Cells were first treated with PMA + VD3 for an initial 24 hours followed by a treatment with PMA + VD3 and Dox for additional 48 hours. Green arrows at the top indicate the direction of VP interaction with the PU.1 promoter. Green arrowheads at the bottom represent position of the PU.1 promoter (PP). Dashed blue lines represent heights of the promoter interacting with the used URE VP. Each plot (C-D) is representative of at least 2 independent shRNAs against LDB1.
We next performed 4C-seq with the LDB1 shRNA-engineered THP-1 cells that we first treated with Dox for 24 hours to induce shRNA expression and then supplied with PMA + VD3 for 12 hours, still in the presence of Dox, to initiate chromosomal looping and binding of LDB1 to the PU.1 locus. Again, we confirmed efficient LDB1 knockdown at this time point (supplemental Figure 5B). Similar to the results obtained by PU.1 knockdown, LDB1 knockdown caused impaired, albeit not fully abrogated, chromosomal contacts between PU.1 gene regulatory elements, mainly between the PU.1 promoter and the URE (Figure 6C; supplemental Figure 5C-D). We confirmed with the same chromatin that these differences were specific to the PU.1 SubTAD by conducting 4C-seq at the unrelated TET2 locus, encoding Tet methylcytosine dioxygenase 2. This revealed similar 4C-seq profiles in both control and the LDB1 knockdown cells (supplemental Figure 5E).
We next determined whether LDB1 promotes not only the initial formation but also the subsequent stabilization of the PU.1 SubTAD. Therefore, we first drove THP-1 cells into differentiation by adding PMA + VD3 for 24 hours, and then we treated them with Dox for another 48 hours (still in the presence of PMA + VD3) to induce the LDB1 knockdown. In contrast to what we observed with the PU.1 knockdown at this late differentiation time point, LDB1 knockdown did lead to an impaired 4C-seq interaction profile, suggesting that LDB1 promotes both the formation and stabilization of the PU.1 SubTAD (Figure 6D). The specificity of this result was again confirmed by similar 4C-seq profiles of control and LDB1 knockdown cells at an unrelated control locus using the same chromatin (supplemental Figure 5F).
Collectively, these results suggest that LDB1 is involved in controlling PU.1 expression by tethering and maintaining PU.1 gene regulatory elements into close juxtaposition.
Discussion
In this study, we aimed to understand to what extent the chromosomal 3D architecture is involved in controlling PU.1 expression in human myeloid cells. Conducting a systematic 4C-seq–based analysis, we observed dynamic PU.1 locus remodeling during myeloid differentiation, resulting in the tethering of distant regulatory elements into close spatial proximity with each other. This tethering is preceded by epigenetic (H3K4me1) positioning of the involved genomic elements and is restricted to a ∼75-kb genomic region that overlaps with a Hi-C–defined SubTAD. Our experiments showed that the intrachromosomal contact frequency within this SubTAD can be reduced in AML cells and that a transcriptionally active topology depends on an autoregulatory PU.1 circuit leading to recruitment of LDB1.
PU.1 is expressed in a dynamic pattern that must be tightly controlled to govern hematopoietic lineage diversity.56,57 Even subtle deregulations in PU.1 expression patterns may result in fatal leukemia or lymphoma development.5,10,58 Thus, it is essential to fully elucidate how PU.1 expression is orchestrated. Previous experiments demonstrated that proper PU.1 transcription is achieved by a multilayered interplay between several distal regulatory elements with several different upstream-acting transcription factors and signaling pathways.7,42,59 Regulation of PU.1 expression also involves autoregulation, operating in a lineage-specific way.42,47,52
Autoregulation is commonly used to adjust the expression level of several transcription factors.59 By targeting the PU.1 consensus-binding site within the URE in mice, we previously showed that PU.1 autoregulation is functionally important in vivo.34 We also connected PU.1 autoregulation to the spatial chromosomal structure using the 3C assay in murine cells.34 Presently, we have extended these findings to human cells and show that PU.1 autoregulation is only temporally important for a transcriptionally active chromosomal topology. According to our observations, autoregulation operates in a “hit-and-run” manner, driving the initiation of chromosomal loops, but is thereafter dispensable for maintaining them.
Two lines of evidence are in support of the notion that PU.1 promotes chromosomal interactions via direct binding to its genomic locus: (1) deleting the PU.1-binding site in the URE reduces the spatial proximity of the URE and the PU.1 promoter,34 and (2) although LDB1 emerged as a main factor for spatial PU.1 locus remodeling, its expression was unaffected by PU.1 knockdown, arguing against LDB1 as a target gene through which PU.1 indirectly controls chromosomal contacts.
The 4C and Hi-C data shown in the current study reveal that the spatial chromosomal activity of the PU.1 locus occurs mainly within a defined genomic area of ∼75 kb, representing a local concentration of enhanced intrachromosomal looping activity. Such chromosomal subtopologies have recently been defined as SubTADs, forming dynamic units of gene regulatory activity.41,60 As chromosomal contacts between PU.1 gene regulatory elements occurred upon differentiation and were preceded by H3K4me1 deposition at the involved genomic regions, establishment of the PU.1 SubTAD is likely an organized process in which involved regions are first epigenetically positioned (poised) before being tethered into juxtaposition.
In the present study, we also raised the question of how PU.1 binding controls the spatial chromosomal architecture of its genomic locus. Our data revealed that PU.1 recruits LDB1 to the PU.1 SubTAD. LDB1 can form multimeric protein complexes, organizes long-range gene regulation, and controls the functional activity of different cell types.61,62 It does not bind DNA directly but is recruited by transcription factors.62 Because we were unable to detect direct protein–protein interaction between PU.1 and LDB1 using co-immunoprecipitation (B.v.R. and F.R., unpublished data), it is likely that PU.1 supports LDB1 chromatin binding indirectly. Most interestingly, while we revealed a transient role for PU.1 in the formation of the PU.1 SubTAD, LDB1 promoted both formation and subsequent stabilization (or maintenance) of the SubTAD. Thus, the hit-and-run mechanism by which PU.1 acts on the spatial architecture of its genomic locus may involve a transient dependency of LDB1 chromatin binding on PU.1. The link between PU.1 and LDB1 chromatin binding may even exist on the genome-wide level, because our ChIP-seq data (from THP-1 cells) and previous ChIP-seq data (from mouse hemangioblast-like cells) revealed that the PU.1 consensus binding motif is among the most highly enriched sequence motifs in LDB1-occupied genomic sites (supplemental Table 2).54
The role of aberrations in spatial chromosomal structures in the development of human cancer is yet not well understood. Here, we provide an indication of impaired physical interaction frequencies between PU.1 gene regulatory elements in AML, which we could quantitatively connect with the level of PU.1 expression. Although this finding must be interpreted with care due to the low number of analyzed patients and the heterogeneity of mutations that they carried, it provides a first possible link between the chromosomal conformation at the PU.1 locus and the pathogenesis of leukemia. However, functional experiments are needed to causally establish this link.
Overall, our data provide a first high-resolution picture of the spatial PU.1 locus architecture during monocytic differentiation and in AML cells. We propose a link between this architecture and PU.1 expression, and we reveal that PU.1 transiently autoregulates the juxtapositioning of PU.1 gene regulatory elements into close proximity via LDB1.
The online version of this article contains a data supplement.
The publication costs of this article were defrayed in part by page charge payment. Therefore, and solely to indicate this fact, this article is hereby marked “advertisement” in accordance with 18 USC section 1734.
Acknowledgments
The authors thank Josephine Fischer, Juanma Vaquerizas, Saskia Jauch, Thomas Vogl, and Johannes Roth (Muenster, Germany), Argyris Papantonis (Cologne, Germany), and Roberto Avellino, Mathijs Sanders, and Remco Hoogenboezem (Rotterdam, The Netherlands) for experimental support and discussions, Celeste Brennecka (Muenster, Germany) for linguistic support, and Carsten Mueller-Tidow (Heidelberg, Germany) for access to patient material. This work was supported by a grant from the University of Muenster Medical faculty (IZKF project Ros2/007/15) to F.R.
Authorship
Contribution: D.S. and F.R. wrote the manuscript, and all authors contributed to the manuscript; D.S., F.R., and B.v.R. designed research; D.S., S.K., T.K., T.E., A.W., B.v.R., C.G., A.T., C.P., J.M., K.W., and M.R. performed experiments and analyzed data; E.B. performed sequencing; C.W. and M.D. analyzed 4C-seq data; M.R., R.D., G.L., and S.G. provided reagents and access to technologies; and F.R. supervised and financed the project.
Conflict-of-interest disclosure: The authors declare no competing financial interests.
Correspondence: Frank Rosenbauer, Institute of Molecular Tumor Biology, Medical Faculty, University of Muenster, Robert-Koch-Str 43, 48149 Muenster, Germany; e-mail: frank.rosenbauer@ukmuenster.de.
