

Key Points
During the recovery from anemia, monocytes recruited to the spleen generate macrophages that form the stress erythropoiesis niche.
The maturation of monocytes into macrophages occurs in parallel with stress erythroid progenitor development.

Abstract
Anemic stress induces a physiological response that includes the rapid production of new erythrocytes. This process is referred to as stress erythropoiesis. It is best understood in the mouse where it is extramedullary and utilizes signals and progenitor cells that are distinct from bone marrow steady-state erythropoiesis. The development of stress erythroid progenitors occurs in close association with the splenic stress erythropoiesis niche. In particular, macrophages in the niche are required for proper stress erythropoiesis. Here we show that the expansion of the niche occurs in concert with the proliferation and differentiation of stress erythroid progenitors. Using lineage tracing analysis in 2 models of anemic stress, we show that the expansion of the splenic niche is due to the recruitment of monocytes into the spleen, which develop into macrophages that form erythroblastic islands. The influx in monocytes into the spleen depends in part on Ccr2-dependent signaling mediated by Ccl2 and other ligands expressed by spleen resident red pulp macrophages. Overall, these data demonstrate the dynamic nature of the spleen niche, which rapidly expands in concert with the stress erythroid progenitors to coordinate the production of new erythrocytes in response to anemic stress.
Introduction
Bone marrow (BM) steady-state erythropoiesis is primarily homeostatic. It produces new erythrocytes at a constant rate to replace senescent erythrocytes that are removed by macrophages in the spleen.1 In response to anemic stress, the situation is different, where stress erythropoiesis predominates. Stress erythropoiesis is best understood in the mouse where it is extramedullary occurring in the fetal liver during development and in the adult spleen and liver.2-5 It utilizes stress erythroid progenitors (SEPs) that are distinct from BM steady-state progenitors and are derived directly from short-term reconstituting hematopoietic stem cells (CD34+Kit+Sca1+Lin−).2,6,7 SEPs respond to signals such as Hedgehog, bone morphogenetic protein 4 (Bmp4), and growth and differentiation factor 15 (Gdf15), which are not associated with steady-state erythropoiesis.2,6,8,9 The developmental strategy of stress erythropoiesis utilizes these signals to drive the rapid proliferation of a discrete set of immature SEP populations that maintain their stem cell markers and act as a transient amplifying population. An increase in serum Epo concentration promotes their transition to committed erythroid progenitors that synchronously differentiate into erythrocytes.6,7 This wave of new erythrocytes maintains homeostasis until steady-state erythropoiesis can resume.
Early work by Bessis identified erythropoietic niches (erythroblastic islands, EBIs) in the BM, where erythroblasts proliferated and differentiated.10 These microenvironments were characterized by a central macrophage surrounded by developing erythroblasts.11 Later analysis identified similar structures in the murine spleen and fetal liver, further underscoring the essential nature of this erythroid niche.12 The interaction between the central macrophage and erythroblasts is mediated by adhesion molecules, such as αv, Vcam1, and CD169 on macrophages, and α4β1 and Icam4, on erythroblasts.11,13 This interaction allows macrophages to provide nutrients and signals to erythroblasts to regulate their proliferation and differentiation.11,13 In addition, macrophages phagocytose nuclei extruded from newly formed reticulocytes.14-16 During stress erythropoiesis, studies by us in vitro and by others in vivo have demonstrated that the regulation of stress erythropoiesis relies on the interaction between progenitor cells and macrophages in the stress erythropoiesis niche.6,17-19 Ablation of macrophages severely compromises the development of SEPs.6,17-19 In the spleen, red pulp macrophages (RPMs) are tissue-resident macrophages that regulate erythroid homeostasis by phagocytosing senescent erythrocytes and interacting with developing erythroblasts.1,20,21 Tissue-resident macrophages are derived from yolk sac definitive hematopoietic progenitors that seed tissues early in development.22-25 It is thought that tissue-resident macrophages proliferate in situ and are not replaced by monocyte-derived macrophages.26 Under conditions of regeneration, however, monocytes can replace tissue-resident cells.27 In the spleen, RPMs can be replaced by monocytes that infiltrate the spleen.28 This process requires heme-dependent signaling to activate the expression of the transcription factor SpiC, which in turn promotes the development of RPMs through a pre-RPM intermediate.21,29
In this report, we use lineage tracing and imaging flow cytometry to analyze the dynamic changes in EBIs during the recovery from anemic stress. We show that the expansion of the stress erythropoiesis niche is driven by the recruitment of monocytes into the spleen that differentiate into pre-RPMs and RPMs. Our data demonstrate that the EBIs in the spleen are dynamic structures where SEPs mature in concert with infiltrating monocytes and monocyte-derived macrophages in the spleen. The influx of new monocytes into the spleen is in part regulated by the chemokine receptor Ccr2 expressed by monocytes and its ligands, including Ccl2, whose expression by tissue-resident RPMs is induced by erythrophagocytosis. Taken together, these data present a new paradigm where SEPs proliferate and mature in concert with the expansion and maturation of splenic stress erythropoiesis niche.
Materials and methods
Detailed study design and methods are described in the supplemental Methods, available on the Blood Web site.
Mice
All mice were maintained on the C57BL/6 background by backcrossing with C57BL/6 mice. B6.129S4-Ccl2tm1Rol/J (JAX: 004434, Ccl2−/−),30 B6.129P2(Cg)-Cx3cr1tm2.1(cre/ERT2)Litt/WganJ (JAX: 021160, Cx3cr1YFPCreER), B6;129S6-Gt(ROSA)26Sortm14(CAG-tdTomato)Hze/J (JAX: 007908, Ai14tdTomato),31 B6;129S4-Ccr2tm1lfc/J (JAX: 004999 Ccr2−/−) mouse strains were purchased from Jackson Laboratory. Cx3cr1YFPCreER;tdTomato mouse strain was generated by breeding Cx3cr1YFPCreER mice with Ai14tdTomato mice. All procedures were approved by the Institutional Animal Care and Use Committee of the Pennsylvania State University.
Monocyte fate-mapping
Cx3cr1YFPCreER;tdTomato recipient mice were injected intraperitoneally (IP) with tamoxifen (Sigma) in corn oil at 75 mg/kg body weight for 5 consecutive days prior to bone marrow transplant (BMT) or phenylhydrazine (PHZ) treatment. When serving as donors, Cx3cr1YFPCreER;tdTomato BM cells were isolated after the 5-day tamoxifen treatment and transplanted into CD45.1 recipient mice.
Splenic EBI enrichment
The isolation of splenic EBIs isolation was done as previously described.32,33 In brief, spleens were minced and digested in 0.075% (m/v) Collagenase IV (Gibco 17104019) and 0.004% (m/v) DNase I (Invitrogen DN25) in RPMI 1640 for 30 minutes at 37°C. The suspension was gently passed through an 18-gauge needle several times, and cells were washed by centrifugation. Cell pellets were resuspended with 1 mL RPMI 1640 containing 0.004% DNaseI and layered on top of 30% (vol/vol) fetal bovine serum in Iscove modified Dulbecco medium followed by gravity sedimentation for 45 minutes at room temperature. The supernatant was carefully removed, and the pellet was processed with Percoll (Sigma) gradient centrifugation (50% [vol/vol]/100% [vol/vol]) at 400g for 20 minutes. The interface between the 50% and 100% Percoll was collected, washed with phosphate-buffered saline, and processed for flow cytometry and imaging flow cytometry.
Statistical analysis
All quantitative data were represented as mean ± standard error of the mean (SEM) of at least duplicate biological replicates. Student t test was used for analyses of difference between 2 groups. Analysis of variance was used for analyzing experiments with >2 groups with Holm-Sidak test adjustment for multiple comparisons. Significance level was set at α = 0.05, with *P < .05, **P < .001, ***P < .005, ****P < .0001.
Results
Heterogeneity of niche macrophages in PHZ-induced stress erythropoiesis
PHZ-induced acute hemolytic anemia induces a rapid stress erythropoiesis response characterized by a 50-fold increase in stress burst forming units–erythroid by 36 hours after treatment.2 Using this model, we examined the changes in the niche macrophages in the spleen. At 48 hours after PHZ treatment, Ter119+ erythroblasts accumulated in the spleen (supplemental Figure 1A), which was coupled with an expansion of F4/80+ cells expressing CD169 and Vcam-1, which is typical of RPMs (Figure 1A; supplemental Figure 1B). To further characterize the spleen niche, we isolated EBI aggregates from spleens using a procedure that allows for the preservation of in vivo niche structures32 (supplemental Figure 1C-D). EBIs were costained for the erythroid marker Ter119 and the monocyte/macrophage markers (Figure 1B). Although the macrophages in the Ter119+ EBIs expressed F4/80, we observed a range of macrophage phenotypes that encompassed populations with characteristics of monocytes (CD11b+Ly6C+F4/80+), pre-RPMs (CD11b+Ly6C−F4/80+), and RPMs (CD11bloLy6C−F4/80hi). EBIs associated with pre-RPMs increased over time, and at 48 hours after treatment were the predominant population (Figure 1C). These data demonstrate that the spleen erythroid niche is highly dynamic during the recovery from anemia.
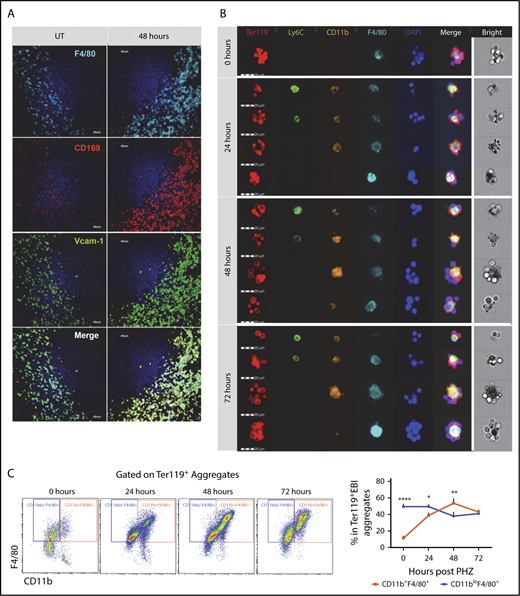
Ter119+EBI phenotypes in stress erythropoiesis induced by PHZ. Mice were injected IP with a single dose of PHZ at 100 mg/kg body weight. Spleens were isolated and processed for spleen sections or for isolation of enriched EBI aggregates that were characterized for the expression of monocyte and macrophage markers by immunofluorescence microscopy or flow cytometry, respectively. (A) Immunofluorescence analysis of spleen sections from untreated (UT) or at 48 hours post-PHZ treatment. Each column shows sections were stained for F4/80, CD169, and Vcam-1 at the indicated time points. The stained sections were imaged using an Olympus Fluoview 1000 microscope at ×40 magnification. (B) FlowSight imaging of splenic Ter119+ EBIs at 0, 24, 48, and 72 hours post-PHZ treatment. Aggregates were stained with Ter119 to indicate erythroblasts and the monocyte macrophage markers Ly6C, F4/80, and CD11b. 4′,6-Diamidino-2-phenylindole (DAPI) staining was included to mark nuclei. Each horizontal strip represents 1 aggregate. All cells imaged used the same gating. The white vertical line separates the bright field image of aggregate from the fluorescent images. Scale bar: 20 μm. (C) Representative FlowSight gating charts (left). The percentage of CD11b+F4/80+ cells and CD11bloF4/80+ cells in Ter119+ EBIs at the indicated time points is shown (right). Bars are representative of mean ± SEM. n = 3-4 for each group per time point.
Ter119+EBI phenotypes in stress erythropoiesis induced by PHZ. Mice were injected IP with a single dose of PHZ at 100 mg/kg body weight. Spleens were isolated and processed for spleen sections or for isolation of enriched EBI aggregates that were characterized for the expression of monocyte and macrophage markers by immunofluorescence microscopy or flow cytometry, respectively. (A) Immunofluorescence analysis of spleen sections from untreated (UT) or at 48 hours post-PHZ treatment. Each column shows sections were stained for F4/80, CD169, and Vcam-1 at the indicated time points. The stained sections were imaged using an Olympus Fluoview 1000 microscope at ×40 magnification. (B) FlowSight imaging of splenic Ter119+ EBIs at 0, 24, 48, and 72 hours post-PHZ treatment. Aggregates were stained with Ter119 to indicate erythroblasts and the monocyte macrophage markers Ly6C, F4/80, and CD11b. 4′,6-Diamidino-2-phenylindole (DAPI) staining was included to mark nuclei. Each horizontal strip represents 1 aggregate. All cells imaged used the same gating. The white vertical line separates the bright field image of aggregate from the fluorescent images. Scale bar: 20 μm. (C) Representative FlowSight gating charts (left). The percentage of CD11b+F4/80+ cells and CD11bloF4/80+ cells in Ter119+ EBIs at the indicated time points is shown (right). Bars are representative of mean ± SEM. n = 3-4 for each group per time point.
Kinetics of monocyte and macrophage populations during the recovery from anemia
To better characterize the macrophage and monocyte populations, we used erythroid short-term radioprotection as an alternative model. Splenic stress erythropoiesis is the primary source of new erythrocytes in the first 18 days after BMT.7 This model allowed us to follow the development of SEPs and characterize the changes that occur in monocyte/macrophage populations during recovery. We set up a gating strategy using F4/80, CD11b, and Ly6C that divided cells into 4 major populations, enriched for Ly6Chi monocytes (I), Ly6Clo monocytes (II), pre-RPMs (III), and RPMs (IV) (Figure 2A). We further characterized these populations using monocyte markers Cx3cr1 and CD115 and showed that the majority of Ly6Chi monocytes were CD11b+Ly6ChiF4/80midCx3cr1+CD115+ cells and Ly6Clo monocytes CD11b+Ly6CloF4/80midCx3cr1hiCD115lo/−, while pre-RPMs and RPMs expressed little Cx3CR1 and no CD115 (supplemental Figure 2A).
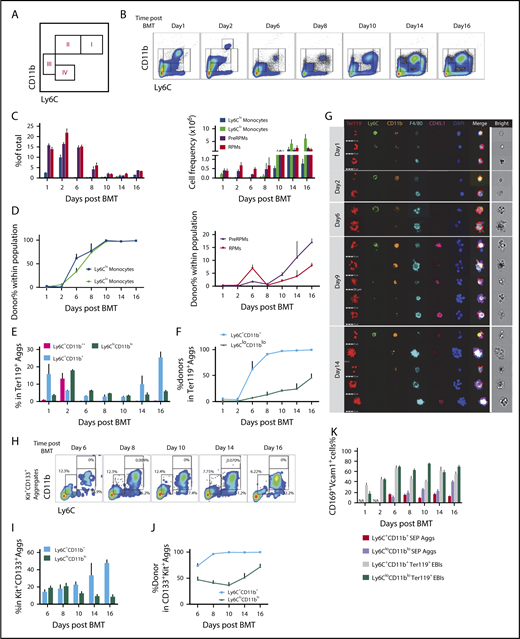
Dynamics of spleen macrophage and monocyte populations in whole spleen and enriched EBI aggregates during the recovery from BMT. (A) Monocyte and macrophage flow cytometry gating strategy. Cells were divided into 4 major populations, I-IV, enriched for Ly6Chi monocytes (I), Ly6Clo monocytes (II), pre-RPMs (III), and RPMs (IV), respectively. (B-D) Characterization of monocyte and macrophage populations in whole spleen after BMT from day 1 to day 16. Recipient CD45.2 mice were transplanted with 0.5 × 10⁶ CD45.1 donor BM cells on day 0. Whole spleen cells were isolated and analyzed using flow cytometry. n = 3-4 for each group per time point. (B) Representative flow cytometry diagrams. Cells were gated based on CD11b and Ly6C expression. CD11b++Ly6C+ only transiently appeared on day 2 after BMT. (C) Percent (left), and total cell numbers (right) of Ly6Chi monocytes (CD11b+Ly6ChiF4/80+), Ly6Clo monocytes (CD11b+Ly6CloF4/80+), pre-RPMs (CD11b+Ly6C−F4/80+), and PRMs (CD11bloLy6C−F4/80+). (D) Composition of donor vs recipient-derived cells in monocytes (left) and macrophages (right) in the spleen on the indicated days after transplant. (E-G) Characterization of monocyte and macrophage populations in EBIs during the recovery from BMT. EBIs were enriched and analyzed by flow cytometry. Ter119 was used to identify erythroblast containing aggregates. The gating strategy was simplified to combine Ly6hi monocytes and Ly6lo monocytes into Ly6C+CD11b+ monocytes and pre-RPMs and RPMs into Ly6CloCD11blo macrophages, to ensure enough events for analysis. n = 3-4 for each group per time point. (E) The percentage of Ly6C+CD11b++, Ly6C+CD11b+, and Ly6CloCD11blo aggregates in total Ter119+ EBIs on the indicated days after BMT. (F) The percentage of donor-derived cells in each subpopulation. (G) FlowSight imaging of Ter119+ EBIs on day 1, day 2, day 6, day 9, and day 14 after BMT. EBI aggregates were stained with Ter119 to identify erythroblasts, Ly6C, CD11b, and F4/80 markers for monocytes and macrophages, CD45.1 to identify donor cells and DAPI to identify nuclei. Each horizontal strip represents 1 aggregate. All cells were imaged used the same gating. The white vertical line separates the brightfield image of aggregate from the fluorescent images. Scale bar: 20 μm. (H-J) Characterization of Ly6C+CD11b+ monocytes (MOs) and Ly6CloCD11blo macrophages in Kit+CD133+ aggregates after BMT from day 6 to day 16. There were too few events for analysis before day 6. Kit and CD133 were used for differentiation of SEP-involved aggregates from erythroblast-involved EBIs. n = 3-4 for each group per time point. (H) Representative flow cytometry charts. (I) Percent Ly6C+CD11b+ and Ly6CloCD11blo cells in SEP (Kit+CD133+) aggregates. (J) The percentage of donor-derived cells in each subpopulation of Kit+CD133+ aggregates. (K) Percent CD169+Vcam-1+ cells in Ly6C+CD11b+ SEP aggregates, Ly6CloCD11blo SEP aggregates, Ly6C+CD11b+Ter119+ EBIs, and Ly6CloCD11blo Ter119+ EBIs. NA, not applicable (no aggregates present at this time point). Bars are representative of mean ± SEM. Aggs, aggregates.
Dynamics of spleen macrophage and monocyte populations in whole spleen and enriched EBI aggregates during the recovery from BMT. (A) Monocyte and macrophage flow cytometry gating strategy. Cells were divided into 4 major populations, I-IV, enriched for Ly6Chi monocytes (I), Ly6Clo monocytes (II), pre-RPMs (III), and RPMs (IV), respectively. (B-D) Characterization of monocyte and macrophage populations in whole spleen after BMT from day 1 to day 16. Recipient CD45.2 mice were transplanted with 0.5 × 10⁶ CD45.1 donor BM cells on day 0. Whole spleen cells were isolated and analyzed using flow cytometry. n = 3-4 for each group per time point. (B) Representative flow cytometry diagrams. Cells were gated based on CD11b and Ly6C expression. CD11b++Ly6C+ only transiently appeared on day 2 after BMT. (C) Percent (left), and total cell numbers (right) of Ly6Chi monocytes (CD11b+Ly6ChiF4/80+), Ly6Clo monocytes (CD11b+Ly6CloF4/80+), pre-RPMs (CD11b+Ly6C−F4/80+), and PRMs (CD11bloLy6C−F4/80+). (D) Composition of donor vs recipient-derived cells in monocytes (left) and macrophages (right) in the spleen on the indicated days after transplant. (E-G) Characterization of monocyte and macrophage populations in EBIs during the recovery from BMT. EBIs were enriched and analyzed by flow cytometry. Ter119 was used to identify erythroblast containing aggregates. The gating strategy was simplified to combine Ly6hi monocytes and Ly6lo monocytes into Ly6C+CD11b+ monocytes and pre-RPMs and RPMs into Ly6CloCD11blo macrophages, to ensure enough events for analysis. n = 3-4 for each group per time point. (E) The percentage of Ly6C+CD11b++, Ly6C+CD11b+, and Ly6CloCD11blo aggregates in total Ter119+ EBIs on the indicated days after BMT. (F) The percentage of donor-derived cells in each subpopulation. (G) FlowSight imaging of Ter119+ EBIs on day 1, day 2, day 6, day 9, and day 14 after BMT. EBI aggregates were stained with Ter119 to identify erythroblasts, Ly6C, CD11b, and F4/80 markers for monocytes and macrophages, CD45.1 to identify donor cells and DAPI to identify nuclei. Each horizontal strip represents 1 aggregate. All cells were imaged used the same gating. The white vertical line separates the brightfield image of aggregate from the fluorescent images. Scale bar: 20 μm. (H-J) Characterization of Ly6C+CD11b+ monocytes (MOs) and Ly6CloCD11blo macrophages in Kit+CD133+ aggregates after BMT from day 6 to day 16. There were too few events for analysis before day 6. Kit and CD133 were used for differentiation of SEP-involved aggregates from erythroblast-involved EBIs. n = 3-4 for each group per time point. (H) Representative flow cytometry charts. (I) Percent Ly6C+CD11b+ and Ly6CloCD11blo cells in SEP (Kit+CD133+) aggregates. (J) The percentage of donor-derived cells in each subpopulation of Kit+CD133+ aggregates. (K) Percent CD169+Vcam-1+ cells in Ly6C+CD11b+ SEP aggregates, Ly6CloCD11blo SEP aggregates, Ly6C+CD11b+Ter119+ EBIs, and Ly6CloCD11blo Ter119+ EBIs. NA, not applicable (no aggregates present at this time point). Bars are representative of mean ± SEM. Aggs, aggregates.
Splenic monocyte and macrophage populations were followed during the recovery from BMT. Days 1 and 2 represent the initial niche status, whereas the niche on days 6 to 16 after transplant corresponds to the expansion and maturation of stress burst forming units–erythroid.7 During the early stage, the numbers of monocytes (populations I and II) decreased, whereas pre-RPMs and RPMs maintained their levels; all of the populations were primarily recipient derived (Figure 2B-D). Starting on day 6, we observed an increase in Ly6Clo and Ly6Chi monocytes, which peaks at day 10 and continues until day 16. In contrast to the earlier time points, these monocytes were donor derived with 100% donor contribution by day 10. The numbers of pre-RPMs and RPMs also increased during these time points; however, the percentage of donor-derived pre-RPMs and RPMs was much less than the monocytes (Figure 2B-D). Further analysis showed that RPMs expressed high levels of F4/80, CD169, and Vcam1, whereas pre-RPMs generated from donor cells (after day 8) expressed much less F4/80 and slightly lower levels of CD169 and Vcam1. Ly6Clo monocytes expressed a low level of F4/80, but surprisingly expressed significant amounts of CD169 and Vcam1 (supplemental Figure 2B-D). In addition, we observed CD11b++Ly6C+cells that transiently appeared on day 2 and were recipient derived. They expressed an intermediate level of F4/80, Vcam-1, and CD169 (Figure 2B; supplemental Figure 2E). Consistent with increased monocytes, there was upregulation of the messenger RNA (mRNA) expression of the chemokine Ccl2 that peaked from days 6 to 8. The expression of Gdf15 and Bmp4, which are the key regulators of stress erythropoiesis, increased in concert with Ccl2 (supplemental Figure 2F). Overall, these data are similar to what we observed during the recovery from PHZ-induced anemia (supplemental Figure 2G); the spleen erythroid niche contains dynamic populations of monocytes and macrophages during the course of recovery from BMT.
Macrophages and monocytes are present in EBIs during the recovery from anemia
We next isolated EBIs from the spleen during the recovery from BMT and analyzed Ter119+ aggregates by flow cytometry and imaging flow cytometry. For this analysis, we simplified the gating strategy by characterizing monocytes as CD11b+Ly6C+, which included both Ly6Chi and Ly6Clo populations, and macrophages as CD11bloLy6Clo, which included both pre-RPMs and PRMs, respectively, to ensure sufficient events for analysis. Overall, both CD11b+Ly6C+ cells and CD11bloLy6Clo cells appeared in the Ter119+ EBIs during the whole recovery process (supplemental Figure 3A). In the early stage, days 1 and 2, we observed recipient-derived CD11b+Ly6C+ and CD11bloLy6Clo cells as well as a transient population of CD11b++Ly6C+ monocytes in the Ter119+ aggregates. From day 6 onwards, CD11b+Ly6C+ cells became more prevalent in EBIs, and they were almost entirely donor derived. In contrast, ∼30% to 50% of CD11bloLy6Clo cells in EBIs were donor derived (Figure 2E-F). Analysis of the expression of F4/80, CD169, and Vcam1 revealed that CD11bloLy6Clo cells expressed high levels of the 3 molecules as expected because this population contains pre-RPMs and RPMs. Unexpectedly, the expression of CD169 and Vcam1 was similar in CD11bloLy6Clo and CD11b+Ly6C+ cells, suggesting this expression pattern is associated with EBIs (supplemental Figure 3B-C). Analysis using Imaging flow cytometry showed that on days 1 and 2, monocytes and macrophages were surrounded with enucleated (DAPIneg) mature erythroid cells, while on days 6, 9, and 14, EBIs contained nucleated (DAPI+) erythroblasts as we observed in the spleens of PHZ-treated mice (Figure 2G). Furthermore, we observed a continuum of monocyte and macrophage markers confirming the idea that splenic EBIs contained a varied population of monocyte–macrophage-like cells.
Monocytes are associated with early SEPs
Our previous work showed that during BMT, early SEPs rapidly proliferate in the spleen that are characterized by the expression of Kit, Sca-1, CD34, and CD133 but not Ter119.6 We next tested whether these SEPs associate with monocytes and macrophages in EBIs. Using coexpression of Kit and CD133 to mark early SEPs, we isolated EBIs and analyzed the expression of monocyte and macrophage markers. Initially, we observed both CD11b+Ly6C+ and CD11bloLy6Clo cells associated with Kit+CD133+ aggregates (Figure 2H). However, starting from day 10, donor-derived CD11b+Ly6C+ cells were the predominant population in the Kit+CD133+ aggregates (Figure 2I-J). Unlike the CD11b+Ly6C+ cells that we observed in the Ter119+EBIs, these CD11b+Ly6C+ cells expressed lower levels of F4/80, CD169, and Vcam-1 (Figure 2K; supplemental Figure 3D-F), suggesting these early niche cells were phenotypically more monocyte-like. These observations suggested that the early CD133+Kit+ SEPs initially interact with monocytes that mature into pre-RPMs and RPMs as the erythroid progenitors differentiate.
Monocytes differentiate into niche macrophages
RPMs are tissue-resident macrophages that populate the spleen during embryonic development and are maintained by proliferation in the tissue.22,23,26 The observation of monocyte-like cells in Ter119+ EBIs and CD133+ EBIs suggests that EBIs contain cells derived from monocytes rather than only tissue-resident macrophages. To test this idea, we performed a monocyte lineage tracing study using Cx3cr1YFPCreER;tdTomato mice that express yellow fluorescence protein (YFP) and tamoxifen-inducible CreER from the Cx3cr1 promoter expressed in monocytes coupled with a ROSA26-Stopfl/fl-tdTomato cassette. tdTomato expression (tdTomato+) can be induced by tamoxifen treatment that marks descendants of Cx3cr1+monocytes.34 Without any tamoxifen treatment, YFP+ marks Ly6Chi and Ly6Clo monocytes and to a lesser extent pre-RPMs and RPMs. The YFPlo/neg expression in pre-RPMs and RPMs reflects the decay of YFP protein as the cell differentiated from a Cx3cr1+(YFP+) precursor (supplemental Figure 4A).
We first performed monocyte lineage tracing in the PHZ-induced anemia model (Figure 3A). Strikingly, >30% of live cells in the spleen and >70% of EBIs contained labeled cells (supplemental Figure 4B-C). Further analysis showed that YFP+tdTomatoneg, YFP+tdTomato+, and YFPnegtdTomato+ cells contributed to RPMs. The numbers of labeled F4/80+Vcam1+ mature RPMs increased from 24 to 96 hours after treatment, suggesting that these monocyte-derived RPMs are maturing during the recovery period (Figure 3B,D). When analyzing Ter119+ EBI aggregates, we identified a similar pattern where the percentage of labeled cells that were mature (F4/80+Vcam1+) RPMs increased during the recovery period, demonstrating that monocyte-derived RPMs are recruited to EBIs during the recovery period (Figure 3C,E). In addition to the monocyte-derived macrophages in the niche, we observed YFPnegtdTomato+ cells in EBIs that lacked expression of monocyte/macrophage markers. A portion of this population, however, expressed markers of type I conventional dendritic cells (cDCs) (CD11c+MHCII+CD8α+) (supplemental Figure 4D). These cells were previously demonstrated to express Scf and are required for stress erythropoiesis.35 cDCs share a common Cx3cr1+ precursor with monocytes that explains their labeling by the lineage tracing.36 Similarly, cDCs were also found enriched in both SEP EBIs and Ter119+ EBIs on day 12 after BMT (supplemental Figure 4E). This surprising observation expands our model of the splenic stress erythroid niche to include other support cells and further underscores the dynamic nature of splenic microenvironment.
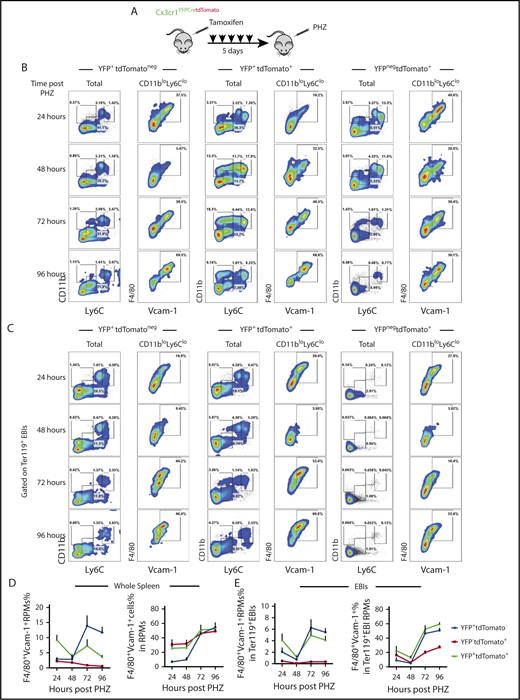
Monocytes give rise to RPMs in the spleen during the recovery from anemia induced by PHZ. (A) Cx3cr1YFPCreER;tdTomato mice were IP injected with tamoxifen in corn oil at 75 mg/kg body weight consecutively for 5 days prior to single PHZ injection at 100 mg/kg. n = 4 for each group per time point. At 24, 48, 72, and 96 hours after PHZ treatment, flow cytometry analysis was done to characterize monocytes, pre-RPMs, and RPMs in YFP+tdTomatoneg cells, YFP+tdTomato+ cells, and YFPnegtdTomato+ cells in whole spleens and Ter119+ EBIs. (B-C) Representative flow cytometry diagrams illustrating phenotypic dynamics of monocytes, pre-RPMs, and RPMs in (B) whole spleens and (C) enriched Ter119+EBIs. (D) Proportion of F4/80+Vcam-1+ Ly6CloCD11blo RPMs (left). The percentage of Ly6CloCD11blo RPMs that are F4/80+Vcam1+ (right) in the whole spleen. (E) Proportion of F4/80+Vcam-1+ Ly6CloCD11blo RPMs (left) and the percentage of Ly6CloCD11blo RPMs that are F4/80+Vcam1+ (right) in Ter119+EBIs.
Monocytes give rise to RPMs in the spleen during the recovery from anemia induced by PHZ. (A) Cx3cr1YFPCreER;tdTomato mice were IP injected with tamoxifen in corn oil at 75 mg/kg body weight consecutively for 5 days prior to single PHZ injection at 100 mg/kg. n = 4 for each group per time point. At 24, 48, 72, and 96 hours after PHZ treatment, flow cytometry analysis was done to characterize monocytes, pre-RPMs, and RPMs in YFP+tdTomatoneg cells, YFP+tdTomato+ cells, and YFPnegtdTomato+ cells in whole spleens and Ter119+ EBIs. (B-C) Representative flow cytometry diagrams illustrating phenotypic dynamics of monocytes, pre-RPMs, and RPMs in (B) whole spleens and (C) enriched Ter119+EBIs. (D) Proportion of F4/80+Vcam-1+ Ly6CloCD11blo RPMs (left). The percentage of Ly6CloCD11blo RPMs that are F4/80+Vcam1+ (right) in the whole spleen. (E) Proportion of F4/80+Vcam-1+ Ly6CloCD11blo RPMs (left) and the percentage of Ly6CloCD11blo RPMs that are F4/80+Vcam1+ (right) in Ter119+EBIs.
Next, we performed the lineage tracing in the transplant model. We used donor BM cells from Cx3cr1YFPCreER;tdTomato mice and CD45.1+ irradiated recipient mice (Figure 4A). We observed YFPnegtdTomato+ and YFP+tdTomato+ cells contributing to both RPMs and pre-RPMs. We also observed YFP+tdTomatoneg cells that developed from monocytes born after transplant contributing to pre-RPMs and RPMs (supplemental Figure 5A-B); however, the overall intensity of YFP expression decreased over time (supplemental Figure 5D). The percentage of labeled pre-RPMs and RPMs was highest on day 10 and decreased on days 14 and 16, which coincides with the decrease in terminal differentiation (Figure 4B-D). Analysis of Ter119+EBI aggregates showed that similar to the analysis of whole spleen, labeled cells were present as pre-RPM and RPM EBIs with the YFP+tdTomatoneg monocytes making a large contribution to Ter119+ aggregates (Figure 4E-G). The monocytic contribution to RPMs was further confirmed by transplanting tdTomato+-purified monocytes mixed with donor unlabeled BM cells (supplemental Figure 6A). Within the tdTomato+ population, we observed monocytes (CD11b+Ly6C+F4/80int), pre-RPMs (CD11b+Ly6C+F4/80+), and RPMs (CD11bloLy6CloF4/80hiVcam-1hi) populations in the spleen and in EBIs (supplemental Figure 6B-C), demonstrating that donor tdTomato+ monocytes give rise to pre-RPMs and RPMs that contribute to the splenic niche during the recovery from BMT. However, monocytes do not directly give rise to cDCs in EBIs (supplemental Figure 6D), consistent with the idea that cDCs may come from Cx3cr1+ precursors.
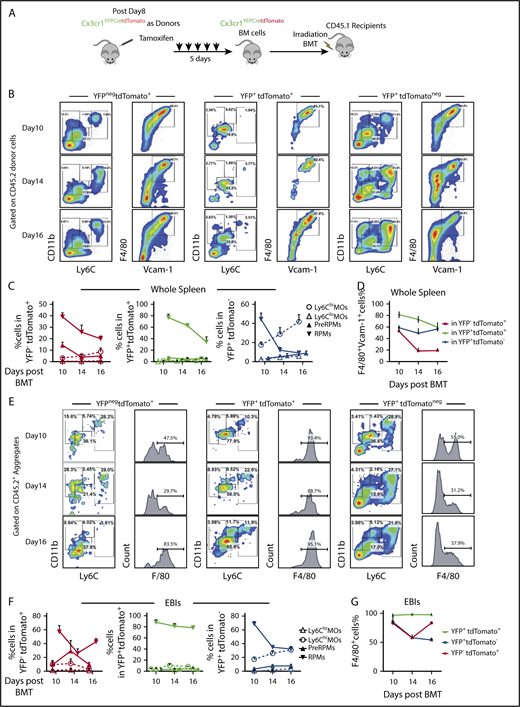
Monocytes give rise to RPMs in the spleen during the recovery from anemia posttransplant. (A) Schematic for monocyte lineage tracing in middle and late recovery stage, where monocytes were donor derived. Cx3cr1YFPCreER;tdTomato donor mice were IP injected with tamoxifen in corn oil at 75 mg/kg body weight consecutively for 5 days. BM cells were obtained and transplanted into CD45.1 recipient mice. Flow cytometry analysis was done on cells first gated on CD45.2+ donor cells from day 8, day 10, day 14, and day 16 after transplant. Gating strategies used in Figure 2A were used. n = 3-4 for each group per time point. (B-D) Characterization of monocyte and macrophage subpopulations in YFPnegtdTomato+, YFP+tdTomato+, and YFP+tdTomatoneg cells from whole spleens. (B) Representative flow cytometry diagrams showing CD11b and Ly6C expression or F4/80 and Vcam1 expression in the indicated populations of labeled cells. (C) Percent Ly6Chi monocytes, Ly6Clo monocytes, pre-RPMs, and PRMs in YFPnegtdTomato+ (left), YFP+tdTomato+ (middle), and YFP+tdTomatoneg (right) cells. (D) Percent of F4/80+Vcam-1+ cells in YFPnegtdTomato+, YFP+ tdTomato+, and YFP+tdTomatoneg cells. (E-G) Characterization of monocyte and macrophage subpopulations in YFPnegtdTomato+, YFP+tdTomato+, and YFP+tdTomatoneg EBIs. (E) Representative flow cytometry diagrams of showing CD11b and Ly6C expression or F4/80 expression in the indicated populations of labeled cells in recipient-derived Ter119+ EBIs. (F) Percent Ly6Chi monocytes, Ly6Clo monocytes, pre-RPMs, and PRMs in YFPnegtdTomato+ (left), YFP+ tdTomato+ (middle), and YFP+tdTomatoneg (right) EBIs. (G) Percent of F4/80+ cells in YFPnegtdTomato+, YFP+ tdTomato+, and YFP+tdTomatoneg EBIs. Bars are representative of mean ± SEM.
Monocytes give rise to RPMs in the spleen during the recovery from anemia posttransplant. (A) Schematic for monocyte lineage tracing in middle and late recovery stage, where monocytes were donor derived. Cx3cr1YFPCreER;tdTomato donor mice were IP injected with tamoxifen in corn oil at 75 mg/kg body weight consecutively for 5 days. BM cells were obtained and transplanted into CD45.1 recipient mice. Flow cytometry analysis was done on cells first gated on CD45.2+ donor cells from day 8, day 10, day 14, and day 16 after transplant. Gating strategies used in Figure 2A were used. n = 3-4 for each group per time point. (B-D) Characterization of monocyte and macrophage subpopulations in YFPnegtdTomato+, YFP+tdTomato+, and YFP+tdTomatoneg cells from whole spleens. (B) Representative flow cytometry diagrams showing CD11b and Ly6C expression or F4/80 and Vcam1 expression in the indicated populations of labeled cells. (C) Percent Ly6Chi monocytes, Ly6Clo monocytes, pre-RPMs, and PRMs in YFPnegtdTomato+ (left), YFP+tdTomato+ (middle), and YFP+tdTomatoneg (right) cells. (D) Percent of F4/80+Vcam-1+ cells in YFPnegtdTomato+, YFP+ tdTomato+, and YFP+tdTomatoneg cells. (E-G) Characterization of monocyte and macrophage subpopulations in YFPnegtdTomato+, YFP+tdTomato+, and YFP+tdTomatoneg EBIs. (E) Representative flow cytometry diagrams of showing CD11b and Ly6C expression or F4/80 expression in the indicated populations of labeled cells in recipient-derived Ter119+ EBIs. (F) Percent Ly6Chi monocytes, Ly6Clo monocytes, pre-RPMs, and PRMs in YFPnegtdTomato+ (left), YFP+ tdTomato+ (middle), and YFP+tdTomatoneg (right) EBIs. (G) Percent of F4/80+ cells in YFPnegtdTomato+, YFP+ tdTomato+, and YFP+tdTomatoneg EBIs. Bars are representative of mean ± SEM.
Early after BMT (days 1-4), our data showed that most of EBI macrophages were recipient derived. To examine if these EBI macrophages were derived from monocytes, we performed BMT using Cx3cr1YFPCreER;tdTomato mice as recipients and CD45.1+ control BM cells as donors (Figure 5A). Both YFP+tdTomato+ and YFPnegtdTomato+ cells were observed in whole spleens and EBIs on day 2 and day 4 after BMT (Figure 5B). The percentage of RPMs (F4/80+Vcam1+) in whole spleen increased from day 2 to day 4. This observation was further supported by analysis of YFP+tdTomato+ pre-RPMs or RPMs where the percentage of F4/80+Vcam1+ cells increased from days 2 to 4, suggesting that monocytes are differentiating into pre-RPMs and then to RPMs (Figure 5C-E; supplemental Figure 5C). This increase in labeled RPMs was also observed in Ter119+ aggregates, while at the same time the contribution of labeled monocytes decreased (Figure 5F-H).

Recipient-derived monocytes are a source of RPMs in early stress erythropoietic niches. (A) Schematic of monocytes lineage tracing procedure in early recovery stage, where niche monocytes and macrophages are mostly recipient derived. Cx3cr1YFPCreER;tdTomato recipient mice were IP injected with tamoxifen in corn oil at a dose of 75 mg/kg body weight daily for 5 days prior to irradiation and transplantation with CD45.1 wild-type donor BM cells. Flow cytometry analysis was applied on gated CD45.2+ recipient cells on days 2 and 4 after transplant. Gating strategies applied from Figure 2A. n = 3-4 for each group per time point. (B) Representative flow cytometry diagrams illustrating YFP and tdTomato expression in whole spleen and enriched Ter119+EBIs (left). The percentage of YFP+tdTomatoneg, YFP+tdTomato+, and YFPnegtdTomato+ cells in CD45.2+ recipient cells (middle) and the percentage of YFP+tdTomatoneg, YFP+tdTomato+, and YFPnegtdTomato+ cells in CD45.2+ EBIs (right) are shown for the indicated time points. (C-E) Characterization of monocyte and macrophage subpopulations in YFP+tdTomatoneg cells and YFPnegtdTomato+ cells in whole spleens. (C) Representative flow cytometry diagrams showing CD11b and Ly6C expression or F4/80 and Vcam1 expression in the indicated populations of labeled cells. (D) The percentages of Ly6Chi monocytes, Ly6Clo monocytes, pre-RPMs, and PRMs in YFPnegtdTomato+ (left) and YFP+ tdTomato+ (right) populations of labeled cells. (E) The percentage of F4/80+ and Vcam-1+ cells in YFP+ tdTomato+ cells and YFPnegtdTomato+ populations of labeled cells. (F-H) Characterization of monocyte and macrophage subpopulations in YFP+tdTomato+Ter119+ EBIs and YFPneg tdTomato+Ter119+ EBIs. (F) Representative flow cytometry diagrams showing CD11b and Ly6C expression or F4/80 expression in the indicated populations of labeled cells in recipient-derived Ter119+ EBIs. (G) The percentage of CD11b++Ly6C+, Ly6Chi, Ly6Clo monocytes, pre-RPMs, and RPMs in YFPnegtdTomato+Ter119+ EBIs (left) and YFP+ tdTomato+Ter119+ EBIs (right). (H) The percentage of F4/80+ cells in YFP+ tdTomato+EBIs and YFPnegtdTomato+EBIs. Bars are representative of mean ± SEM.
Recipient-derived monocytes are a source of RPMs in early stress erythropoietic niches. (A) Schematic of monocytes lineage tracing procedure in early recovery stage, where niche monocytes and macrophages are mostly recipient derived. Cx3cr1YFPCreER;tdTomato recipient mice were IP injected with tamoxifen in corn oil at a dose of 75 mg/kg body weight daily for 5 days prior to irradiation and transplantation with CD45.1 wild-type donor BM cells. Flow cytometry analysis was applied on gated CD45.2+ recipient cells on days 2 and 4 after transplant. Gating strategies applied from Figure 2A. n = 3-4 for each group per time point. (B) Representative flow cytometry diagrams illustrating YFP and tdTomato expression in whole spleen and enriched Ter119+EBIs (left). The percentage of YFP+tdTomatoneg, YFP+tdTomato+, and YFPnegtdTomato+ cells in CD45.2+ recipient cells (middle) and the percentage of YFP+tdTomatoneg, YFP+tdTomato+, and YFPnegtdTomato+ cells in CD45.2+ EBIs (right) are shown for the indicated time points. (C-E) Characterization of monocyte and macrophage subpopulations in YFP+tdTomatoneg cells and YFPnegtdTomato+ cells in whole spleens. (C) Representative flow cytometry diagrams showing CD11b and Ly6C expression or F4/80 and Vcam1 expression in the indicated populations of labeled cells. (D) The percentages of Ly6Chi monocytes, Ly6Clo monocytes, pre-RPMs, and PRMs in YFPnegtdTomato+ (left) and YFP+ tdTomato+ (right) populations of labeled cells. (E) The percentage of F4/80+ and Vcam-1+ cells in YFP+ tdTomato+ cells and YFPnegtdTomato+ populations of labeled cells. (F-H) Characterization of monocyte and macrophage subpopulations in YFP+tdTomato+Ter119+ EBIs and YFPneg tdTomato+Ter119+ EBIs. (F) Representative flow cytometry diagrams showing CD11b and Ly6C expression or F4/80 expression in the indicated populations of labeled cells in recipient-derived Ter119+ EBIs. (G) The percentage of CD11b++Ly6C+, Ly6Chi, Ly6Clo monocytes, pre-RPMs, and RPMs in YFPnegtdTomato+Ter119+ EBIs (left) and YFP+ tdTomato+Ter119+ EBIs (right). (H) The percentage of F4/80+ cells in YFP+ tdTomato+EBIs and YFPnegtdTomato+EBIs. Bars are representative of mean ± SEM.
Taken together, these data show that monocytes give rise to pre-RPMs and RPMs that contribute the expanding splenic erythroid niche.
Erythrophagocytosis marks Ccl2 producing cells
The maturation of RPMs from monocytes requires the transcription factor SpiC.29 Analysis of EBI aggregates during the recovery from BMT shows that SpiC mRNA expression increased and was maintained during recovery (Figure 6A). Heme-dependent signaling regulates the activation of SpiC expression.29 Erythrophagocytosis can lead to increases in intracellular heme, which can activate SpiC expression. To determine whether erythrophagocytosis increases during recovery, we transfused recipient mice with carboxyfluorescein diacetate succinimidyl ester (CFSE)-labeled erythrocytes prior to BMT (Figure 6B). Spleen mononuclear cells were analyzed on days 1 to 4 after transplant. CFSE+ cells were readily apparent on each day (Figure 6C). Analysis of CD11b, Ly6C, and F4/80 expression on CFSE+ cells showed that early on both monocytes (CD11b+Ly6ChiF4/80lo/−) and RPMs (CD11bloLy6CloF4/80+) were labeled with CFSE. The population of monocytes steadily decreased and was mostly lost by day 4, whereas the population of CFSE+ RPMs increased (Figure 6D-F). These data support the hypothesis that increased erythrophagocytosis promotes the differentiation of monocytes into RPMs during recovery from BMT.
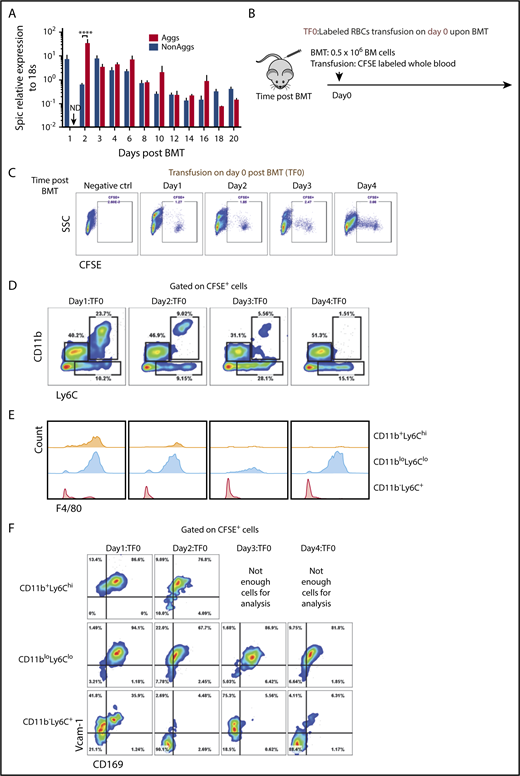
Increased erythrophagocytosis is an early event after BMT. (A) Spic mRNA expression relative to 18S ribosomal RNA in non-EBI aggregates and EBI Aggs. n = 3-4 for each group per time point. ND, not detectable. (B) Schematic of experimental design of erythrophagocytosis analysis. Whole blood was obtained from control mice and labeled with CFSE. Blood (150-200 μL) was removed from recipient mice before transfusion with labeled red blood cells (RBCs). Labeled RBCs were transfused into mice on the same day (day 0) as transplant. Whole spleen cells were harvested followed by RBC lysis. CFSE+ cells were analyzed by flow cytometry to identify cells that have phagocytosed labeled erythrocytes. n = 4 for each group per time point. (C) Representative flow cytometry diagrams of CFSE+ cells analysis. (D) Flow cytometry analysis of CD11b and Ly6C expression by CFSE+ cells. (E) Histograms illustrating F4/80 expression on CFSE+ CD11b+Ly6Chi, CD11bloLy6Clo, and CD11b−Ly6C+ cells. (F) Flow cytometry analysis of Vcam-1 and CD169 expression on CFSE+ CD11b+Ly6Chi, CD11bloLy6Clo, and CD11b−Ly6C+ cells.
Increased erythrophagocytosis is an early event after BMT. (A) Spic mRNA expression relative to 18S ribosomal RNA in non-EBI aggregates and EBI Aggs. n = 3-4 for each group per time point. ND, not detectable. (B) Schematic of experimental design of erythrophagocytosis analysis. Whole blood was obtained from control mice and labeled with CFSE. Blood (150-200 μL) was removed from recipient mice before transfusion with labeled red blood cells (RBCs). Labeled RBCs were transfused into mice on the same day (day 0) as transplant. Whole spleen cells were harvested followed by RBC lysis. CFSE+ cells were analyzed by flow cytometry to identify cells that have phagocytosed labeled erythrocytes. n = 4 for each group per time point. (C) Representative flow cytometry diagrams of CFSE+ cells analysis. (D) Flow cytometry analysis of CD11b and Ly6C expression by CFSE+ cells. (E) Histograms illustrating F4/80 expression on CFSE+ CD11b+Ly6Chi, CD11bloLy6Clo, and CD11b−Ly6C+ cells. (F) Flow cytometry analysis of Vcam-1 and CD169 expression on CFSE+ CD11b+Ly6Chi, CD11bloLy6Clo, and CD11b−Ly6C+ cells.
The lineage tracing experiments showed that monocytes infiltrated into the spleen and became niche macrophages. Ccl2 is a monocyte chemoattractant. Ccl2+ cells in the spleen increased in the first 4 days after transplant (Figure 7A). In fact, Ccl2 mRNA expression rapidly increased in the first 6 to 12 hours after irradiation, and its expression was enriched in the CFSE+F4/80+ population (Figure 7B). Furthermore, Ccl2 protein expression was limited to CFSE+ cells, and by day 4, all CFSE+ cells were Ccl2+, suggesting that erythrophagocytosis promotes Ccl2 production (Figure 7C). We tested this idea in vitro by stimulating adherent spleen stromal cells with aged red blood cells. This stimulation led to a significant increase in Ccl2 mRNA expression (supplemental Figure 7A-B). Further analysis showed that Ccl2+ cells contained CD11b+Ly6C+ monocytes and CD11bloLy6CloF4/80+ RPMs. The percentage of Ccl2+ monocytes decreased as Ccl2+ RPMs increased, suggesting that Ccl2-producing phagocytic monocytes mature into RPMs (Figure 7D).

Ccl2 production increases early after BMT and plays a role in the recruitment of monocytes into the spleen. (A) Percentage of Ccl2+ cells in whole spleens on days 1, 2, 4, and 6 after BMT. (B) Ccl2 mRNA expression relative to 18S rRNA in sorted spleen F4/80+CFSE+ and F4/80+CFSEneg cells at 1, 6, and 12 hours after lethal irradiation. (C) Flow cytometry analysis of Ccl2 production in F4/80+CFSE+ cells (red) and F4/80+CFSEneg cells (blue) after BMT. (D) Representative flow cytometry diagrams of monocytes and macrophage subpopulations in Ccl2+ cells. (top) CD11b and Ly6C expression of Ccl2+cells. (bottom) F4/80 expression on Ccl2+CD11bloLy6Clo cells. (E-H) Quantitation of spleen monocytes and CD133+Kit+ SEPs in Ccl2 mutant BMT model. Ccl2−/− (knockout, KO) or wild-type (WT) recipients were transplanted with 0.5 × 10⁶Ccl2−/− or WT BM cells as donors. KO → KO: Ccl2−/− donors to Ccl2−/− recipients; KO → WT: Ccl2−/− donors to WT recipients; WT → KO: WT donors to Ccl2−/− recipients; WT → WT: WT donors to WT recipients. Time points included day 8, day 10, and day 12 after BMT. n = 3-4 for each group per time point. (E-F) Total cell numbers of (E) Ly6Chi monocytes and (F) Ly6Clo monocytes in whole spleens. (G) Percent (left) and total cells numbers (right) of CD133+Kit+ SEPs in whole spleens. (H-I) Quantitation of spleen monocytes and CD133+Kit+ SEPs in Ccr2 mutant BMT model. WT recipients were transplanted with 0.5 × 10⁶Ccr2−/− or WT BM cells as donors. (H) Fold change of monocytes and (I) SEPs. n = 2-3 for each group per time point. (J) Model showing the dynamic nature of the splenic stress erythropoiesis niche.
Ccl2 production increases early after BMT and plays a role in the recruitment of monocytes into the spleen. (A) Percentage of Ccl2+ cells in whole spleens on days 1, 2, 4, and 6 after BMT. (B) Ccl2 mRNA expression relative to 18S rRNA in sorted spleen F4/80+CFSE+ and F4/80+CFSEneg cells at 1, 6, and 12 hours after lethal irradiation. (C) Flow cytometry analysis of Ccl2 production in F4/80+CFSE+ cells (red) and F4/80+CFSEneg cells (blue) after BMT. (D) Representative flow cytometry diagrams of monocytes and macrophage subpopulations in Ccl2+ cells. (top) CD11b and Ly6C expression of Ccl2+cells. (bottom) F4/80 expression on Ccl2+CD11bloLy6Clo cells. (E-H) Quantitation of spleen monocytes and CD133+Kit+ SEPs in Ccl2 mutant BMT model. Ccl2−/− (knockout, KO) or wild-type (WT) recipients were transplanted with 0.5 × 10⁶Ccl2−/− or WT BM cells as donors. KO → KO: Ccl2−/− donors to Ccl2−/− recipients; KO → WT: Ccl2−/− donors to WT recipients; WT → KO: WT donors to Ccl2−/− recipients; WT → WT: WT donors to WT recipients. Time points included day 8, day 10, and day 12 after BMT. n = 3-4 for each group per time point. (E-F) Total cell numbers of (E) Ly6Chi monocytes and (F) Ly6Clo monocytes in whole spleens. (G) Percent (left) and total cells numbers (right) of CD133+Kit+ SEPs in whole spleens. (H-I) Quantitation of spleen monocytes and CD133+Kit+ SEPs in Ccr2 mutant BMT model. WT recipients were transplanted with 0.5 × 10⁶Ccr2−/− or WT BM cells as donors. (H) Fold change of monocytes and (I) SEPs. n = 2-3 for each group per time point. (J) Model showing the dynamic nature of the splenic stress erythropoiesis niche.
We next investigated the role of Ccl2 by using Ccl2−/− mice as donors and recipients in BMT. On day 10 posttransplant, we observed delayed recruitment of Ly6Chi and Ly6Clo monocytes into the spleen when Ccl2−/− donor cells were used. This effect was exacerbated when Ccl2−/− donor cells were transplanted into Ccl2−/− recipients. Despite this early defect, mutant groups reached a similar level as the controls by day 12 (Figure 7E-F). Analysis of Kit+CD133+ SEP expansion showed that it was also delayed at day 10 when Ccl2−/− was mutated in the donor cells and the recipients (Figure 7G; supplemental Figure 7C-D). However, control recipient mice appeared normal when transplanted with mutant donor cells, suggesting that recipient-derived Ccl2 plays a role in recruiting monocytes. We extended this analysis using donor cells that lacked the Ccl2 receptor, Ccr2. We observed reduced recruitment splenic monocytes and impaired expansion of SEPs, which was more severe than that observed with transplants using Ccl2−/− donors and recipients (Figure 7H-I). Together, these data suggested that Ccr2 and its ligands, including Ccl2, regulate monocyte influx into the spleen.
Discussion
In this study, we demonstrate that the splenic stress erythropoiesis niche is a dynamic structure that expands in concert with the expansion of the SEPs (Figure 7J). Lineage tracing experiments showed that the expansion of the niche relied on the influx of monocytes that gave rise to pre-RPMs and RPMs in EBIs. The monocyte/macrophage populations associated with EBI were heterogeneous as they expressed markers associated with a developmental continuum of monocytes, pre-RPMs, and RPMs. Despite this heterogeneity, the data support a model where the maturation of SEPs is coupled with monocytes/macrophages maturation. This trend was best exemplified in the BMT model where the most immature CD133+Kit+ SEPs were associated with CD11b+Ly6C+ cells expressing lower levels of F4/80, CD169, and Vcam1 that appeared to be more “monocyte-like,” whereas Ter119+ EBIs contained pre-RPMs and RPMs that expressed CD169 and Vcam1. The expression of CD169 on EBI macrophages is consistent with the data from Chow et al17,18 that deletion of CD169+ cells severely compromised stress erythropoiesis. The idea that monocytes may mature in concert with SEPs is consistent with human in vitro experiments showing that CD14+ monocytes improve erythroid differentiation in CD34+ cell cultures.37 Furthermore, treatment of CD14+ monocytes with glucocorticoids leads to their maturation into macrophages that express CD169 and other markers associated with EBIs such as CD163.37,38 The macrophages derived from CD14+ cells also exhibit properties similar to CD163+ erythroblast supporting macrophages found in fetal liver and BM.39 These macrophages are highly motile and exhibit increased interactions with erythroblasts in vitro. Corticosteroids increase in response to anemic stress (L. Bennett and R.F.P., unpublished data, 2017), suggesting a role of glucocorticoids in monocyte development during stress erythropoiesis, however, it is not well understood. Work from Jacobsen et al40-42 showed that BM EBI macrophages are F4/80+CD11b+Vcam1+ER-H3+CD169+Ly6G+, and depletion by granulocyte colony-stimulating factor treatment leads to a loss of medullary erythropoiesis. We did not detect any Ly6G+ cells in the splenic stress erythropoiesis niche, which fits with the observation that splenic erythropoiesis was not affected by granulocyte colony-stimulating factor treatment. These data suggest that BM medullary EBIs are different than stress EBIs.
RPMs are tissue-resident macrophages that are thought to be seeded into the fetal spleen by yolk sac–derived progenitors.22-25 Tissue-resident macrophages for the most part are not replenished by monocytes.26,33 Ulyanova et al43 showed that the CD11blo macrophages expanded in response to PHZ-induced hemolytic anemia from which they concluded that proliferation of tissue-resident macrophages expands the niche. Paradoxically, they also showed that SpiC−/− mice recovered normally from PHZ-induced anemia despite the fact that these mice have few RPMs in their spleens. Using lineage tracing, we show that the CD11blo population is derived from Cx3cr1+ monocytes. This observation is consistent with data from Haldar et al,29 which showed that heme-dependent signaling induced the differentiation of monocytes into pre-RPMs (CD11b+Ly6C+SpiClo) and RPMs (F4/80hiCD11bloSpiChi). We also observe an increase in SpiC expression during the recovery from anemia associated with increased erythrophagocytosis, which is consistent with heme-dependent activation of SpiC expression. The question still remains that if SpiC is required for the development of RPMs, why do SpiC−/− mice recover normally from acute anemia? Our data show that the majority of Ter119+ EBIs contain pre-RPMs. It is possible that in SpiC−/− mice, monocyte-derived “pre-RPMs” can develop sufficiently to contribute to the splenic erythroid niche. Contrarily, as mentioned above, other signals (like corticosteroids) could contribute to the maturation of monocytes in the spleen such that the SpiC−/− niche is sufficient to support stress erythropoiesis.
Although tissue-resident macrophages are usually not replaced by monocyte-derived macrophages, this requirement is not absolute.44 Kupffer cells in the liver are tissue-resident macrophages. During infection or loss due to liver damage, new Kupffer cells are generated from monocytes.45 These data suggest that at times of need or regeneration, monocytes can generate tissue-resident macrophages that resemble yolk sac–derived macrophages. The contributions of monocytes to tissue-resident macrophages can be transient. The demand for iron recycling macrophages in the liver induces monocytes to infiltrate the liver and that transiently provides new iron recycling macrophages.46 This process is regulated by an increase in chemokine expression, primarily Ccl2 and Ccl3. We observe a similar increase in the expression of Ccl2 by cells actively phagocytosing erythrocytes. These data suggest that erythrophagocytosis is an early event that leads to the recruitment of monocytes to expand the niche. These data complement other work from our laboratory where erythrophagocytosis by macrophages induces the expression of Bmp4 and Gdf15, 2 factors that promote the proliferation and development of SEPs (L. Bennett and R.F.P., unpublished data, 2017). Analysis of the niche also showed that type1 cDCs are also recruited. These cells express membrane-bound Scf, which is also required for the proliferation of SEPs.35 Taken together, our data support a model where anemic stress not only induces the proliferation and differentiation of SEPs but also coordinates the expansion and development of the splenic stress erythroid niche.
The online version of this article contains a data supplement.
The publication costs of this article were defrayed in part by page charge payment. Therefore, and solely to indicate this fact, this article is hereby marked “advertisement” in accordance with 18 USC section 1734.
Acknowledgments
The authors thank members of the Prabhu and Paulson laboratories for their timely help and suggestions and Margherita Cantorna and Na Xiong for providing reagents and advice.
This work was supported, in part, by grants from the National Institutes of Health, National Institute of Diabetes and Digestive and Kidney Diseases R01 DK077152, Office of Dietary Supplements (K.S.P.), and R01 DK080040 (R.F.P.), and USDA-NIFA Hatch project numbers 4605 (K.S.P.) and 4581 (R.F.P.).
Authorship
Contribution: C.L. performed experiments and wrote the manuscript; and K.S.P. and R.F.P. supervised and conceived the study, secured funds, and wrote the manuscript.
Conflict-of-interest disclosure: The authors declare no competing financial interests.
Correspondence: Robert F. Paulson, Department of Veterinary and Biomedical Sciences, Center for Molecular Immunology and Infectious Disease, The Pennsylvania State University, 115 Henning Building, University Park, PA 16802; e-mail: rfp5@psu.edu; and K. Sandeep Prabhu, Department of Veterinary and Biomedical Sciences, Center for Molecular Immunology and Infectious Disease, The Pennsylvania State University, 115 Henning Building, University Park, PA 16802; e-mail: ksp4@psu.edu.

This feature is available to Subscribers Only
Sign In or Create an Account Close Modal