

Key Points
RPS15 alterations in CLL induce mutation-dependent changes in global protein synthesis and translational fidelity.
RPS15 mutations disrupt cellular proteostasis via proteomic changes mainly affecting messenger RNA translation, as well as cell metabolism.

Abstract
Genomic studies have recently identified RPS15 as a new driver gene in aggressive and chemorefractory cases of chronic lymphocytic leukemia (CLL). RPS15 encodes a ribosomal protein whose conserved C-terminal domain extends into the decoding center of the ribosome. We demonstrate that mutations in highly conserved residues of this domain affect protein stability, by increasing its ubiquitin-mediated degradation, and cell-proliferation rates. On the other hand, we show that mutated RPS15 can be loaded into the ribosomes, directly impacting on global protein synthesis and/or translational fidelity in a mutation-specific manner. Quantitative mass spectrometry analyses suggest that RPS15 variants may induce additional alterations in the translational machinery, as well as a metabolic shift at the proteome level in HEK293T and MEC-1 cells. These results indicate that CLL-related RPS15 mutations might act following patterns known for other ribosomal diseases, likely switching from a hypo- to a hyperproliferative phenotype driven by mutated ribosomes. In this scenario, loss of translational fidelity causing altered cell proteostasis can be proposed as a new molecular mechanism involved in CLL pathobiology.
Introduction
Chronic lymphocytic leukemia (CLL) is a hematological malignancy in which mature clonal B lymphocytes accumulate in the blood, bone marrow, and lymphoid tissues.1 It has been traditionally split into 2 main prognostic categories, depending on whether tumor cells express B-cell receptor with immunoglobulin heavy chain variable (IGHV) genes bearing somatic hypermutation or not; the latter is associated with worse prognosis.2-5 In recent years, next-generation sequencing (NGS) studies have helped to decipher the genetic landscape of CLL.6 This has led to the identification of >50 CLL driver genes, including the recurrently mutated NOTCH1, ATM, SF3B1, CHD2, and RPS15.7-12 The power of NGS has also been used to define the association between the nature and number of genetic alterations and disease prognosis, as well as to depict the evolutionary mutational history of CLL,7,8,13 setting the basis for anticipation-based therapeutic approaches.14
RPS15 was identified as a new CLL driver gene with a mutation frequency ranging from <1% in a cohort mostly composed of untreated patients at early disease stages7 to 4.3% in a group of patients enriched for relapsed CLL.8 More recently, targeted studies have reported frequencies of 19.5% in relapsing CLL15 and 12% in a cohort enriched for del(17p) CLL.16 The RPS15 gene encodes the ribosomal protein RPS15 of the 40S ribosomal subunit, which acts as a nuclear export factor of this ribosomal component.17 In addition, a role for RPS15 in the regulation of the MDM2-p53-MDMX network has been proposed,18 as well as a putative defect in p53 stabilization by RPS15 mutants in CLL.15 Nevertheless, the mechanisms that link RPS15 mutations with CLL pathogenesis are unclear and have not been explored from the point of view of the main functional roles of RPS15: messenger RNA (mRNA) translation and protein synthesis.
Materials and methods
Patients and samples
Samples from 216 previously untreated CLL patients were used as an extended validation series. Tumor cells were purified as previously described.19 The median final fraction of tumor content was 97%, with 82% of the samples containing >85%, as determined by flow cytometry. This study was approved by the Ethics Committee at Hospital Clínic of Barcelona. All patients gave informed consent according to the International Cancer Genome Consortium (ICGC) guidelines.20
Mutational status of RPS15 in the extended cohort
The mutational status of the hotspot region of RPS15 was analyzed by deep-targeted NGS in the 216 patients of the validation cohort. Primers were designed with the D3 Assay Design tool (https://www.fluidigm.com/assays) (supplemental Table 1, available on the Blood Web site). Detailed information about library preparation, sequencing, and bioinformatic analysis is provided in supplemental Methods, available on the Blood Web site.
Cell culture, transfection, transduction, proliferation, and viability analyses
MEC-1 cells were maintained in I10F culture media, and HEK293T and HeLa cells were maintained in D10F. Cells were grown in a humidified atmosphere at 37°C with 5% CO2. Transfections were carried using Lipofectamine plus (Invitrogen), following the manufacturer’s protocols. Detailed information about media, reagents, plasmids, lentiviral transduction, cell proliferation and viability assays can be found in supplemental Methods.
Western blotting
Cells were lysed in Nonidet P-40 lysis buffer. Protein concentration was determined using a Pierce BCA Protein Assay Kit (Thermo Scientific). Proteins were separated by sodium dodecyl sulfate polyacrylamide gel electrophoresis (SDS-PAGE) and transferred to polyvinylidene difluoride membranes. Membranes were blocked with TBS with Tween 20–5% bovine serum albumin and incubated overnight at 4°C with primary antibodies diluted in Tween 20–1% bovine serum albumin. After washing, membranes were incubated with fluorescently labeled secondary antibodies (supplemental Table 2) and scanned on an Odyssey infrared scanner (LI-COR).
DNA and RNA isolation and quantitative real-time PCR
Total DNA and RNA were extracted with a FlexiGene DNA Kit and an RNeasy Kit, respectively (both from QIAGEN), according to the manufacturer’s instructions. RNA was retrotranscribed using a SuperScript III First-Strand Synthesis System (Invitrogen). Quantitative polymerase chain reaction (qPCR) was performed using Power SYBR Green PCR Master Mix in a 7300 Real-Time PCR System (Applied Biosystems). The primers used are listed in supplemental Table 1. β-actin was used to normalize DNA or mRNA samples.
Ribosome fractionation and purification
Cells (∼5 × 10⁷) were lysed in ribosome homogenization buffer for 30 minutes and centrifuged at 14 000 rpm to remove debris. The supernatant was loaded on Sucrose Cushion Buffer and centrifuged for 20 hours at 40 000 rpm. The pellet containing ribosomes was resuspended in lysis buffer, quantified, and analyzed by immunoblotting.
IP and immunofluorescence microscopy analysis
HEK293T cells (∼107 cells per immunoprecipitation [IP]) were lysed in coimmunoprecipitation lysis buffer, and cell lysates were clarified by centrifugation at 14 000 rpm. One milligram of protein extract per IP was incubated overnight at 4°C with rabbit anti-GFP antibody, followed by a 2-hour incubation with Dynabeads Protein G (Invitrogen). Then, beads were washed with coimmunoprecipitation washing buffer using a DynaMag magnet (Invitrogen) and eluted by boiling in SDS-PAGE loading buffer. Finally, samples were analyzed by immunoblotting. Detailed information about immunofluorescence microscopy analysis is available in supplemental Methods.
Analysis of global protein synthesis
HEK293T cells (5 × 10⁶ cells per time point) were incubated in methionine- and cysteine-free Dulbecco’s modified Eagle medium containing 10% dialyzed fetal bovine serum for 12 hours. Then, 35S-Met/Cys (0.1 mCi/mL; PerkinElmer) was added to the cells. Cell lysates were prepared as above, and equal amounts of total protein were separated by SDS-PAGE and transferred to polyvinylidene difluoride membranes. Membranes were exposed to imaging plates and imaged in a FLA 7000 scanner (Fujifilm). 35S-Met/Cys incorporation was determined using MultiGauge software (Fujifilm), with arbitrary units reflecting the signal density from the blot.
Dual luciferase-activity assays
Assays were performed 48 hours after transfection using the Dual-Glo Luciferase Assay System (Promega), according to the manufacturer's protocols. Luminescence was measured for 1 second per well in a Varioskan Flash microplate reader. Relative luminescence units were firefly-luciferase (Fluc) normalized to that of renilla-luciferase (Rluc), or vice versa, before being compared with controls, which were arbitrarily set as 1.0.
Mass spectrometry and GSEA
Detailed information about mass spectrometry and gene set enrichment analysis (GSEA) is provided in supplemental Methods.
Statistical analysis
The multiple t test, one-way analysis of variance (ANOVA), and two-way ANOVA were performed using GraphPad Prism 7.0 software. Clinical analyses were performed using R (v3.2.4). More detailed information is included in supplemental Methods.
Results
Frequency and distribution of RPS15 mutations in CLL
We have recently identified RPS15 somatic mutations affecting 4 patients in a WES/WGS study of 452 CLL cases.7 All of these RPS15 mutations affected the C-terminal region of the protein and were associated with cases of poor clinical prognosis. This prompted us to extend the RPS15 mutational studies by targeted sequencing of exons 3 and 4 in a validation cohort of 216 patients. We identified 8 additional mutated cases (1.8% mutation frequency, with a variant allele frequency ranging from 1% to 50%) and confirmed mutational recurrence at positions 131 and 138. Moreover, we identified new recurrent mutations at residues Thr136 and Lys145, including 2 non-sense mutations (Table 1; supplemental Figure 1A; supplemental Table 3). All CLL patients harboring RPS15 mutations had unmutated IGHV genes (supplemental Table 4) and an aggressive disease characterized by a shorter median time to first treatment (RPS15WT, 4.2 years; RPS15MUT, 0.4 years) that was independent of the IGHV mutational status, recurrent genomic aberrations, and Binet stage (supplemental Figure 1B; supplemental Table 5).
Somatic RPS15 mutations found in CLL-WES and CLL-WGS studies
| Position | Mutation | Exon | Mutation frequency (%) | ||||
|---|---|---|---|---|---|---|---|
| Puente et al7 (n = 452) | This study (n= 216) | Landau et al8 (n = 537) | Ljungström et al15 (n = 1119) | Yu et al16 (n = 176) | |||
| 33 | p.L33P | 3 | 0.09 | ||||
| 115 | p.Y115H | 4 | 0.09 | ||||
| 129 | p.G129V | 4 | 0.22 | 0.18 | |||
| 131 | p.P131S | 4 | 0.44 | 0.56 | 0.8 | 1.14 | |
| p.P131R | 0.46 | 0.18 | |||||
| p.P131T | 0.27 | ||||||
| p.P131L | 0.09 | ||||||
| 132 | p.G132S | 4 | 0.18 | 0.66 | 0.57 | ||
| p.G132A | 0.18 | ||||||
| 134 | p.G134R | 4 | 0.37 | 0.27 | |||
| 135 | p.A135Y | 4 | 0.09 | ||||
| p.A135T | 0.46 | ||||||
| p.A135V | 0.18 | ||||||
| 136 | p.T136A | 4 | 0.93 | 0.18 | 0.45 | 0.57 | |
| p.T136N | 0.09 | ||||||
| 137 | p.H137Y | 4 | 0.46 | 0.74 | 0.8 | ||
| p.H137D | 0.18 | 0.57 | |||||
| 138 | p.S138F | 4 | 0.22 | 0.46 | 0.74 | 0.45 | |
| p.S138P | 0.09 | ||||||
| p.S138Y | 0.09 | ||||||
| 139 | p.S139F | 4 | 0.56 | 0.18 | 0.57 | ||
| p.S139C | 0.09 | ||||||
| p.S139A | 0.18 | 0.57 | |||||
| 140 | p.R140H | 4 | 0.09 | ||||
| 145 | p.K145N | 4 | 0.18 | 0.3 | 0.57 | ||
| p.K145M | 0.57 | ||||||
| p.K145E | 0.09 | ||||||
| p.K145* | 0.93 | 0.09 | |||||
| p.K145Q | 0.46 | ||||||
A comparative analysis of the RPS15 mutational landscape revealed that most mutations reported by Landau et al8 have been labeled as belonging to a short 118–amino acid isoform. After reassigning all of these mutations as belonging to the 145-residue RPS15 isoform, we found that the vast majority of mutations identified in the present and previous studies15,16 are located on a stretch comprising the last C-terminal residues of RPS15, with most of them (∼86%) clustering in a small segment of 10 amino acids (131-PGIGATHSSR-140) (Table 1; supplemental Figure 1A). Some specific residues, such as Pro131, His137, and Ser138, are subjected to very high mutational rates, with 21%, 16%, and 12% of the mutational burden, respectively.
A search in the COSMIC and cBioPortal databases showed that some RPS15 mutations have been detected at very low frequencies in different cancer types (supplemental Table 6). Interestingly, only 1 of the 24 mutations identified in non-CLL tumors affects the C-terminal portion of RPS15.
RPS15 recurrent mutations alter protein stability
To assess the functional role of RPS15 mutations in CLL, we stably expressed the top 8 recurrent mutant forms (RPS15P131S, RPS15G132S, RPS15G134R, RPS15T136A, RPS15H137Y, RPS15S138F, RPS15S139F, and RPS15K145N) (Table 1; supplemental Figure 1A) as GFP-tagged proteins in CLL (MEC-1) and nonhematological (HEK293T) cell lines. Reduced protein stability with respect to GFP-RPS15WT was found for all mutants in both cell lines, with the exception of the G132S and K145N variants (Figure 1A). We also assessed the P131S and S138F mutants to show that this behavior could not be explained by differences in infection efficiency (Figure 1B) or increased mRNA instability (Figure 1C). Then, we further evaluated the impact of these 2 mutations at the posttranslational level by comparing the half-life of wild-type and mutant RPS15 proteins by treating HEK293T cells, expressing the GFP-RPS15 forms, with cycloheximide and actinomycin D. As shown in Figure 1D, ∼80% of the initial GFP-RPS15WT protein levels remained detectable 4 hours after treatment in contrast with the levels in mutants, which dropped down to ∼50%, thus demonstrating a reduced protein half-life. Blockade of proteasome-dependent protein degradation with bortezomib resulted in partial stabilization of GFP-RPS15P131S and GFP-RPS15S138F proteins (Figure 1E), suggesting a proteasome-based mechanism of RPS15 protein quality control. This was further demonstrated by the accumulation of 4xHA-tagged ubiquitin–GFP–RPS15 mutant forms, but not ubiquitin-conjugated GFP-RPS15WT, in the presence of bortezomib, as shown by IP experiments (Figure 1F). Altogether, these results support the idea that specific C-terminal mutations in RPS15 induce their ubiquitin-dependent proteasomal degradation. Importantly, and in good agreement with our in vitro observations, we have found reduced protein levels in 3 of 4 available samples from CLL patients with mutated RPS15 compared with patients harboring wild-type RPS15 (Figure 1G).
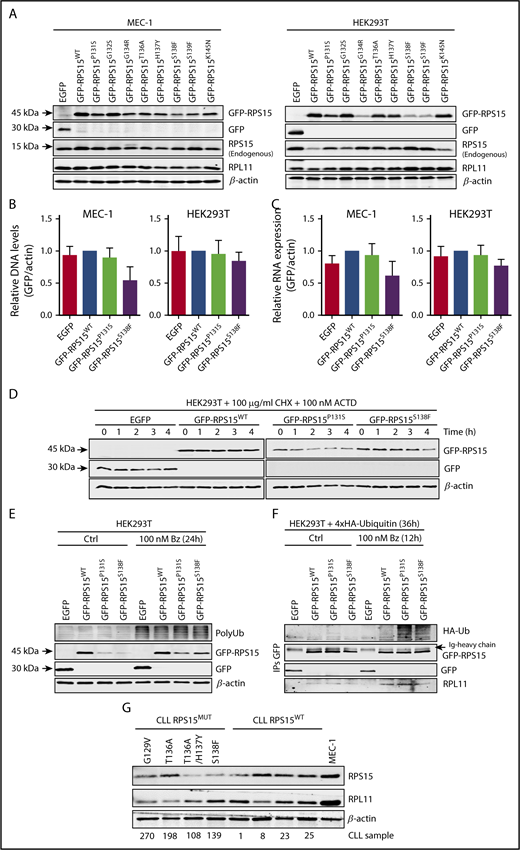
Recurrent RPS15 mutations alter protein stability. (A) MEC-1 and HEK293T cell lines stably expressing the indicated GFP-fusion constructs were subjected to western blot analysis with anti-GFP (for GFP and GFP-RPS15 detection), RPS15, RPL11, and β-actin. Note that RPL11 detection was carried out with the same samples run in parallel on an identical blot. (B) Relative DNA levels of transduced GFP-RPS15 (wild-type and mutants) lentiviral vectors in MEC-1 and HEK293T cells determined by qPCR analysis. ACTB was used as normalization control of endogenous genomic DNA. Data are shown as the mean of 3 independent experiments + standard error of the mean (SEM). (C) Real-time qPCR against GFP-fused RPS15 constructs in the same cell lines as in (B). β-Actin mRNA levels were used as normalization controls. Data are shown as the mean of ≥3 independent determinations + SEM. (D) HEK293T cells stably expressing the GFP-RPS15 forms were treated for the indicated times with 100 mg/mL cycloheximide (CHX) and 100 nM actinomycin D (ACTD). GFP, GFP-RPS15, and β-actin (as a loading control) were detected by immunoblotting. A representative western blot of 2 independent experiments is shown. (E) HEK293T cells stably expressing the GFP-RPS15 forms were treated or not with 100 nM bortezomib (Bz) for 24 hours and subjected to western blot analysis with antibodies against polyubiquitin (PolyUb), RPS15, GFP, and β-actin as a loading control. A representative western blot of 3 independent experiments is shown. (F) Wild-type and mutant GFP-RPS15 forms were transiently coexpressed with 4xHA-tagged ubiquitin in HEK293T cells for 24 hours and incubated in the absence or presence of 100 nM Bz for an additional 12 hours. GFP-tagged RPS15 forms were immunoprecipitated with anti-GFP antibody. Then, hemagglutinin (HA; to detect polyubiquitination), GFP, GFP-RPS15, and RPL11 (as positive control of coimmunoprecipitation) were detected by immunoblotting. (G) Western blot analysis with anti-RPS15, RPL11, and β-actin of a cohort of 4 CLL-RPS15WT and 4 CLL-RPS15MUT patient samples, using MEC-1 cells as control.
Recurrent RPS15 mutations alter protein stability. (A) MEC-1 and HEK293T cell lines stably expressing the indicated GFP-fusion constructs were subjected to western blot analysis with anti-GFP (for GFP and GFP-RPS15 detection), RPS15, RPL11, and β-actin. Note that RPL11 detection was carried out with the same samples run in parallel on an identical blot. (B) Relative DNA levels of transduced GFP-RPS15 (wild-type and mutants) lentiviral vectors in MEC-1 and HEK293T cells determined by qPCR analysis. ACTB was used as normalization control of endogenous genomic DNA. Data are shown as the mean of 3 independent experiments + standard error of the mean (SEM). (C) Real-time qPCR against GFP-fused RPS15 constructs in the same cell lines as in (B). β-Actin mRNA levels were used as normalization controls. Data are shown as the mean of ≥3 independent determinations + SEM. (D) HEK293T cells stably expressing the GFP-RPS15 forms were treated for the indicated times with 100 mg/mL cycloheximide (CHX) and 100 nM actinomycin D (ACTD). GFP, GFP-RPS15, and β-actin (as a loading control) were detected by immunoblotting. A representative western blot of 2 independent experiments is shown. (E) HEK293T cells stably expressing the GFP-RPS15 forms were treated or not with 100 nM bortezomib (Bz) for 24 hours and subjected to western blot analysis with antibodies against polyubiquitin (PolyUb), RPS15, GFP, and β-actin as a loading control. A representative western blot of 3 independent experiments is shown. (F) Wild-type and mutant GFP-RPS15 forms were transiently coexpressed with 4xHA-tagged ubiquitin in HEK293T cells for 24 hours and incubated in the absence or presence of 100 nM Bz for an additional 12 hours. GFP-tagged RPS15 forms were immunoprecipitated with anti-GFP antibody. Then, hemagglutinin (HA; to detect polyubiquitination), GFP, GFP-RPS15, and RPL11 (as positive control of coimmunoprecipitation) were detected by immunoblotting. (G) Western blot analysis with anti-RPS15, RPL11, and β-actin of a cohort of 4 CLL-RPS15WT and 4 CLL-RPS15MUT patient samples, using MEC-1 cells as control.
RPS15 mutants are incorporated into ribosomes
RPS15 can show cytoplasmic (when associated with ribosomes) or nucleolar distribution (during ribosomal subunit assembly).21 We explored whether RPS15 mutations affect the subcellular localization of the altered proteins. We observed that all GFP-RPS15 fusion forms showed the same localization in transduced HEK293T cells, mainly distributed in cytoplasm and nucleolus, with a very minor signal detected in the nucleoplasm (Figure 2A; supplemental Figure 2A). Because ∼90% of cellular RNA is ribosomal RNA (rRNA),22 we used the RNA-binding dye pyronin Y (PY) to determine the distribution of ribosome subunits or complete ribosomes inside the cells. As shown in Figure 2A and supplemental Figure 2A, all GFP-RPS15 forms displayed strong colocalization with PY in the cytoplasm and moderate colocalization in the nucleolus. The distribution of endogenous RPS15 in HEK293T cells (Figure 2B) or FLAG-tagged RPS15P131S and RPS15S138F mutants in HeLa cells (supplemental Figure 2B) confirmed that the GFP-RPS15 fusion proteins show the same cellular distribution as endogenous RPS15.

RPS15 mutant proteins are incorporated into ribosomes. (A) Distribution of RPS15 proteins (wild-type and P131S and S138F mutants) fused to GFP in HEK293T cells. rRNA was stained with the RNA-binding dye pyronin Y (PY). Colocalization is shown in merge panels. Scale bars, 20 µm. (B) Immunofluorescence analysis of endogenous RPS15 in GFP-expressing HEK293T cells. Scale bars, 20 µm. (C) Isolation of ribosomes from HEK293T cells stably expressing the GFP-RPS15 constructs and subsequent western blot analysis using antibodies against EF2, GFP, RPS15, RPS6, RPL11, and GAPDH. Note that RPL11, EF2, and GFP detection was carried out with the same samples run in parallel on an identical blot. A representative western blot of 2 independent experiments is shown. (D) Total protein lysates from HEK293T cells stably expressing GFP or the GFP-RPS15 constructs were immunoprecipitated with anti-GFP antibody, and GFP, RPS6 (as a representative ribosomal protein of the 40S subunit), and RPL11 (as a representative ribosomal protein of the 60S subunit) were detected by immunoblotting. Note that RPL11 and RPS6 detection was carried out with the same samples run in parallel on an identical blot. A representative western blot of 2 independent experiments is shown.
RPS15 mutant proteins are incorporated into ribosomes. (A) Distribution of RPS15 proteins (wild-type and P131S and S138F mutants) fused to GFP in HEK293T cells. rRNA was stained with the RNA-binding dye pyronin Y (PY). Colocalization is shown in merge panels. Scale bars, 20 µm. (B) Immunofluorescence analysis of endogenous RPS15 in GFP-expressing HEK293T cells. Scale bars, 20 µm. (C) Isolation of ribosomes from HEK293T cells stably expressing the GFP-RPS15 constructs and subsequent western blot analysis using antibodies against EF2, GFP, RPS15, RPS6, RPL11, and GAPDH. Note that RPL11, EF2, and GFP detection was carried out with the same samples run in parallel on an identical blot. A representative western blot of 2 independent experiments is shown. (D) Total protein lysates from HEK293T cells stably expressing GFP or the GFP-RPS15 constructs were immunoprecipitated with anti-GFP antibody, and GFP, RPS6 (as a representative ribosomal protein of the 40S subunit), and RPL11 (as a representative ribosomal protein of the 60S subunit) were detected by immunoblotting. Note that RPL11 and RPS6 detection was carried out with the same samples run in parallel on an identical blot. A representative western blot of 2 independent experiments is shown.
To evaluate whether GFP-RPS15 mutants are incorporated into ribosomes or remain free in the cytoplasm, we isolated ribosomes from HEK293T cells stably expressing GFP-RPS15P131S and GFP-RPS15S138F forms and performed immunoblotting experiments against GFP, RPL11 (60S subunit), and RPS6 (40S subunit). As shown in Figure 2C, GFP-RPS15WT, GFP-RPS15P131S, and GFP-RPS15S138F were detected in the ribosome fraction, together with RPL11 and RPS6. As a quality control for ribosome isolation, GAPDH and free GFP were undetectable in the ribosome fraction (Figure 2C). Additionally, we coimmunoprecipitated GFP-fused RPS15 proteins in HEK293T cells and detected RPL11 and RPS6 in the immunocomplexes (Figure 2D), confirming that at least GFP-RPS15P131S and GFP-RPS15S138F can be loaded into fully assembled ribosomes.
RPS15G134R, RPS15H137Y, and RPS15S138F mutants cannot replace endogenous RPS15 protein
RPS15 has been identified as an essential gene, and its complete ablation should be lethal in mammalian cells.23-28 We evaluated the ability of GFP-RPS15 mutants to replace the endogenous RPS15 protein in HEK293T cells. Using CRISPR/Cas9 technology (Figure 3A), we were able to establish several knockout clones for endogenous RPS15 in GFP-RPS15WT-, GFP-RPS15P131S-, GFP-RPS15G132S-, GFP-RPS15T136A-, GFP-RPS15S139F-, and GFP-RPS15K145N-expressing cells. We could not establish similar clones for cells expressing GFP-RPS15G134R, GFP-RPS15H137Y, GFP-RPS15S138F, or GFP alone (Figure 3B), despite the high number of clones analyzed (Figure 3C). These results confirm the lethality of RPS15 ablation in human cells and suggest that the G134R, H137Y, and S138F variants are lethal in a homozygous context. In addition, we observed that, although RPS15 mutations do not affect normal cell proliferation in the presence of wild-type protein (Figure 3D), likely due to the compensating activity of remaining endogenous RPS15, the expression of GFP-RPS15P131S, GFP-RPS15T136A, and GFP-RPS15S139F mutants in the absence of RPS15WT resulted in a significant reduction in cell growth (Figure 3E). Interestingly, slow-growing clones showed a moderately increased tolerance to well-known inhibitors of B-cell receptor signaling, such as ibrutinib (Figure 3F) and sorafenib (Figure 3G), and a significantly increased resistance to the purine analog fludarabine (Figure 3H), as it can be inferred from the 50% inhibitory concentration values (Figure 3I).
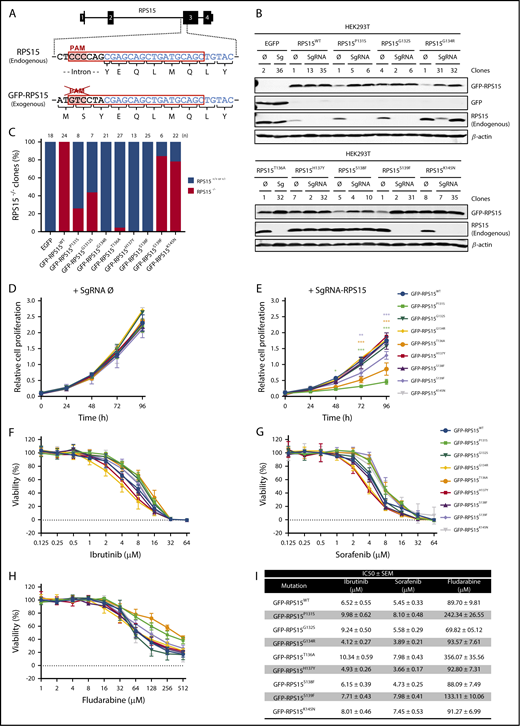
Some RPS15 mutants replace the endogenous protein and show altered proliferation and drug tolerance. (A) Schematic representation of RPS15 locus targeted by the designed single guide RNA (sgRNA), encompassing the second intron and the third exon of RPS15 gene and the corresponding locus in the pCDH-EGFP-RPS15 vector. The common sequence is highlighted in blue. (B) HEK293T cells stably expressing the different RPS15 constructs were infected with the lentiCRISPRv2 vector containing an sgRNA against endogenous RPS15 or no target (empty vector, Ø). Selected subclones were subjected to western blot analysis with antibodies against GFP (for GFP and GFP-RPS15 detection) and RPS15 and β-actin as a loading control. (C) Bar graph showing the percentage of clones with successful ablation of endogenous RPS15 in all of the different mutants, as well as in the wild-type and EGFP constructs. (D) Relative proliferation values of GFP-RPS15–expressing (wild-type and mutants) HEK293T cells transduced with the lentiCRISPRv2-empty (Ø) vector. (E) Relative proliferation values of GFP-RPS15–expressing (wild-type and mutants) HEK293T cells transduced with the lentiCRISPRv2-sgRNA against the endogenous RPS15 locus. Error bars indicate SEM. (F-H) Representative viability curves of selected clones of HEK293T cells transduced with the lentiCRISPRv2-sgRNA against endogenous RPS15 locus and treated with the indicated concentrations of ibrutinib (F), sorafenib (G), and fludarabine (H) for 72 h. (I) Summary table including the 50% inhibitory concentration (IC50 ± SEM) of the different RPS15 constructs using the aforementioned drugs. *P < .033, **P < .002, ***P < .001, two-way ANOVA.
Some RPS15 mutants replace the endogenous protein and show altered proliferation and drug tolerance. (A) Schematic representation of RPS15 locus targeted by the designed single guide RNA (sgRNA), encompassing the second intron and the third exon of RPS15 gene and the corresponding locus in the pCDH-EGFP-RPS15 vector. The common sequence is highlighted in blue. (B) HEK293T cells stably expressing the different RPS15 constructs were infected with the lentiCRISPRv2 vector containing an sgRNA against endogenous RPS15 or no target (empty vector, Ø). Selected subclones were subjected to western blot analysis with antibodies against GFP (for GFP and GFP-RPS15 detection) and RPS15 and β-actin as a loading control. (C) Bar graph showing the percentage of clones with successful ablation of endogenous RPS15 in all of the different mutants, as well as in the wild-type and EGFP constructs. (D) Relative proliferation values of GFP-RPS15–expressing (wild-type and mutants) HEK293T cells transduced with the lentiCRISPRv2-empty (Ø) vector. (E) Relative proliferation values of GFP-RPS15–expressing (wild-type and mutants) HEK293T cells transduced with the lentiCRISPRv2-sgRNA against the endogenous RPS15 locus. Error bars indicate SEM. (F-H) Representative viability curves of selected clones of HEK293T cells transduced with the lentiCRISPRv2-sgRNA against endogenous RPS15 locus and treated with the indicated concentrations of ibrutinib (F), sorafenib (G), and fludarabine (H) for 72 h. (I) Summary table including the 50% inhibitory concentration (IC50 ± SEM) of the different RPS15 constructs using the aforementioned drugs. *P < .033, **P < .002, ***P < .001, two-way ANOVA.
RPS15 mutant proteins alter ribosomal activity at different levels
RPS15 is located on the surface of the 40S ribosomal subunit, and its C-terminal region likely extends into the ribosomal decoding center (Figure 4A) that monitors the complementarity of transfer RNA (tRNA) and mRNA during protein translation.29-31 We evaluated whether RPS15 mutations can affect ribosomal functions by different approaches. First, we performed 35S-Met/Cys pulse labeling of HEK293T cell clones to assess their putative effects on global protein synthesis. After SDS-PAGE and autoradiography analysis, only GFP-RPS15P131S–, GFP-RPS15T136A–, and GFP-RPS15S139F–expressing cells with complete ablation of endogenous RPS15 showed a significantly reduced rate of 35S-Met/Cys incorporation compared with RPS15KO cells expressing GFP-RPS15WT (Figure 4B-C; supplemental Figure 3).

RPS15 mutant proteins alter ribosomal activity at different levels. (A) Global view of RPS15 structure in the context of the ribosome, showing the first amino acids of its C-terminal region extending into the ribosomal decoding center. The figure was generated with UCSF Chimera 1.11.2 (https://www.cgl.ucsf.edu/chimera) by using the structure of the human wild-type ribosome (PDB 5AJ0). The RPS15 protein is shown in a ribbon representation, whereas RNAs are shown as balls and sticks. The rRNAs of the large ribosomal subunit (28S, 5.8S, and 5S) are represented in gray, the rRNA of the small ribosomal subunit (18S) is in yellow, the tRNA is in blue, the mRNA is in cyan, and RPS15 protein (amino acids 12-131) is in red. (B) 35S-Met/Cys incorporation at the different times in protein precipitates from GFP-RPS15–expressing (wild-type or mutants) HEK293T cells. Signal intensities of autoradiography analyses were quantified, and mean values from ≥3 independent experiments are represented. Error bars indicate SEM. *P < .033, **P < .002, ***P < .001, two-way ANOVA. (C) Comparative 35S-Met/Cys incorporation between GFP-RPS15WT, GFP-RPS15P131S, and GFP-RPS15S138F cell lines. A representative autoradiography image and the associated RPS15 and β-actin immunoblots of 3 independent experiments are shown. (D-F) Dual-luciferase assays were performed to quantify cap-independent initiation (D), amino acid misincorporation (E), and stop codon read-through (F) during ribosomal translation in GFP-RPS15–expressing (wild-type or mutants) HEK293T cells. Firefly/renilla or renilla/firefly ratios were set to 1.0 in the case of GFP-RPS15WT–expressing cells (dark blue bars). Each bar represents the mean of 3 independent determinations + SEM. In (D-F), *P < .033, **P < .002, ***P < .001, one- or two-way ANOVA.
RPS15 mutant proteins alter ribosomal activity at different levels. (A) Global view of RPS15 structure in the context of the ribosome, showing the first amino acids of its C-terminal region extending into the ribosomal decoding center. The figure was generated with UCSF Chimera 1.11.2 (https://www.cgl.ucsf.edu/chimera) by using the structure of the human wild-type ribosome (PDB 5AJ0). The RPS15 protein is shown in a ribbon representation, whereas RNAs are shown as balls and sticks. The rRNAs of the large ribosomal subunit (28S, 5.8S, and 5S) are represented in gray, the rRNA of the small ribosomal subunit (18S) is in yellow, the tRNA is in blue, the mRNA is in cyan, and RPS15 protein (amino acids 12-131) is in red. (B) 35S-Met/Cys incorporation at the different times in protein precipitates from GFP-RPS15–expressing (wild-type or mutants) HEK293T cells. Signal intensities of autoradiography analyses were quantified, and mean values from ≥3 independent experiments are represented. Error bars indicate SEM. *P < .033, **P < .002, ***P < .001, two-way ANOVA. (C) Comparative 35S-Met/Cys incorporation between GFP-RPS15WT, GFP-RPS15P131S, and GFP-RPS15S138F cell lines. A representative autoradiography image and the associated RPS15 and β-actin immunoblots of 3 independent experiments are shown. (D-F) Dual-luciferase assays were performed to quantify cap-independent initiation (D), amino acid misincorporation (E), and stop codon read-through (F) during ribosomal translation in GFP-RPS15–expressing (wild-type or mutants) HEK293T cells. Firefly/renilla or renilla/firefly ratios were set to 1.0 in the case of GFP-RPS15WT–expressing cells (dark blue bars). Each bar represents the mean of 3 independent determinations + SEM. In (D-F), *P < .033, **P < .002, ***P < .001, one- or two-way ANOVA.
Then, we assessed different steps of mRNA translation using dual-luciferase reporter assay systems in HEK293T cells.32-35 To evaluate the initiation of mRNA translation, which can occur by cap-dependent and cap-independent mechanisms,36 we used the bicistronic reporter pCDNA3-RLuc-POLIRES-FLuc vector35 (Figure 4D, inset). As shown in Figure 4D, mutants GFP-RPS15G134R, GFP-RPS15T136A, GFP-RPS15H137Y, GFP-RPS15S138F, and GFP-RPS15K145N promoted a significant increase in cap-independent translation compared with GFP-RPS15WT–expressing cells.
Next, we assessed the rate of amino acid misincorporation during the elongation step. For this, we used pCI-6.2037 and pCI.6.20-FLuc-K529N-A>C/T reporter vectors (Figure 4E, upper panels). pCI.6.20-FLuc-K529N-A>C/T plasmids carried the variant K529N, which renders the firefly enzyme catalytically inactive.32 Thus, ribosomes with a reduced ability to discriminate between cognate and near-cognate aminoacyl-tRNAs yield higher levels of firefly luminescence. As shown in Figure 4E, GFP-RPS15H137Y and GFP-RPS15S138F mutants showed increased levels of amino acid misincorporation with both vectors relative to wild-type, indicating a slight loss of translational fidelity.
Finally, we evaluated stop codon read-through caused by defects in translation termination. We generated reporter plasmids containing the UAA or UAG stop codons between the FLuc and RLuc genes (Figure 4F, upper panels). All mutants, with the exception of GFP-RPS15P131S–, GFP-RPS15S139F–, and GFP-RPS15K145N–expressing cells, exhibited a significant increase in read-through for both stop codons tested (Figure 4F).
Altogether, these results clearly indicated that, although alterations in residues Pro131, Thr136, and, to a lesser degree, Ser139 hinder global protein synthesis, mutations in the residues encompassing 134-GATHS-138 seem to interfere with the fidelity of translation.
RPS15 mutations induce proteome-wide changes
The results mentioned above suggest a possible alteration of global proteomes in cells carrying RPS15 mutations. To explore this possibility, we performed multiplexed quantitative proteome analysis combining the tandem mass tag workflow and high-resolution mass spectrometry. We first compared the proteomes of different clones of GFP-RPS15WT, GFP-RPS15P131S, and GFP-RPS15S138F in HEK293T cells with partially or totally ablated endogenous RPS15 (Figure 3B). In total, 6737 proteins were quantified across all samples (supplemental Excel file 1). Unsupervised hierarchical clustering (Figure 5A) and principal component analysis (Figure 5B) demonstrated strong clustering between biological replicates for each RPS15 variant and revealed 2 strikingly different phenotypes. Multiple t test analysis identified a total of 79 and 86 significantly altered proteins in GFP-RPS15P131S– and GFP-RPS15S138F–expressing cells, respectively, compared with GFP-RPS15WT–expressing cells (supplemental Excel file 1).
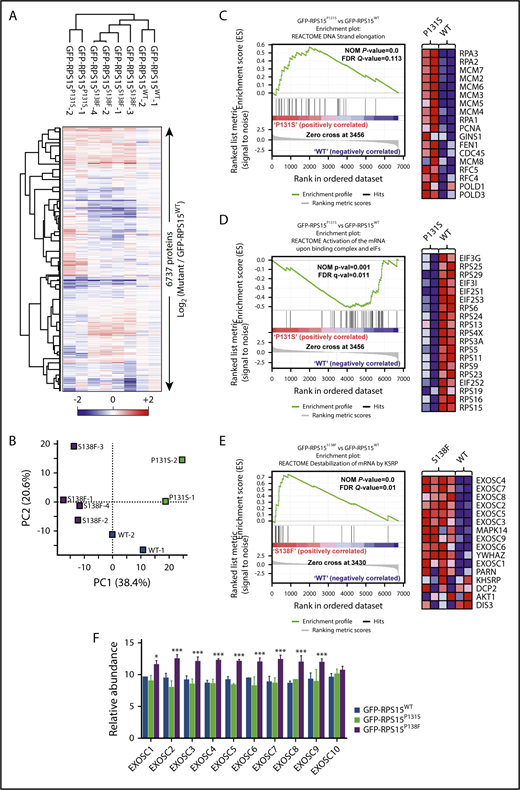
RPS15 mutant proteins alter global cell proteome in HEK293T cells. (A) Heat map depicting unsupervised hierarchical clustering of the 8 proteomes analyzed using the total set of proteins identified. Protein abundance is shown as the log2 ratio between each sample with respect to the average of reference samples (GFP-RPS15WT–expressing HEK293T cells). (B) Principal component analysis of the relative protein abundances of all 8 proteomes analyzed. Principal component analyses show a similar clustering between biological replicates. (C-D) Comparison of proteomic profiles from GFP-RPS15P131S–expressing vs GFP-RPS15WT–expressing HEK293T cells performed using GSEA. (C) Enrichment score plot corresponding to DNA strand elongation in the Reactome database (left panel). Heat map showing the top 18 genes of the positively correlated enriched gene set (right panel). (D) Enrichment plot corresponding to activation of the mRNA upon binding of the CAP-binding complex and eukaryotic initiation factors (eIFs) in the Reactome database (left panel). Heat map showing the 19 top genes of the negatively correlated enriched gene set (right panel). (E) Comparison of proteomic profiles from GFP-RPS15S138F–expressing vs GFP-RPS15WT–expressing HEK293T cells performed using GSEA. The enrichment plot shown corresponds to destabilization of mRNA by KSRP in the Reactome database (left panel). Heat map showing the top 16 genes of the positively correlated enriched gene set (right panel). (F) Relative abundance of different components of the exosome complex. Each bar represents the mean of 2 (GFP-RPS15WT and GFP-RPS15P131S) or 4 (GFP-RPS15S138F) independent relative proteomic determinations + SEM. *P < .033, ***P < .001, multiple t test.
RPS15 mutant proteins alter global cell proteome in HEK293T cells. (A) Heat map depicting unsupervised hierarchical clustering of the 8 proteomes analyzed using the total set of proteins identified. Protein abundance is shown as the log2 ratio between each sample with respect to the average of reference samples (GFP-RPS15WT–expressing HEK293T cells). (B) Principal component analysis of the relative protein abundances of all 8 proteomes analyzed. Principal component analyses show a similar clustering between biological replicates. (C-D) Comparison of proteomic profiles from GFP-RPS15P131S–expressing vs GFP-RPS15WT–expressing HEK293T cells performed using GSEA. (C) Enrichment score plot corresponding to DNA strand elongation in the Reactome database (left panel). Heat map showing the top 18 genes of the positively correlated enriched gene set (right panel). (D) Enrichment plot corresponding to activation of the mRNA upon binding of the CAP-binding complex and eukaryotic initiation factors (eIFs) in the Reactome database (left panel). Heat map showing the 19 top genes of the negatively correlated enriched gene set (right panel). (E) Comparison of proteomic profiles from GFP-RPS15S138F–expressing vs GFP-RPS15WT–expressing HEK293T cells performed using GSEA. The enrichment plot shown corresponds to destabilization of mRNA by KSRP in the Reactome database (left panel). Heat map showing the top 16 genes of the positively correlated enriched gene set (right panel). (F) Relative abundance of different components of the exosome complex. Each bar represents the mean of 2 (GFP-RPS15WT and GFP-RPS15P131S) or 4 (GFP-RPS15S138F) independent relative proteomic determinations + SEM. *P < .033, ***P < .001, multiple t test.
Standard GSEA analysis yielded 40 significantly enriched gene sets when the proteomes of GFP-RPS15P131S– and GFP-RPS15WT–expressing cells were compared (supplemental Table 7). Leading edge analysis of positively correlated enriched gene sets (16) (supplemental Figure 4) identified replication and DNA elongation (Figure 5C) as the main biological signatures upregulated in GFP-RPS15P131S–expressing cells. In addition, the analysis of negatively correlated enriched gene sets (24) (supplemental Figure 5) identified the respiratory electron transport chain and the tricarboxylic acid (TCA) cycle, as well as the translation process, represented by depletion of several components of the 40S subunit and some eukaryotic initiation factors (eIFs) (Figure 5D), as the main downmodulated signatures.
GSEA analysis of GFP-RPS15S138F–expressing cells compared with GFP-RPS15WT–expressing cells yielded 26 significantly enriched gene sets (supplemental Table 8). Leading edge analysis of positively correlated enriched gene sets (14) highlighted 3 main signatures: destabilization of mRNA, peptide chain elongation, and transport of mRNA and ribonucleoproteins through the nuclear membrane (supplemental Figure 6). Remarkably, “destabilization of mRNA” signature was defined by the increased abundance of practically all components of the exosome complex (Figure 5E-F). Finally, negatively correlated enriched gene sets (12) in the GFP-RPS15S138F phenotype again highlighted the respiratory electron transport chain and the TCA cycle as the main downmodulated pathways (supplemental Figure 7).
We then set out to extend our proteomic analyses to a CLL-specific cell line (MEC-1), expanding the studies to 5 mutations: GFP-RPS15P131S, GFP-RPS15G132S, GFP-RPS15T136A, GFP-RPS15H137Y, and GFP-RPS15S138F. Importantly, the elimination of endogenous RPS15 could never be accomplished in these cells. Moreover, the expression levels achieved for the recombinant RPS15 forms in the lymphoid cell line were much lower than those obtained in HEK293T cells. Thus, we performed the analysis in triplicate, aiming to enhance the robustness of the analysis (supplemental Figure 8A).
In total, 6640 proteins were quantified across all samples (supplemental Excel file 2). Unsupervised hierarchical clustering (supplemental Figure 8B) and principal component analysis (supplemental Figure 8C) indicated a strong clustering of all variants, with the exception of P131S, in spite of the modest clustering between biological replicates. A total of 47 (P131S), 114 (G132S), 68 (T136A), 45 (H137Y), and 62 (S138F) significantly altered proteins were identified by multiple t test analysis, but no clear individual hits could be pinpointed as shared among mutants (supplemental Excel file 2). To improve performance, we carried out GSEA by grouping the proteomes of all clones expressing mutated RPS15 (GFP-RPS15MUT), instead of individually, as previously done in HEK293T cells. In this setting, standard GSEA analysis yielded 41 significantly enriched gene sets (supplemental Table 9). Results obtained by leading edge analysis of the GFP-RPS15MUT positively correlated enriched gene sets (27) were in line with those previously found in GFP-RPS15S138F–expressing HEK293T cells. Hence, RNA translation, including peptide chain elongation (supplemental Figure 8D) or activation of the mRNA upon binding of the cap binding complex and eIFs, were identified as the main upregulated biological signatures (supplemental Figure 9). Furthermore, in agreement with changes observed in HEK293T, the analysis of negatively correlated enriched gene sets (14) again identified the respiratory electron transport chain and the TCA cycle (supplemental Figure 8E), as well as the metabolism of lipids and lipoproteins, as the primary downmodulated signatures (supplemental Figure 10).
Discussion
RPS15 has been recently identified as a CLL driver associated with aggressive disease and chemorefractoriness.7,8,15,16 Here, we present an additional targeted study in a 216-patient cohort that confirms the recurrence of RPS15 mutations in CLL. A meta-analysis based on the current and previously described research depicts an outstanding mutational clustering in a short C-terminal stretch of the RPS15 protein, indicating a remarkable targeting of this segment in CLL pathogenesis.
Despite the growing evidence of RPS15 as a CLL driver, the molecular mechanisms that link RPS15 mutations with this neoplasia remain unclear. First, we demonstrate that certain RPS15 mutations reduce this protein’s half-life by an ubiquitin-mediated mechanism. A similar effect on protein stability caused by missense mutations has been observed in the ribosomal protein RPS19.38 RPS15 instability could lead to ribosome biogenesis defects, as previously described for RPS19 mutations,38-40 or to alterations in the export of 40S subunit precursors to the cytoplasm.17 However, the fact that the RPS15 mutants were efficiently loaded into fully assembled ribosomes, and that even some homozygous mutants were viable, led us to consider that they could be directly affecting ribosomal functions. Accordingly, protein synthesis and mRNA translation assays in RPS15 mutants revealed mutation-specific effects on ribosomal function. Although P131S, T136A, and S139F variants appear to affect global protein synthesis (probably enhanced by complete ablation of the wild-type form), alteration of translational initiation and fidelity were primarily induced by the variants included in the heptapeptide 132-GIGATHS-138. In good agreement with our functional data, it has been described that the tetrapeptide 137-HSSR-140 participates directly in the decoding process.29,41 To our knowledge, RPS15 mutations would be the first pathological alterations to be identified in a component of the ribosome decoding site.42 Moreover, it is known that the increased cap-independent translation observed for some variants can participate in the translation of certain oncogenes, growth factors, and apoptotic proteins.43 Therefore, our findings are supported by experimental evidence suggesting that mutations in certain ribosomal proteins might promote cancer through modifications in mRNA translation patterns.44-47
Moreover, we have observed that RPS15 mutations impact on cellular proteomes and that several biological pathways are perturbed independently of the cell model used. This is the case for the downmodulation of pyruvate metabolism, TCA cycle, and respiratory electron transport chain. Metabolic changes have been previously described in 2 animal models of ribosomal mutations causing Diamond-Blackfan anemia48,49 and in cells expressing RPL10R98S, a recurrent ribosomal mutation causing acute lymphoblastic T-cell leukemia (T-ALL).50 The changes observed in our CLL models are compatible with a metabolic reprogramming toward aerobic glycolysis, or Warburg effect, defined as an emerging hallmark of cancer.51
A remarkable finding of our proteomic studies is that the effects on translation fidelity observed for RPS15 mutations in vitro can be bolstered by proteome-wide alterations that impinge on RNA translation, ribosome composition, and mRNA biology and transport pathways. On the other hand, all homozygous S138F-expressing HEK293T mutant clones display increased levels of most components of the exosome, a macromolecular complex involved in RNA surveillance.52 Notably, processing, metabolism, and export of RNAs are among the most frequently altered pathways in CLL.7,8
The accumulation of components of the replisome in homozygous HEK293T GFP-RPS15P131S cells might explain its reduced proliferation rates by causing a bottleneck for essential elements involved in DNA replication. Similar changes might additionally appear in homozygous GFP-RPS15T136A and GFP-RPS15S139F cells, which are also characterized by decreased proliferation. Interestingly, these homozygous cells, which also showed a reduced global protein synthesis, displayed a modest increase in the resistance to drugs used in CLL treatment, supporting the role of RPS15 mutations in relapse/refractoriness and resistance to ibrutinib.15,53 In this sense, it has been suggested that certain cancer cells could evade strong selective drug pressure by entering a “persister” state of negligible growth.54,55
We have shown that RPS15 mutations can induce RNA translation defects independently of their zygosity and cell-proliferation rates, but it is not known whether they also affect cell proliferation in vivo, because they usually occur in heterozygosis. It is difficult to reconcile how loss-of-function mutations that impair cell growth become cancer drivers. In this scenario, our results demonstrate that RSP15 mutations show remarkable similarities with diseases caused by ribosomal mutations. These diseases include ribosomopathies, hypoproliferative disorders that, intriguingly, can turn into hyperproliferative diseases, thus increasing the risk for cancer development.42 Moreover, a yeast model of RPL10R98S, which drives T-ALL, also develops a hypoproliferative phenotype due to targeted degradation of defective ribosomes. It has been shown that ribosomal stress in this model selects bypassing mutations for the ribosome quality-control mechanism, thus increasing the amount of defective ribosomes in the translational pool and recovering normal proliferation rates.46,56 On the downside, mutant ribosomes cause altered expression patterns, eventually driving to pathological loss of cellular homeostasis.57
As previously proposed for T-ALL and several ribosomopathies,57-59 all of these findings support defective mRNA translation as a path to oncogenesis in RPS15-mutated CLL, likely through loss of proteostasis, an emerging feature of cancer.60,61 Wide proteome alterations induced by mutant RPS15 might have pleiotropic effects that can target different processes eventually related to leukemia development. This mechanism has been previously proposed for mutations in the splicing factor SF3B1, a well-known driver gene that can induce multiple alterations in gene expression in CLL.9,62 Considering that mRNA translation can be pharmacologically targeted,63,64 our findings might open new venues for therapeutic interventions in aggressive and chemorefractory CLL.
The online version of this article contains a data supplement.
The publication costs of this article were defrayed in part by page charge payment. Therefore, and solely to indicate this fact, this article is hereby marked “advertisement” in accordance with 18 USC section 1734.
Acknowledgments
The authors thank J. P. Freije, X. S. Puente, and I. Martín-Subero for helpful comments.
This work was supported by grants from Ministerio de Economía y Competitividad, Instituto de Salud Carlos III, Centro de Investigación Biomédica en Red de Cáncer (CIBERONC), Plan Feder, and the EDP Foundation. The authors also thank the generous support of J. I. Cabrera. The Instituo Universitario de Oncología is supported by Fundación Bancaria Caja de Ahorros de Asturias.
Authorship
Contribution: G.B., D.R., and C.L.-O. conceived the idea and designed the study; G.B. and D.R. designed all functional experiments and, together with M.G.Á., J.R.A., R.V.-M., and D.A.P., performed them; J.D., N.V., A.L.-G., and E.C. provided samples and patients of extended cohort and performed clinical studies; F.N. performed the deep-sequencing study; M.A.P., J.A.P., D.J.F., and S.P.G. performed the mass spectrometry study; G.B. and D.R. analyzed and interpreted global data; V.Q. and C.L.-O. supervised the study; and G.B., D.R., and C.L.-O. wrote the manuscript. All authors reviewed the manuscript and approved the submission in its current form.
Conflict-of-interest disclosure: The authors declare no competing financial interests.
Correspondence: Carlos López-Otín, Departamento de Bioquímica y Biología Molecular, Universidad de Oviedo, 33006 Oviedo, Spain; e-mail: clo@uniovi.es; and Víctor Quesada, Departamento de Bioquímica y Biología Molecular, Universidad de Oviedo, 33006 Oviedo, Spain; e-mail: quesadavictor@uniovi.es.

This feature is available to Subscribers Only
Sign In or Create an Account Close Modal