

Key Points
BCR-mediated NFATc1 activation stimulates the immunosuppressive IL-10/STAT3/PD-L1 signaling pathway in DLBCL cells.
Small molecule inhibitors of BTK block BCR-mediated NFATc1 activation and, thereby, downregulate IL-10/STAT3/PD-L1 signaling in DLBCL cells.

Abstract
Knowledge of programmed death ligand 1 (PD-L1) expression and its regulation in B-cell lymphoma cells is limited. Investigating mechanisms that control PD-L1 expression in B-cell lymphoma cells might identify biomarkers that predict the efficacy of immunotherapy with anti–programmed death-1/PD-L1 antibodies. In addition, identification of mechanisms that regulate PD-L1 may identify molecules that can be targeted to improve the clinical efficacy of immune checkpoint inhibitors. In this study, we used proteomic approaches and patient-derived B-cell lymphoma cell lines to investigate mechanisms that regulate PD-L1 expression. We found that PD-L1 expression, particularly in nongerminal center B cell–derived diffuse large B-cell lymphoma (DLBCL), is controlled and regulated by several interactive signaling pathways, including the B-cell receptor (BCR) and JAK2/STAT3 signaling pathways. We found that that BCR-mediated NFATc1 activation upregulates IL-10 chemokine expression in PD-L1+ B-cell lymphoma cells. Released IL-10 activates the JAK2/STAT3 pathway, leading to STAT3-induced PD-L1 expression. IL-10 antagonist antibody abrogates IL-10/STAT3 signaling and PD-L1 protein expression. We also found that BCR pathway inhibition by BTK inhibitors (ibrutinib, acalabrutinib, and BGB-3111) blocks NFATc1 and STAT3 activation, thereby inhibiting IL-10 and PD-L1 expression. Finally, we validated the PD-L1 signaling network in 2 primary DLBCL cohorts consisting of 428 and 350 cases and showed significant correlations among IL-10, STAT3, and PD-L1. Thus, our findings reveal a complex signaling network regulating PD-L1 expression in B-cell lymphoma cells and suggest that PD-L1 expression can be modulated by small molecule inhibitors to potentiate immunotherapies.
Introduction
Diffuse large B-cell lymphoma (DLBCL) is the most common non-Hodgkin lymphoma worldwide and the fifth most common type of cancer in the United States.1 Standard frontline treatment of DLBCL is chemotherapy with R-CHOP (rituximab, cyclophosphamide, doxorubicin, vincristine, and prednisone). R-CHOP produces remission in ∼60% to 70% of patients; however, ∼30% to 40% of patients have disease that is refractory to R-CHOP or recurs within 2 or 3 years after treatment, and salvage therapy options are very poor, producing poor response rates ∼ 20%.1-4
DLBCLs can be divided into 2 major subtypes based on gene-expression profiling.5,6 One subtype of DLBCL, activated B-cell type (ABC) or nongerminal center B cell–like (non-GCB) DLBCL, is characterized by expression of MUM1/IRF4 and CD138, postgerminal center–associated antigens, and constitutive activation of the NF-κB1 pathway. Another subtype of DLBCL is germinal center B cell–derived (GCB) DLBCL, which is characterized by expression of CD10 and BCL-6, a large subset of which carry the t(14;18)(q32;q21)/IGH-BCL2. These subtypes are reported to have disparate clinical outcomes; patients with ABC/non-GCB subtype have significantly poorer 5-year survival rates compared with patients with the GCB subtype. In addition to NF-κB, several transcription factors are presumably constitutively activated through chronic B-cell receptor (BCR) signaling pathway in non-GCB DLBCL, including STAT3 and NFATc1, but unlike NF-κB and STAT3, the role of NFATc1 in DLBCL is less well understood.
Some malignant B cells have acquired the ability to escape the immune surveillance of tumor-specific cytotoxic T cells by overexpressing immune checkpoint molecules, such as programmed death ligand 1 (PD-L1) or PD-L2 on their cell surface. These ligands interact with the programmed death-1 (PD-1) receptor expressed on intratumoral T cells and provide an inhibitory signal, thereby suppressing the antitumor immune response. Immune checkpoint inhibitors, such as anti–PD-1 antibody, bind to the PD-1 expressed on T cells, and thereby stimulate their proliferative capacity, enabling the immune system to resume its ability to recognize, attack, and destroy cancer cells. The US Food and Drug Administration has approved several immune checkpoint inhibitor antibodies (eg, ipilimumab, nivolumab, pidilizumab, and pembrolizumab) for treatment of several types of metastatic solid tumors.7 These checkpoint inhibitors are also being studied in clinical trials, which have shown robust responses of various hematologic malignancies, including relapsed/refractory DLBCL, particularly the non-GCB subtype.8 The basis for the success of anti–PD-1 immunotherapy appears to be expression of PD-L1 on tumor cells and cells of the tumor microenvironment, because not all patients responded to anti–PD-1 therapy.9,10 PD-L1 expression is detected in ∼25% of cases of DLBCL (primarily cases of non-GCB and Epstein-Barr virus [EBV]+ B-cell lymphoma; expression is rare in GCB DLBCL), and PD-L1 expression on tumor cells is associated with poorer overall survival.11-14 Genetic alterations leading to PD-L1 expression were reported at a low frequency in DLBCL,15 suggesting that other mechanisms underlying PD-L1 expression likely exist.
In this study, we used proteomic approaches and patient-derived B-cell lymphoma cell lines to identify additional mechanisms underlying PD-L1 expression in DLBCL. We found that a subset of B-cell lymphoma cell lines highly express PD-L1 protein and that PD-L1 expression is driven by the BCR-mediated NFATc1 signaling pathway and the IL-10–mediated STAT3 signaling pathway. Our discoveries suggest that this signaling network can drive tumor PD-L1 expression and that targeting this network may have therapeutic potential.
Material and methods
Cells and reagents
The DLBCL cell lines (MS, DS, DBr, McA, FN, HF, HB, MZ, LR, CJ, LP, LVP-03, WP, TJ, EJ, and RC) and the mantle cell lymphoma (MCL) cell lines (Mino, JMP-1, and PF-1) were established at MD Anderson Cancer Center and have been characterized and described previously.16-19 The DLBCL cell lines U-2932, Pfeiffer, OCI-LY19, BJAB, DOHH2, Toledo, SUDHL-4, SUDHL-10, HBL-1, TMD-8, DB, HT, OCI-LY10, and OCI-LY3 were obtained from Michael Rosenblum and R. Eric Davis (The University of Texas MD Anderson Cancer Center).20,21 The Maver-1, Jeko-1, DB-sp53, JVM-13, Z-138, REC-1, and Granta MCL cell lines were purchased from American Type Culture Collection (Manassas, VA). The PF-2, PF-3, PF-4, PF-5, and PF-6 EBV+ lymphoma cell lines were established at MD Anderson Cancer Center and phenotypically characterized (supplemental Figure 2, available on the Blood Web site). All cell lines were routinely tested for Mycoplasma spp. using a MycoSEQ Mycoplasma Detection Kit (Invitrogen, Carlsbad, CA) and were validated by short tandem repeat DNA fingerprinting at the Characterized Cell Line Core Facility at The University of Texas MD Anderson Cancer Center. Stocks of authenticated cell lines were stored in liquid nitrogen for future use, and all cell lines used in the studies described here were obtained from these authenticated cell line stocks. Enzastaurin, ibrutinib, and acalabrutinib were purchased from Selleckchem (Houston, TX). BeiGene provided BGB-3111.
Patient cohorts
The first study cohort included 428 patients with de novo DLBCL treated with R-CHOP derived from the International DLBCL R-CHOP Consortium Program.22,23 Cell-of-origin classification was determined by gene-expression profiling,22 and phosphorylated STAT3 (pSTAT3) protein expression was determined by immunohistochemistry, as described previously.24 PD-L1 expression was assessed by immunohistochemistry using a DAKO PD-L1 antibody. This study was conducted in accordance with the Helsinki Declaration and was approved as being of minimal to no risk or as exempt by the Institutional Review Boards of all participating centers. We also confirmed findings in another cohort containing 350 primary DLBCL samples (Oncomine data set).25
Viability assays
Cells from representative DLBCL cell lines were plated at 5000 cells per well in 384-well plates. The assays were performed using a CellTiter-Glo Luminescent Cell Viability Assay, according to the manufacturer’s instructions (Promega, Madison, WI).
Western blot analysis
Whole-cell or nuclear extracts were solubilized with 1% sodium dodecyl sulfate buffer and subjected to sodium dodecyl sulfate–polyacrylamide gel electrophoresis on a 4% to 15% gel (Bio-Rad, Hercules, CA). We transferred proteins onto polyvinylidene difluoride membranes and probed them with specific primary antibodies and horseradish peroxidase–conjugated secondary antibodies. Proteins were visualized using an ECL system (Amersham, Little Chalfont, UK). Antibodies against PD-L1, phosphorylated GSK3β (pGSK3β), GSK3β, pSTAT3, and STAT3 were purchased from Cell Signaling Technology (Danvers, MA); NFATc1 antibodies were purchased from Santa Cruz Biotechnology (Santa Cruz, CA).
Transient transfection and DNA plasmids
Transient transfections in cultured lymphoma cells were conducted using a Neon transfection system (Thermo Fisher Scientific, Waltham, MA) in representative DLBCL cells, as previously described.26 Predesigned and validated STAT3 small interfering RNA (siRNA; S743, S744, S745) and control siRNA were purchased from Thermo Fisher Scientific. The NFATc1 short hairpin RNA (shRNA) plasmid was validated previously.26 The wild-type and mutant GSK3β plasmids were purchased from Addgene (Cambridge, MA).27
Chromatin immunoprecipitation assays
Chromatin immunoprecipitation (ChIP) assays were performed using a ChIP Assay Kit (Millipore), according to the manufacturer’s protocol. Specific details of the methods have been described.26 Purified DNA from immunoprecipitation studies and DNA inputs were used for quantitative real-time PCR (qPCR). EpiTect ChIP qPCR primers GPH1015315(+)03A corresponding to the NFAT2 binding site in the IL-10 gene promoter and GPH1012902(−) corresponding to the STAT binding site in the CD274 gene promoter were purchased from Thermo Fisher Scientific.
Reverse phase protein array analysis
Statistical analysis
The Spearman rank correlation coefficient with the t test was used to evaluate correlative studies. Relative protein levels for each sample in the RPPA analysis were determined by interpolation of each dilution curve from the “standard curve” using the R package SuperCurve. All data points were normalized for protein loading and transformed to linear values. Normalized linear values were transformed to log2 values and then median centered for hierarchical cluster analysis and heat map generation. The heat map was generated in Cluster 3.0 (http://cluster2.software.informer.com/3.0/) as a hierarchical cluster using Pearson correlation and a center metric. The resulting heat map was visualized in TreeView (https://sourceforge.net/projects/jtreeview/files/) and presented in high-resolution bmp format.
GraphPad Prism 5.04 (GraphPad Software, La Jolla, CA) and R 3.1.2 with packages SuperCurve v1.4.4, BioNet v1.26.0, and nlme v3.1-120 were used for statistical analyses. P < .05 was considered significant.
Results
PD-L1 protein signature in B-cell lymphoma cell lines
To profile the expression of PD-L1 and proteins associated with PD-L1, we examined protein expression in 30 representative DLBCL cell lines (10 non-GCB and 20 GCB), 10 MCL cell lines, and 5 EBV+ B-cell lymphoma cell lines using RPPA. Consistent with earlier studies, we showed that PD-L1 protein was expressed mostly in non-GCB DLBCL (8/10) and EBV+ B-cell lymphoma (5/5) cell lines (Figure 1A). Five of 10 MCL cell lines also expressed PD-L1, albeit at low levels in most (Figure 1A). PD-L1 expression was significantly higher in non-GCB DLBCL cell lines than in GCB DLBCL cell lines (supplemental Figure 4A; P < .0001). PD-L1 cell surface expression status was confirmed in 3 representative non-GCB DLBCL cell lines (HBL-1, LP, and WP) and GCB cell line RC by flow cytometry analysis (Figure 1A). To identify PD-L1–associated proteins, we performed protein cluster analysis based on the protein expression intensity of PD-L1 in all cell lines analyzed (supplemental Figure 1). We identified a PD-L1 protein signature (Figure 1B) consisting of proteins associated with cellular movement, cancer development, connective tissue development, cell death and survival, immune response, cell-to-cell signaling and interaction, and cell cycle (Figure 1C); it was capable of classifying non-GCB and GCB DLBCL cell lines according to the protein level of PD-L1.
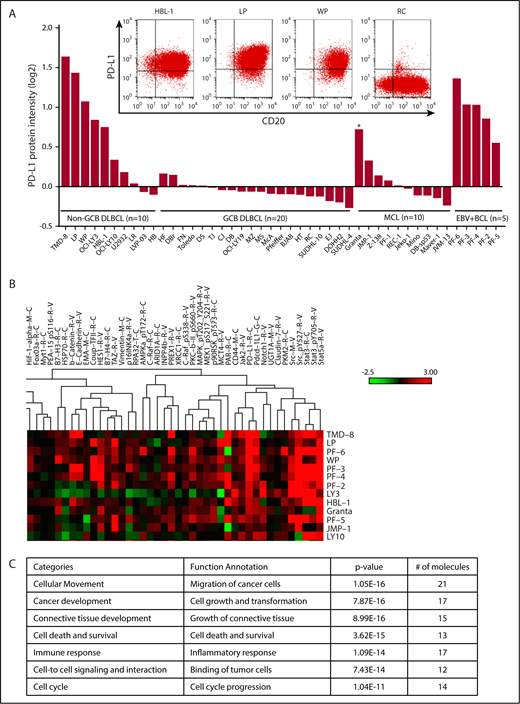
PD-L1 protein signature in B-cell lymphomas. (A) PD-L1 expression analyzed by RPPA analysis in 10 representative non-GCB DLBCL, 20 representative GCB DLBCL, 10 representative MCL, and 5 representative EBV+ B cell lymphoma (BCL) cell lines. Flow cytometry plots show coexpression of PD-L1 and CD20 in 3 representative non-GCB DLBCL cell lines (HBL-1, LP, and WP) and the RC GCB DLBCL cell line, which was used as a negative control for PD-L1 and positive control for CD20 (inset). *EBV+ MCL cell line. (B) RPPA heat map showing a cluster based on high PD-L1 expression level on all cell lines analyzed. (C) Proteins within the cluster and their known cellular functions, analyzed by ingenuity pathway analysis.
PD-L1 protein signature in B-cell lymphomas. (A) PD-L1 expression analyzed by RPPA analysis in 10 representative non-GCB DLBCL, 20 representative GCB DLBCL, 10 representative MCL, and 5 representative EBV+ B cell lymphoma (BCL) cell lines. Flow cytometry plots show coexpression of PD-L1 and CD20 in 3 representative non-GCB DLBCL cell lines (HBL-1, LP, and WP) and the RC GCB DLBCL cell line, which was used as a negative control for PD-L1 and positive control for CD20 (inset). *EBV+ MCL cell line. (B) RPPA heat map showing a cluster based on high PD-L1 expression level on all cell lines analyzed. (C) Proteins within the cluster and their known cellular functions, analyzed by ingenuity pathway analysis.
PD-L1+ lymphoma cells secrete IL-10 cytokine, stimulating STAT3 activation
The PD-L1 protein signature defined by RPPA analysis included proteins in the JAK2/STAT3 pathway; therefore, we examined whether PD-L1+ cells secrete chemokines/cytokines that can stimulate this pathway. The Th1/Th2/Th17 cytokine antibody array results showed that PD-L1+ cell lines (n = 7) secreted a high quantity of the immunosuppressive cytokine IL-10, whereas PD-L1− cell lines (n = 5) did not (Figure 2A). These findings were further validated by IL-10 enzyme-linked immunosorbent assay (ELISA), which showed that PD-L1+ cell lines secreted a significantly higher amount of IL-10 than did the PD-L1− cell lines (Figure 2B; P = .0035). Interestingly, the secretion of TNF-α cytokine was also seen in PD-L1+ cell lines, albeit at a much lower level. The significance of this finding requires further investigation, because TNF-α is an important immune modulator in various systems. Next, we examined the relationships among the protein expression levels of pSTAT3, PD-L1, and IL-10 in representative DLBCL cell lines (n = 12) and found that they were significantly correlated (Figure 2C), leading us to hypothesize that IL-10 may be stimulating this signaling pathway to induce STAT3-mediated PD-L1 expression. To test this hypothesis, we examined whether blocking IL-10 signaling with an IL-10 receptor–neutralizing antibody30 inhibited STAT3 activation and subsequently inhibited PD-L1 expression. The IL-10–neutralizing antibody inhibited the viability of cell lines secreting IL-10 but not the cell lines that do not secrete IL-10 (supplemental Figure 4B), suggesting that 1 of the key functions of IL-10 is to maintain cell survival. Further analysis shows that the IL-10–neutralizing antibody inhibited IL-10–induced STAT3 activation, resulting in inhibition of PD-L1 expression in DLBCL cells (Figure 2D). Downregulation of STAT3 via siRNA approaches led to PD-L1 protein inhibition (Figure 2E), as well as blocking STAT3 binding to the PD-L1 promoter region, particularly in the PD-L1+ DLBCL cell lines (Figure 2F). These findings imply that the IL-10/STAT3 signaling pathway is required and sufficient for the regulation of PD-L1 expression in these DLBCL cell lines.
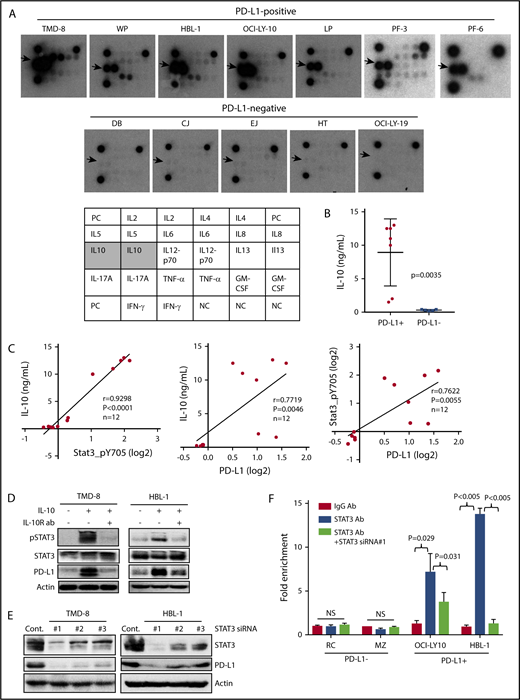
PD-L1+lymphoma cells secrete IL-10 cytokine stimulating STAT3 activation. (A) Cytokine protein array was analyzed in 7 PD-L1+ cell lines and 5 PD-L1− cell lines. Arrows point to dot intensity of secreted IL-10. The table shows the cytokines included in this array. (B) Supernatants from the 12 cell lines in (A) were analyzed for IL-10 secretion using ELISA. (C) The Spearman correlation method was used to compare the protein expression levels of pSTAT3 and PD-L1 vs IL-10 secretion in 12 cell lines in (A). (D) TMD-8 and HBL-1 cells were treated with recombinant IL-10 (10 ng/mL) or IL-10 with IL-10R antibodies for 24 hours. Protein extracts were analyzed for pSTAT3, STAT3, PD-L1, and actin. (E) TMD-8 and HBL-1 cells were transiently transfected with control or predesigned and validated STAT3 siRNAs. At 48 hours after transfection, proteins purified from transfected cells were subjected to western blotting for STAT3, PD-L1, and actin (loading control). (F) PD-L1− DLBCL cell lines (RC and MZ) and PD-L1+ DLBCL cell lines (OCI-LY10 and HBL-1) were transiently transfected with a control siRNA or STAT3 siRNA. At 48 hours posttransfection, ChIP assays, followed by qPCR, were performed. Bar graphs show the results of qPCR of PD-L1 promoter region pulled down by the STAT3 antibody as fold enrichment relative to the background signals from the isotype-control immunoglobulin G antibody. NS, not statistically significant.
PD-L1+lymphoma cells secrete IL-10 cytokine stimulating STAT3 activation. (A) Cytokine protein array was analyzed in 7 PD-L1+ cell lines and 5 PD-L1− cell lines. Arrows point to dot intensity of secreted IL-10. The table shows the cytokines included in this array. (B) Supernatants from the 12 cell lines in (A) were analyzed for IL-10 secretion using ELISA. (C) The Spearman correlation method was used to compare the protein expression levels of pSTAT3 and PD-L1 vs IL-10 secretion in 12 cell lines in (A). (D) TMD-8 and HBL-1 cells were treated with recombinant IL-10 (10 ng/mL) or IL-10 with IL-10R antibodies for 24 hours. Protein extracts were analyzed for pSTAT3, STAT3, PD-L1, and actin. (E) TMD-8 and HBL-1 cells were transiently transfected with control or predesigned and validated STAT3 siRNAs. At 48 hours after transfection, proteins purified from transfected cells were subjected to western blotting for STAT3, PD-L1, and actin (loading control). (F) PD-L1− DLBCL cell lines (RC and MZ) and PD-L1+ DLBCL cell lines (OCI-LY10 and HBL-1) were transiently transfected with a control siRNA or STAT3 siRNA. At 48 hours posttransfection, ChIP assays, followed by qPCR, were performed. Bar graphs show the results of qPCR of PD-L1 promoter region pulled down by the STAT3 antibody as fold enrichment relative to the background signals from the isotype-control immunoglobulin G antibody. NS, not statistically significant.
BCR plays a role in GSK3β-mediated NFATc1 activation and PD-L1 induction in DLBCL cells
We found that the nuclear protein expression of the transcription factor NFATc1 was found mainly in non-GCB DLBCL cell lines, correlating with PD-L1 and pSTAT3 expression (Figure 3A), and suggesting that these signaling pathways are somehow connected and integrated in DLBCL cells. To understand how NFATc1 is activated, we assessed for possible involvement of the BCR signaling pathway, because the PD-L1 signature (Figure 1C) includes 2 key proteins related to the BCR pathway (Src, PKC-βII). GSK3β is a downstream target of PKC-βII and is a key negative regulator of NFATc1 activation. Our data show that treatment of DLBCL cells with the PKC-βII/GSK3β inhibitor enzastaurin resulted in inhibition of pGSK3β, which, in turn, led to NFATc1 downregulation in the nucleus (Figure 3B). We then transfected a representative DLBCL cell line (OCI-LY10) with plasmids containing wild-type GSK3β or a constitutively active mutant GSK3β (S9A) (Addgene).31 The ninth serine in GSK3β was switched to alanine, resulting in a mutant GSK3β that cannot be phosphorylated and, thus, remains in the constitutively activated state. We observed enhanced phosphorylation of GSK3β in cells transfected with the wild-type GSK3β plasmid but not in cells transfected with the mutant (Figure 3C), again demonstrating constitutive phosphorylation of GSK3β. However, transfection of cells with either plasmid blocked NFATc1 activation (Figure 3C), most likely through the dominant-negative activity of dephosphorylated GSK3β for both plasmids. The phosphorylated state of GSK3β was suppressed by silencing BCR signaling via treatment with the PKC-βII inhibitor enzastaurin or the BTK inhibitor ibrutinib (Figure 3D). Constitutive GSK3β phosphorylation and NFATc1 activation were suppressed by blocking the BCR pathway with small molecule inhibitors (supplemental Figure 4C). Stimulating the BCR pathway with anti-IgM induced NFATc1 and pSTAT3 expression in the nucleus and PD-L1 expression in the cytoplasm, and blocking the BCR pathway with enzastaurin or ibrutinib led to inhibition of IgM-mediated NFATc1, STAT3, and PD-L1 stimulation (Figure 3E), suggesting that BCR signaling may be responsible for GSK3β/NFATc1/STAT3/PD-L1 activation in DLBCL cells.
![Figure 3. Role of GSK3β-mediated NFATc1 activation and PD-L1 induction in DLBCL cells. (A) Cytoplasmic extracts (CE) and nuclear extracts (NE) were purified from representative non-GCB and GCB DLBCL cell lines and subjected to western blot analysis for PD-L1, actin (loading control cytoplasmic extracts), NFATc1, pSTAT3, and lamin B (loading control NE). (B) LP (DLBCL) cells were treated with increasing doses of enzastaurin for 24 hours, and protein expression levels of pGSK3β, GSK3β, and actin were analyzed by western blotting using cytoplasmic extracts. Nuclear extracts were used for western blot analysis for NFATc1 and lamin B protein expression. (C) LP (DLBCL) cells were transfected with a control vector or GSK3β plasmid (mutant [mut] or wild-type [wt]). Protein expression levels of GSK3β, pGSK3β, actin, and NFATc1 (nuclear extraction) were determined by western blotting. (D) LP (DLBCL) cells transfected with wt GSK3β were treated with the GSK3β inhibitor enzastaurin (ENZ) or BTK inhibitor ibrutinib (IBN) for 24 hours, and protein expression levels of pGSK3β, GSK3β, and actin were analyzed by western blotting. (E) HBL-1 non-GCB DLBCL cells were stimulated with IgM, and, in some cases, IgM-stimulated cells were treated with ENZ or IBN for 24 hours. Nuclear extracts were examined for NFATc1 and pSTAT3 expression, whereas cytoplasmic extracts were analyzed for PD-L1 expression. Actin was used as a loading control. (F) OCI-LY10 cells were treated with different doses of ibrutinib, APC-196, or BGB-3111 for 24 hours. Purified nuclear extracts were used to examine pSTAT3, STAT3, NFATc1, and lamin B (loading control) protein expression levels by western blotting. Cytoplasmic extracts were used to examine PD-L1 and actin (loading control). (G) HBL-1 and LP cells were treated with ibrutinib, APC-196, or BGB-3111 for different times (24 or 48 hours), and cytoplasmic and nuclear extracts were purified and examined for expression levels of NFATc1, pSTAT3, lamin B, PD-L1, and actin (loading control).](https://ash.silverchair-cdn.com/ash/content_public/journal/blood/132/17/10.1182_blood-2018-03-841015/4/m_blood841015f3.png?Expires=1770987938&Signature=HCHHnfbEW3lR0wNvltHdIVpFXIJBpxRRR6HcQUMajANJG9PB34BhRmglwGHnzSXR8VECV5~vfxRPb3JckcSFEDY0PnSnMouyLjEzl1-dsTyfRtocvcaPHP1brzzt~lnbUShWoUpseMd3mgtfYdrrTlJkHfSLGOSIcgMl8ZH7HLVEJ0EMI6Y7d36HrvMqmex5TJlUSKlHYiLFYk~Sgve-tFrGyUkp03JCsd7iYaqH2DjlNfXviuRWtHweDRXyf0fyZ9Q7JvaI0Mk1xXOBGeZjse5gytxLgtDXa72X1ztfKifk6~ABVqsd6RE955GvTxq7AFRBuGKnZ-cKtRCkv-wq3Q__&Key-Pair-Id=APKAIE5G5CRDK6RD3PGA)
Role of GSK3β-mediated NFATc1 activation and PD-L1 induction in DLBCL cells. (A) Cytoplasmic extracts (CE) and nuclear extracts (NE) were purified from representative non-GCB and GCB DLBCL cell lines and subjected to western blot analysis for PD-L1, actin (loading control cytoplasmic extracts), NFATc1, pSTAT3, and lamin B (loading control NE). (B) LP (DLBCL) cells were treated with increasing doses of enzastaurin for 24 hours, and protein expression levels of pGSK3β, GSK3β, and actin were analyzed by western blotting using cytoplasmic extracts. Nuclear extracts were used for western blot analysis for NFATc1 and lamin B protein expression. (C) LP (DLBCL) cells were transfected with a control vector or GSK3β plasmid (mutant [mut] or wild-type [wt]). Protein expression levels of GSK3β, pGSK3β, actin, and NFATc1 (nuclear extraction) were determined by western blotting. (D) LP (DLBCL) cells transfected with wt GSK3β were treated with the GSK3β inhibitor enzastaurin (ENZ) or BTK inhibitor ibrutinib (IBN) for 24 hours, and protein expression levels of pGSK3β, GSK3β, and actin were analyzed by western blotting. (E) HBL-1 non-GCB DLBCL cells were stimulated with IgM, and, in some cases, IgM-stimulated cells were treated with ENZ or IBN for 24 hours. Nuclear extracts were examined for NFATc1 and pSTAT3 expression, whereas cytoplasmic extracts were analyzed for PD-L1 expression. Actin was used as a loading control. (F) OCI-LY10 cells were treated with different doses of ibrutinib, APC-196, or BGB-3111 for 24 hours. Purified nuclear extracts were used to examine pSTAT3, STAT3, NFATc1, and lamin B (loading control) protein expression levels by western blotting. Cytoplasmic extracts were used to examine PD-L1 and actin (loading control). (G) HBL-1 and LP cells were treated with ibrutinib, APC-196, or BGB-3111 for different times (24 or 48 hours), and cytoplasmic and nuclear extracts were purified and examined for expression levels of NFATc1, pSTAT3, lamin B, PD-L1, and actin (loading control).
Role of GSK3β-mediated NFATc1 activation and PD-L1 induction in DLBCL cells. (A) Cytoplasmic extracts (CE) and nuclear extracts (NE) were purified from representative non-GCB and GCB DLBCL cell lines and subjected to western blot analysis for PD-L1, actin (loading control cytoplasmic extracts), NFATc1, pSTAT3, and lamin B (loading control NE). (B) LP (DLBCL) cells were treated with increasing doses of enzastaurin for 24 hours, and protein expression levels of pGSK3β, GSK3β, and actin were analyzed by western blotting using cytoplasmic extracts. Nuclear extracts were used for western blot analysis for NFATc1 and lamin B protein expression. (C) LP (DLBCL) cells were transfected with a control vector or GSK3β plasmid (mutant [mut] or wild-type [wt]). Protein expression levels of GSK3β, pGSK3β, actin, and NFATc1 (nuclear extraction) were determined by western blotting. (D) LP (DLBCL) cells transfected with wt GSK3β were treated with the GSK3β inhibitor enzastaurin (ENZ) or BTK inhibitor ibrutinib (IBN) for 24 hours, and protein expression levels of pGSK3β, GSK3β, and actin were analyzed by western blotting. (E) HBL-1 non-GCB DLBCL cells were stimulated with IgM, and, in some cases, IgM-stimulated cells were treated with ENZ or IBN for 24 hours. Nuclear extracts were examined for NFATc1 and pSTAT3 expression, whereas cytoplasmic extracts were analyzed for PD-L1 expression. Actin was used as a loading control. (F) OCI-LY10 cells were treated with different doses of ibrutinib, APC-196, or BGB-3111 for 24 hours. Purified nuclear extracts were used to examine pSTAT3, STAT3, NFATc1, and lamin B (loading control) protein expression levels by western blotting. Cytoplasmic extracts were used to examine PD-L1 and actin (loading control). (G) HBL-1 and LP cells were treated with ibrutinib, APC-196, or BGB-3111 for different times (24 or 48 hours), and cytoplasmic and nuclear extracts were purified and examined for expression levels of NFATc1, pSTAT3, lamin B, PD-L1, and actin (loading control).
To further substantiate our findings, we examined whether other BTK inhibitors could inhibit constitutive NFATc1 and STAT3 activation in DLBCL cells and, thereby, inhibit PD-L1 expression. All 3 BTK inhibitors tested, ibrutinib, ACP-196, and BGB-3111, were capable of suppressing NFATc1 and STAT3 activation and inhibiting PD-L1 expression in a concentration-dependent manner in a representative non-GCB DLBCL cell line (OCI-LY10; Figure 3F). These findings were further validated in 2 additional PD-L1+ non-GCB DLBCL cell lines; treating the cells with BTK inhibitors led to inhibition of NFATc1, STAT3, and PD-L1 in a time-dependent manner (Figure 3G). Ibrutinib treatment also inhibited PD-L1 expression on the cell membrane, as demonstrated by flow cytometry analysis (supplemental Figure 3). These findings led us to question whether these signaling pathways are integrated, such that NFATc1 activation can induce IL-10 and, thereby, activate the STAT3/PD-L1 pathway.
BCR-mediated NFATc1 activation regulates IL-10 expression in DLBCL cells
To examine whether BCR-mediated NFATc1 activation induces IL-10 expression in DLBCL cells, we first tested the effects of BTK inhibitors on IL-10 secretion in DLBCL cells. As shown in 2 representative DLBCL cell lines (OCI-LY10 and HBL-1), BTK inhibitors inhibited IL-10 secretion in a dose-dependent manner (Figure 4A). Drug concentrations as low as 100 nM could block >50% of IL-10 secretion within 24 hours. We then tested the effect of NFATc1 on IL-10 secretion by directly downregulating NFATc1 using an shRNA approach. As shown in Figure 4B, downregulating NFATc1 significantly inhibited IL-10 secretion and STAT3 phosphorylation.
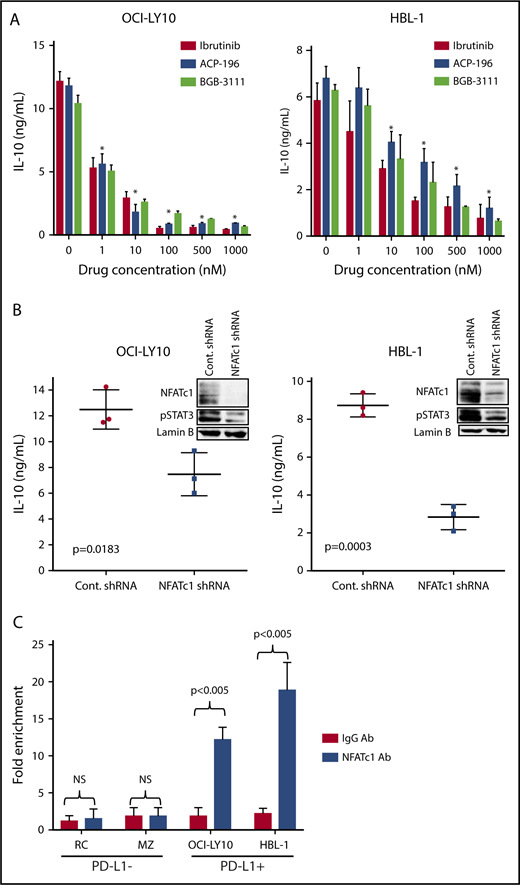
BCR-mediated NFATc1 activation regulates IL-10 expression in DLBCL cells. (A) OCI-LY10 and HBL-1 cells were treated with different BTK inhibitors (ibrutinib, ACP-196, and BGB-3111) at different doses for 24 hours. Supernatants collected from these samples were used to analyze IL-10 secretion using ELISA. (B) OCI-LY10 and HBL-1 cells were transfected with validated NFATc1 or control shRNA plasmids. After a 72-hour incubation, ELISA was used to examine IL-10 secretion in the supernatants, and purified nuclear extracts from the transfected cells were analyzed for NFATc1, pSTAT3, and lamin B (loading control) expression by western blotting. (C) Bar graphs show results of qPCR of regions (amplicon 1) pulled down by the NFATc1 antibody as fold enrichment relative to the background signals from the isotype-control immunoglobulin G antibody. *P < .05. NS, not statistically significant.
BCR-mediated NFATc1 activation regulates IL-10 expression in DLBCL cells. (A) OCI-LY10 and HBL-1 cells were treated with different BTK inhibitors (ibrutinib, ACP-196, and BGB-3111) at different doses for 24 hours. Supernatants collected from these samples were used to analyze IL-10 secretion using ELISA. (B) OCI-LY10 and HBL-1 cells were transfected with validated NFATc1 or control shRNA plasmids. After a 72-hour incubation, ELISA was used to examine IL-10 secretion in the supernatants, and purified nuclear extracts from the transfected cells were analyzed for NFATc1, pSTAT3, and lamin B (loading control) expression by western blotting. (C) Bar graphs show results of qPCR of regions (amplicon 1) pulled down by the NFATc1 antibody as fold enrichment relative to the background signals from the isotype-control immunoglobulin G antibody. *P < .05. NS, not statistically significant.
Because the IL-10 promoter contains a potential NFAT DNA binding site (supplemental Figure 4D), we examined whether NFATc1 could bind to the IL-10 promoter. ChIP-qPCR experiments were carried out in 2 representative PD-L1+ DLBCL cell lines (OCI-LY10 and HBL-1) and 2 PD-L1− DLBCL cell lines (RC and MZ). NFATc1 binding to the IL-10 promoter was significantly greater in PD-L1+ cell lines than in PD-L1− DLBCL cell lines (Figure 3C).
Validation of PD-L1 signature in primary DLBCL samples
We initially examined messenger RNA (mRNA) expression levels of CD274 (PD-L1), STAT3, and IL-10 in GCB vs ABC primary DLBCL tumors using a cohort of 428 samples. The results show that the mRNA expression levels of these genes were significantly higher (P < .05) in ABC than in GCB DLBCL (Figure 5A). The protein levels of PD-L1 and pSTAT3, as assessed by immunohistochemistry, were also significantly higher (P < .0001) in ABC vs GCB subtype DLBCL (Figure 5B). We then correlated STAT3, PD-L1, and IL-10 in the ABC and GCB-DLBCL subtypes combined. The mRNA levels of STAT3 and IL-10, as well as the pSTAT3 protein level, were significantly higher (P < .003) in PD-L1+ cases in comparison with PD-L1− cases (Figure 5C). PD-L1 protein levels were significantly higher (P < .01) in pSTAT3hi or pSTAT3+ tumors in comparison with pSTAT3lo or pSTAT3− tumors (Figure 5D). IL-10 mRNA levels were higher in pSTAT3hi cases, but this difference was not significant (P = .22; Figure 5D). We also discovered that the level of CXCL10 mRNA was significantly higher in the ABC vs GCB subtype of DLBCL, and its expression level correlated significantly with the levels of PD-L1 and pSTAT3 protein expression (Figure 5E). These findings were further confirmed in another cohort containing 350 primary DLBCL samples (Oncomine data set)25 ; the analysis showed significantly higher (P < .0001) PD-L1, STAT3 and IL-10 expression levels in ABC DLBCL compared with GBC DLBCL (supplemental Figure 5A) and significant correlations among IL-10, STAT3, and PD-L1 mRNA expression levels (P < .0001; supplemental Figure 5B). Interestingly, the mRNA level of NFATc1 was also significantly higher in ABC vs GCB DLBCL (P < .001; supplemental Figure 5C), but its correlation status with the PD-L1 signature was not statistically significant (supplemental Figure 5D).

PD-L1 signature was validated in primary DLBCL samples. (A) Scatter plots comparing CD274, STAT3, and IL-10 mRNA expression levels in GCB vs ABC subtypes of DLBCL. (B) Scatter plots comparing PD-L1 and pSTAT3 protein expression in GCB vs ABC DLBCL subtypes. (C) Scatter plots comparing pSTAT3 protein expression, as well as STAT3 and IL-10 mRNA expression, in PD-L1+ vs PD-L1− DLBCL cases. (D) Scatter plots comparing PD-L1 protein expression and IL-10 mRNA expression levels in pSTAT3lo/pSTAT3− vs pSTAT3hi/pSTAT3+ DLBCL cases. (E) Scatter plots comparing CXCL10 mRNA levels in GCB vs ABC, PD-L1− vs PD-L1+, and pSTAT3− vs pSTAT3+ DLBCL.
PD-L1 signature was validated in primary DLBCL samples. (A) Scatter plots comparing CD274, STAT3, and IL-10 mRNA expression levels in GCB vs ABC subtypes of DLBCL. (B) Scatter plots comparing PD-L1 and pSTAT3 protein expression in GCB vs ABC DLBCL subtypes. (C) Scatter plots comparing pSTAT3 protein expression, as well as STAT3 and IL-10 mRNA expression, in PD-L1+ vs PD-L1− DLBCL cases. (D) Scatter plots comparing PD-L1 protein expression and IL-10 mRNA expression levels in pSTAT3lo/pSTAT3− vs pSTAT3hi/pSTAT3+ DLBCL cases. (E) Scatter plots comparing CXCL10 mRNA levels in GCB vs ABC, PD-L1− vs PD-L1+, and pSTAT3− vs pSTAT3+ DLBCL.
Discussion
In the current study, we used proteomic approaches in DLBCL cell lines and genomic profiling of primary DLBCL to demonstrate the role of BCR-mediated NFATc1 activation on PD-L1 gene regulation through the IL-10/STAT3 signaling pathway (Figure 6). BTK and GSK3β are downstream substrates of the BCR pathway and play important roles in the biology of aggressive B-cell lymphomas.32,33 Our data link NFATc1 activation to these important kinases and oncogenes, further implicating the NFATc1 pathway as an important therapeutic target. Our findings support the concept that dysregulated receptor/ligand interactions (chronic/tonic BCR signaling), particularly in the ABC subtype of DLBCL, maintain autonomous cell growth and survival by stimulating and maintaining constitutive NFATc1 activation. In addition, activated NFATc1 provides tumor cells the proper signal to potentially evade the immune system through regulation of IL-10/STAT3–mediated PD-L1 expression. The JAK2/STAT3 signaling pathway has been shown to regulate PD-L1 expression in various tumor models,34-36 and binding of STAT3 to the PD-L1 promoter has also been previously demonstrated.37-40 PD-L1 is transcribed in response to the activation of multiple signaling pathways, and transcription factors, such as HIF1-α, Myc, Stats, and AP-1, have been reported to bind and transactivate PD-L1.41 Other important transcription factors, such as NF-κB (highly activated in ABC subtype) and STAT5A (found in our PD-L1 signature), may also be involved in PD-L1 regulation in DLBCL cells, but our findings pinpoint the IL-10/STAT3 pathway as the driving force for PD-L1 expression, providing additional rationale for targeting this pathway to enhance immune tolerance in PD-L1+ DLBCL subsets.

Model depicting PD-L1 regulation and mechanism of immune tolerance in DLBCL. In PD-L1+ B-cell lymphoma cells, BCR-mediated NFATc1 activation upregulates IL-10 chemokine expression. Released IL-10 activates the JAK2/STAT3 pathway, leading to STAT3-induced PD-L1 expression. IL-10 antagonist antibody abrogates IL-10/STAT3 signaling and PD-L1 protein expression. BCR pathway inhibition by BTK inhibitors (ibrutinib, acalabrutinib, and BGB-3111) blocks NFATc1 and STAT3 activation, resulting in inhibition of IL-10 and PD-L1 expression. Downregulation of IL-10/PD-L1 signaling could potentially release the immune tolerance brake, allowing anergic T cells to become activated CD8+ cytotoxic T cells and target and destroy tumor cells. This immune tolerance mechanism also could be controlled and regulated by the tumor microenvironment via tumor-associated macrophages that are recruited by the tumor cells through CCL3 and CXCL10 chemokines.
Model depicting PD-L1 regulation and mechanism of immune tolerance in DLBCL. In PD-L1+ B-cell lymphoma cells, BCR-mediated NFATc1 activation upregulates IL-10 chemokine expression. Released IL-10 activates the JAK2/STAT3 pathway, leading to STAT3-induced PD-L1 expression. IL-10 antagonist antibody abrogates IL-10/STAT3 signaling and PD-L1 protein expression. BCR pathway inhibition by BTK inhibitors (ibrutinib, acalabrutinib, and BGB-3111) blocks NFATc1 and STAT3 activation, resulting in inhibition of IL-10 and PD-L1 expression. Downregulation of IL-10/PD-L1 signaling could potentially release the immune tolerance brake, allowing anergic T cells to become activated CD8+ cytotoxic T cells and target and destroy tumor cells. This immune tolerance mechanism also could be controlled and regulated by the tumor microenvironment via tumor-associated macrophages that are recruited by the tumor cells through CCL3 and CXCL10 chemokines.
Although we have shown significant correlations in the IL-10/STAT3/PD-L1 signature in primary DLBCL samples, NFATc1 mRNA expression did not statistically correlate with the PD-L1 signature. One possibility is that high NFATc1 mRNA does not translate to high NFATc1 activation, because NFATc1 protein requires dephosphorylation prior to nuclear translocation. Another possibility is that the source of IL-10 (to stimulate the STAT3/PD-L1 pathway) is independent of NFATc1, possibly derived from tumor-associated macrophages in the tumor microenvironment.
The 3 candidate BTK inhibitors that we tested appear to be very promising in terms of their biological activities and therapeutic targeting potential and are currently being tested in clinical trials for patients with refractory DLBCL and other hematologic diseases.42,43 In fact, ibrutinib has produced a good response rate in patients with non-GCB DLBCL.44 Use of BTK inhibitors represents initial attempts to pharmacologically probe these unique human DLBCL model systems with rationally designed inhibitory agents that can putatively target the BCR/NFATc1 pathway. Future studies are needed to evaluate these agents in more detail for their specific targeting of the NFAT pathway and their potential therapeutic efficacy in combination with immunotherapies (anti–PD-1/PD-L1 antibodies) in both in vitro and in vivo models of DLBCL. Increased expression of PD-L1 in cancer cells was associated with increased response; therefore, the PD-L1 protein signature identified in our study can potentially be used to predict responsiveness to anti–PD-1/PD-L1 antibody therapies, particularly in the ABC subtype of DLBCL.
NFAT functions have been linked recently to tumor immunity.45,46 For example, NFAT activation is required for the development of CD4+ anergic T cells47 and CD8+ T-cell exhaustion,48 2 forms of T-cell dysfunction that occur in many cancers. NFAT regulates PD-1 expression in anergic T cells49 and, thus, inhibition of NFAT or the kinase regulating the NFAT pathway would enhance T-cell function.50,51 These findings support the premise that targeting the NFAT pathway in cancer patients could lead to tumor cell killing, either directly by abrogating NFAT-dependent tumor cell survival or indirectly by enhancing immune T-cell activation. The results of this study show that NFATc1 activation in DLBCL cells is dependent on the BCR pathway and that blocking the BTK kinase leads to NFATc1 inhibition, indicating that BTK inhibitors may have immune-modulatory activity. Not surprisingly, a recent study by Sagiv-Barfi et al52 showed that the combination of anti–PD-L1 antibodies and ibrutinib led to impressive therapeutic effects in syngeneic mouse models of lymphoma, as well as in syngeneic mouse models of breast and colon cancer.52 In addition, ibrutinib treatment in patients with chronic lymphocytic leukemia improves T-cell number and function, probably because of inhibition of PD-1 expression on T cells and inhibition of NFATc1, resulting in a reduction of the immunosuppressive chemokine IL-10 in chronic lymphocytic leukemia cells.53,54 These studies provide clear evidence that BTK inhibitors, including ibrutinib and second-generation BTK inhibitors, such as ACP-196 and BGB-3111, may enhance T-cell–directed therapies, most likely by targeting ITK to inhibit NFAT activation in T cells, as well as targeting BTK to inhibit NFAT and STAT3 activation in malignant B cells.55 Thus, it will be valuable to determine the key therapeutic platforms in which NFAT can be modulated to augment antitumor immunity.
Among NFAT family members, only NFATc1 has been described as being functional in the B-cell lineage: B-cell development was impaired in NFATc1-deficient mice.56 NFATc1, a particularly important multifunctional regulatory molecule (eg, transcription factor, chromatin remodeler), has been shown to be intrinsically involved in various types of cancers, including pancreatic cancer, melanoma, chronic myeloid leukemia, T-cell acute lymphoblastic leukemia, and B-cell lymphomas.57-63 NFATc1 involvement in DLBCL is becoming increasingly recognized and was confirmed genetically when NFATc1 was identified by genomic profiling and array comparative genomic hybridization as a candidate oncogene that is amplified primarily in the non-GCB DLBCL subtype, possibly contributing substantially to the pathophysiology of this disease.63,64 However, direct experimental evidence for a pathogenic role for NFATc1 in DLBCL is lacking. Although mutated NFAT proteins have not been associated with human cancers, numerous recent studies have documented aberrant NFAT signaling, usually involving overexpression and/or hyperactivity in tumor development and metastasis.65-68 Taken together, the available data and our findings strongly suggest an important role for NFATc1 signaling in the pathogenesis of hematological malignancies and probably other types of cancer as well.
Our findings open new avenues of research on PD-1/PD-L1 biology in B-cell lymphomas and suggest that elucidating the mechanisms regulating PD-L1 will identify potential biomarkers that predict the efficacy of anti–PD-1/PD-L1 immunotherapy in cancer patients. In addition, this knowledge could allow us to modulate PD-L1 gene expression with novel small molecule inhibitors to increase the clinical efficacy of checkpoint inhibitor therapy, particularly for refractory DLBCL patients.
The online version of this article contains a data supplement.
The publication costs of this article were defrayed in part by page charge payment. Therefore, and solely to indicate this fact, this article is hereby marked “advertisement” in accordance with 18 USC section 1734.
Acknowledgments
This work was supported by a grant from the Dalian Medical Science Research Project (L.L.). The Characterized Cell Line Core, the Flow Cytometry and Cellular Imaging Facility, and the Functional Proteomics RPPA Core at The University of Texas Anderson Cancer Center are funded by the National Institutes of Health, National Cancer Institute through a Cancer Center Support Grant (P30CA016672).
Authorship
Contribution: L.L. and L.V.P. were involved in the conception and design of the study; L.L., J.Z., J.C., Z.Y.X.-M., K.H.Y., Y.M., M.X., S.W., L.J.M., and L.V.P. were responsible for the data collection and analysis and interpretation of the data; and L.J.M., M.W., R.J.F., and L.V.P. wrote the manuscript; and all authors reviewed the draft and approved the final copy of the manuscript.
Conflict-of-interest disclosure: The authors declare no competing financial interests.
Correspondence: Lan V. Pham, Department of Hematopathology, Unit 0054, The University of Texas MD Anderson Cancer Center, 1515 Holcombe Blvd, Houston, TX 77030; e-mail: lvpham@mdanderson.org.

This feature is available to Subscribers Only
Sign In or Create an Account Close Modal