

Key Points
The genetic cause of SCID impacts on survival and immune reconstitution and should be considered in tailoring HCT for individual patients.
Total and naive CD4+ cell counts in SCID patients 6 and 12 months post-HCT predict long-term survival and sustained immune reconstitution.

Abstract
The Primary Immune Deficiency Treatment Consortium (PIDTC) performed a retrospective analysis of 662 patients with severe combined immunodeficiency (SCID) who received a hematopoietic cell transplantation (HCT) as first-line treatment between 1982 and 2012 in 33 North American institutions. Overall survival was higher after HCT from matched-sibling donors (MSDs). Among recipients of non-MSD HCT, multivariate analysis showed that the SCID genotype strongly influenced survival and immune reconstitution. Overall survival was similar for patients with RAG, IL2RG, or JAK3 defects and was significantly better compared with patients with ADA or DCLRE1C mutations. Patients with RAG or DCLRE1C mutations had poorer immune reconstitution than other genotypes. Although survival did not correlate with the type of conditioning regimen, recipients of reduced-intensity or myeloablative conditioning had a lower incidence of treatment failure and better T- and B-cell reconstitution, but a higher risk for graft-versus-host disease, compared with those receiving no conditioning or immunosuppression only. Infection-free status and younger age at HCT were associated with improved survival. Typical SCID, leaky SCID, and Omenn syndrome had similar outcomes. Landmark analysis identified CD4+ and CD4+CD45RA+ cell counts at 6 and 12 months post-HCT as biomarkers predictive of overall survival and long-term T-cell reconstitution. Our data emphasize the need for patient-tailored treatment strategies depending upon the underlying SCID genotype. The prognostic significance of CD4+ cell counts as early as 6 months after HCT emphasizes the importance of close follow-up of immune reconstitution to identify patients who may need additional intervention to prevent poor long-term outcome.
Introduction
Severe combined immunodeficiency (SCID) comprises a heterogeneous group of genetic disorders collectively characterized by impaired T-cell development resulting in severe T-cell lymphopenia and lack of adaptive immune responses.1-4 Allogeneic hematopoietic cell transplantation (HCT) can fully correct the T-cell deficiency and, in some cases, the B-cell deficiency, of SCID.5 Key features associated with favorable outcome include HCT from matched sibling donors (MSDs) and younger age at HCT.1,5-7 However, the influence of typical vs atypical SCID, disease genotype, and the approach to conditioning on HCT outcome and immune reconstitution have not yet been fully defined. Early biomarkers that predict survival and long-term immune reconstitution are also needed to identify patients who could benefit from early additional therapy.8 Because of the rarity and genetic heterogeneity of SCID, addressing these issues requires a comprehensive multi-institutional database, such as that of the Primary Immune Deficiency Treatment Consortium (PIDTC),9 permitting in-depth analysis of a large patient population over an extended period of time.
Here, we report the results of a PIDTC retrospective study of 662 SCID patients from 33 North American institutions who received HCT as first-line treatment between 1 January 1982 and 31 December 2012. In addition to confirming the results reported by our Consortium in 240 SCID patients who had received HCT between 2000 and 2009,1 the larger number of patients registered in the present study has provided sufficient statistical power to analyze, for the first time, the impact of genotype and of the clinical presentation on outcome and immune reconstitution. Moreover, the large number of patients included in the study allowed us to better analyze the impact of conditioning regimen and to perform a landmark analysis to identify biomarkers at early time points after HCT that are predictive of improved survival and long-term immune reconstitution.
Methods
Study participants
Coded clinical and laboratory data were collected on each patient according to a protocol approved by the Institutional Review Board at each participating center (ClinicalTrials.gov NCT01346150). Eligibility and stratum assignment (Table 1) of all SCID patients who received allogeneic HCT, adenosine deaminase (ADA) enzyme replacement therapy (ERT), or gene therapy (GT) at a participating center between 1 January 1968 and 31 December 2012 were assessed by an expert panel according to PIDTC consensus criteria for SCID2,10 (see legend of Table 1); 733 of 845 proposed patients were eligible. Of these, 6 were excluded from the analysis because the year of HCT was missing. Fifteen patients treated between 1968 and 1982 were excluded due to lack of sufficient detailed data. Among the 712 remaining patients, 50 were excluded because the initial treatment was not HCT (ERT in 47, GT in 2, and thymic transplant in 1). Sex, race/ethnicity, presence of maternal T cells, family history, failure to thrive, and history of infection were captured when available for the remaining 662 patients who were diagnosed with typical SCID (stratum A) or leaky SCID, Omenn syndrome, or reticular dysgenesis (stratum B), according to published criteria.2
Patient characteristics
| Total | Stratum A (typical SCID) | Stratum B (leaky SCID/Omenn/RD) | P | |
|---|---|---|---|---|
| Subtype | <.001 | |||
| Total (N) | 662 | 581 | 81 | |
| Typical SCID, n (%) | 581 (100) | 0 | ||
| Leaky SCID , n (%) | 0 | 50 (61.7) | ||
| Omenn syndrome, n (%) | 0 | 27 (33.3) | ||
| RD, n (%) | 0 | 4 (5.0) | ||
| Median age at diagnosis (IQR), d | 141.5 (41-215) | 140 (30-209) | 161 (67-256) | .007 |
| Median age at treatment (IQR), d | 191.5 (104-273) | 187 (101-264) | 222 (112-381) | .002 |
| Male sex, n (%) | 471 (71.1) | 425 (73.1) | 46 (56.8) | .002 |
| Median absolute lymphocyte count (IQR), cells/mm3 | 1055 (486-2303) | 1003 (463.5-2064.5) | 2106 (854-5010) | <.001 |
| Median CD3 T-cell count (IQR), cells/mm3 | 30 (6-136) | 23.8 (4-82.2) | 510 (242-1371) | <.001 |
| Gene abnormality, n (%) | <.001 | |||
| ADA | 45 (6.8) | 40 (6.9) | 5 (6.2) | |
| IL2RG/JAK3 | 211 (31.9) | 202 (34.8) | 9 (11.1) | |
| IL2RG | 187 | 178 | 9 | |
| JAK3 | 24 | 24 | 0 | |
| IL7R, CD3 (any), CD45 | 48 (7.3) | 47 (8.1) | 1 (1.2) | |
| IL7R | 40 | 40 | 0 | |
| CD3 | 7 | 6 | 1 | |
| CD45 | 1 | 1 | 0 | |
| DCLRE1C | 28 (4.2) | 27 (4.6) | 1 (1.2) | |
| RAG | 52 (7.9) | 28 (4.8) | 24 (29.6) | |
| Other/unknown/ND | 278 (42) | 237 (40.8) | 41 (50.6) | |
| Unknown/ND | 276 | 236 | 40 | |
| PNP | 1 | 1 | 0 | |
| AK2 | 1 | 0 | 1 | |
| Failure to thrive (weight < 5th percentile), n (%) | 240 (36.3) | 210 (36.1) | 30 (37.0) | .876 |
| Infection at transplant, n (%) | .186 | |||
| Infected/active | 312 (47.1) | 274 (47.2) | 38 (46.9) | |
| Infected/resolved | 177 (26.7) | 155 (26.7) | 22 (27.2) | |
| Infected/unknown | 23 (3.5) | 17 (2.9) | 6 (7.4) | |
| No infection | 150 (22.7) | 135 (23.2) | 15 (18.5) |
Definition of typical SCID: T cells < 300 per cubic millimeter and (proliferation to PHA < 10% of lower limit of normal or documented maternal T-cell engraftment); supporting genetic evidence when available. Leaky SCID: reduced number of T cells (≤2 years old: <1000 per cubic millimeter; >2 years old and ≤4 years old: <800 per cubic millimeter; >4 years old: <600 per cubic millimeter) and proliferation to PHA < 30% and no maternal T-cell engraftment. A description table of univariate analysis by stratum was performed for strata A and B. Median (IQR) and frequencies were provided for continuous variables and categorical variables separately. Kruskal-Wallis tests and χ2 tests were applied to evaluate the association for continuous variables and categorical variables, respectively.
IQR, interquartile range; ND, not done; Omenn, Omenn syndrome; RD, reticular dysgenesis.
HCT
Data collected included age and infection status at HCT; conditioning regimen; donor type (MSD, matched other related donor [MORD], mismatched related donor [MMRD], or unrelated donor [URD]); number of HLA antigen/allele mismatches; donor cell source (bone marrow, cord blood, or peripheral blood stem cells); method of graft manipulation; and graft-versus-host disease (GvHD) prophylaxis. Infection status was categorized as no infection, infection resolved before HCT, or active infection at the time of HCT. The categories of conditioning regimen were defined as previously described1 : none (No), immunosuppression (IS), reduced-intensity conditioning (RIC), and myeloablative conditioning (MAC). IS included ≥1 of the following: fludarabine, cyclophosphamide, anti-thymocyte globulin, alemtuzumab, rituximab, or other monoclonal antibody. RIC included melphalan (≤140 mg/m2), anti-CD45 antibodies, 200 to 400 cGy of total-body irradiation, thiotepa ≤ 300 mg/m2, and/or busulfan administered at a total dose < 12 mg/kg body weight. MAC included busulfan at a total dose ≥ 12 mg/kg, melphalan (>210 mg/m2), total-body irradiation ≥ 700 cGy, or thiotepa > 600 mg/m2. A second HCT was defined as an additional HCT from a different donor (with or without conditioning) or from the same donor with conditioning. Secondary treatment included a second HCT or addition of and/or switch to ERT or GT. The patients who received a secondary treatment were censored at the time of that treatment. Data on cell source and GvHD prophylaxis are provided in supplemental Table 1 (available on the Blood Web site).
Immune reconstitution
Absolute numbers of CD3+, CD4+, CD8+, and CD45RA+CD4+ T cells, CD19+ or CD20+ B cells, and CD56+CD3− or CD16+/CD56+ natural killer (NK) cells; proliferative response to phytohemagglutinin (PHA); serum concentrations of immunoglobulin G (IgG), IgA, and IgM; and treatment with replacement immunoglobulin (Ig) were collected when available at 100 days, 6 months, 1 to 2 years, 2 to 5 years, 6 to 10 years, 10 to 20 years, and >20 years after HCT. T-cell reconstitution was defined as meeting ≥2 of these criteria: PHA proliferative response > 50% of the lower limit of the reference range for healthy controls, CD3+ cell count > 1000 per cubic millimeter, and CD4+ cell count > 500 per cubic millimeter. B-cell reconstitution was defined as independence from Ig-replacement therapy.
Statistical analysis
Survival was calculated by the Kaplan-Meier estimator, with data being censored at the date of last follow-up for surviving patients. Need for a second treatment, acute GvHD (aGvHD), and chronic GvHD (cGvHD) were analyzed using a cumulative incidence method, with death considered a competing event. Confidence intervals (CIs) were calculated using a log transformation. Multivariate (MV) Cox regression models examining risk factors for HCT outcomes were built using stepwise forward selection, with a P value ≤ .05 considered statistically significant. Variables considered were phenotypic category, typical SCID (stratum A) vs leaky SCID/Omenn syndrome/reticular dysgenesis (stratum B), age, infection status at HCT, sex, race or ethnic group, maternal T-cell engraftment, genotype, family history, failure to thrive (weight < 5th percentile), donor type, conditioning regimen category (No/IS vs RIC/MAC), graft type, method of graft manipulation, and GvHD prophylaxis approach. All variables met the proportional-hazards assumption. Immune reconstitution post-HCT was summarized by quantitative descriptive statistics, as well as by analyzing the proportion of patients achieving specified laboratory results indicating immune recovery, among patients alive without needing a second treatment at select time points. Logistic-regression models for the probability of immune recovery were constructed using stepwise forward selection, similar to the Cox models described above. To identify biomarkers at early time points after HCT that may predict long-term survival, we performed a landmark analysis of CD4+ and CD45RA+CD4+ cell counts at 6 and 12 months post-HCT and plotted Kaplan-Meier survival curves starting at the post-HCT landmark time point at which the biomarker assessment was conducted. Log-rank tests were performed to compare the high and low categories of biomarkers (CD4+ cutoff at 500 cells per cubic millimeter; CD4+CD45RA+ cutoff at 200 cells per cubic millimeter). Use of these biomarkers for prediction of long-term immune reconstitution was summarized using area under the receiver operating characteristics (ROC) curves (plot of sensitivity vs 1 minus the specificity of biomarker for prediction of long-term outcome).
Results
Characteristics of patients and transplantation
Among the 662 SCID patients analyzed, 581 had typical SCID (stratum A), and 81 had leaky SCID (n = 50), Omenn syndrome (n = 27), or reticular dysgenesis (n = 4) (stratum B).2 Patient characteristics are reported in Table 1. As expected, the mean absolute numbers of lymphocytes and T cells at diagnosis were significantly higher in stratum B patients (P < .001). The distribution of genotypes was known for 58% of patients and was also significantly different between strata (P < .001), with the most frequent being mutations in the IL2RG gene in stratum A and RAG1/RAG2 mutations in stratum B. The median ages at diagnosis and HCT were 140 and 187 days for stratum A and 161 and 222 days for stratum B, respectively (P = .007 and .002, respectively). The distributions of race and ethnicity and of infection status at the time of HCT were similar in both strata (Table 1). Differences were observed in the distribution of donors (Table 2), particularly in the use of MMRD and URD between the 2 strata (65.6% and 16.5% in stratum A vs 39.5% and 42% in stratum B, respectively, P < .001). There were also significant differences in the type of conditioning regimen, particularly for HCT from MMRDs (76% No/IS in stratum A vs 50% in stratum B, P = .002) and from MSDs (90% No/IS in stratum A vs 54% in stratum B, P = .003) (Table 2).
Distribution of donor type and conditioning regimen according to clinical presentation (stratum)
| Total (N = 662) | Stratum A (typical SCID) (n = 581) | Stratum B (leaky SCID/Omenn/RD) (n = 81) | P | |
|---|---|---|---|---|
| Donor type | <.001 | |||
| MSD | 91 (14) | 78 (13) | 13 (16) | |
| MORD | 28 (4) | 26 (4) | 2 (2) | |
| MMRD | 413 (62) | 381 (66) | 32 (39) | |
| URD | 130 (20) | 96 (16) | 34 (42) | |
| Conditioning MSD | 91 | 78 | 13 | .002 |
| None | 54 (59) | 48 (62) | 6 (46) | |
| IS | 23 (25) | 22 (28) | 1 (8) | |
| RIC | 7 (8) | 5 (6) | 2 (15) | |
| MAC | 7 (8) | 3 (4) | 4 (31) | |
| Conditioning MORD | 28 | 26 | 2 | .799 |
| No CR | 19 (68) | 18 (69) | 1 (50) | |
| IS | 5 (18) | 4 (15) | 1 (50) | |
| RIC | 2 (7) | 2 (8) | 0 | |
| MAC | 1 (4) | 1 (4) | 0 | |
| Unknown CR | 1 (4) | 1 (4) | 0 | |
| Conditioning MMRD | 413 | 381 | 32 | .002 |
| No CR | 252 (61) | 240 (63) | 12 (38) | |
| IS | 52 (13) | 48 (13) | 4 (12) | |
| RIC | 20 (5) | 19 (5) | 1 (3) | |
| MAC | 87 (21) | 73 (19) | 14 (44) | |
| Unknown CR | 2 (0) | 1 (<1) | 1 (3) | |
| Conditioning URD | 130 | 96 | 34 | .092 |
| No CR | 11 (8) | 10 (10) | 1 (3) | |
| IS | 23 (18) | 21 (22) | 2 (6) | |
| RIC | 40 (31) | 29 (30) | 11 (32) | |
| MAC | 53 (41) | 34 (35) | 19 (56) | |
| Unknown CR | 3 (2) | 2 (2) | 1 (3) | |
| Conditioning, all donors | 662 | 581 | 81 | <.001 |
| No CR | 336 (51) | 316 (54) | 20 (25) | |
| IS | 103 (15) | 95 (16) | 8 (10) | |
| RIC | 69 (10) | 55 (9) | 14 (17) | |
| MAC | 148 (22) | 111 (19) | 37 (46) | |
| Unknown CR | 6 (1) | 4 (1) | 2 (2) |
Data in first 3 columns are shown as n (%). Descriptive statistics and univariate analyses were performed by stratum, for strata A and B. Statistics of frequencies were calculated for categorical variables at each subgroup of donor type. χ2 tests were applied to evaluate the association.
CR, conditioning regimen; Omenn, Omenn syndrome; RD, reticular dysgenesis.
Survival
The overall survival (OS) at 10 years (Kaplan-Meir estimates) was 71% (CI, 67-74) for the entire cohort. Most (67%) of the deaths occurred during the first year post-HCT and were mainly due to infections (55%), with the exception of patients with DCLRE1C mutations in whom 36% experienced death due to infectious causes, with the remainder due to other complications (supplemental Table 2). Among infections associated with death, viruses were more frequently involved than other microorganisms (supplemental Table 3).
Donor type was significantly associated with OS (P < .0001, log-rank test) (Figure 1A). OS was significantly higher after HCT from MSDs (94%; 95% CI, 87-98, at 10 years) than from any other donor type in a pairwise comparison (MSD vs MORD, P = .042; MSD vs MMRD, P < .001; MSD vs URD, P < .001). However, there were no significant differences in OS between alternative donor types (Figure 1A). Interestingly, OS was not different between strata (Figure 1B) or across decades (Figure 1C).
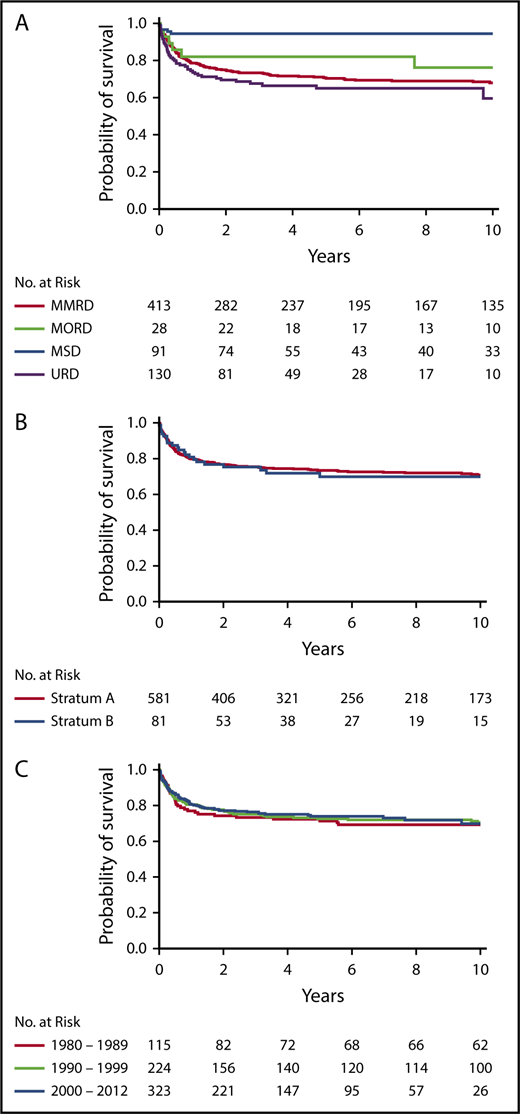
Probability of survival. Probability of survival according to donor type (P < .0001, log-rank test; pairwise comparisons: MSD vs MORD, P = .042; MSD vs MMRD, P < .001; and MSD vs URD, P < .001) (A), stratum (P = .627) (B), and decade (P = .970) (C).
Probability of survival. Probability of survival according to donor type (P < .0001, log-rank test; pairwise comparisons: MSD vs MORD, P = .042; MSD vs MMRD, P < .001; and MSD vs URD, P < .001) (A), stratum (P = .627) (B), and decade (P = .970) (C).
For recipients of non-MSD HCT (n = 571), MV analysis demonstrated that genotype (P < .001), age/infection status at HCT (P < .001), race/ethnicity (P < .001), and presence of failure to thrive (P = .046) all had significant associations with survival (Table 3). Among SCID genotypes, patients with ADA and DCLRE1C mutations had the poorest outcomes (Figure 2A). Interestingly, although RAG and DCLRE1C SCID genotypes generally confer a T−B−NK+ phenotype, patients with RAG defects had significantly better survival than did those with DCLRE1C mutations (hazard ratio [HR], 3.60; 95% CI, 1.22-10.61; P = .020). Survival of RAG-mutated patients was not significantly different from that of patients with IL2RG/JAK3 defects. Younger age and freedom from infection at time of HCT had a positive impact on survival (Figure 2B). In particular, pairwise comparison of the MV analysis showed that infection status significantly affected survival of patients who underwent HCT at ≥3.5 months of age but not those who underwent HCT at <3.5 months of age. Furthermore, among patients with active infection at the time of HCT, survival was significantly better in patients who underwent HCT at <3.5 months of age than in those who underwent HCT at a later age (HR, 0.29; 95% CI, 0.11-0.74; P = .009). African Americans had a significantly worse survival than all other ethnic groups (vs white non-Hispanic, P < .001; vs Hispanic, P = .018; and vs American Indian/Alaska native, P = .021). By contrast, donor type (MORD, MMRD, URD), conditioning regimen (No/IS vs RIC/MAC), and stratum were not identified as independent contributors to OS. In addition, there was no impact on OS based on the center or center-size effects.
MV analysis of independent factors for survival in non-MSD HCT
| Variable and categories | N (N event)* | HR estimate (95% CI)† | P | Overall P‡ |
|---|---|---|---|---|
| Age at HCT/infection | ||||
| <3.5 m/no infection (baseline) | 87 (12) | 1.00 | <.001 | |
| <3.5 m/infected/active | 26 (5) | 1.02 (0.35-3.02) | .966 | |
| <3.5 m/infected/resolved | 17 (1) | 0.40 (0.05-3.13) | .386 | |
| ≥3.5 m/infected/active | 240 (110) | 3.55 (1.91-6.62) | <.001 | |
| ≥3.5 m/infected/resolved | 138 (42) | 2.14 (1.11-4.14) | .023 | |
| ≥3.5 m/no infection | 43 (10) | 1.37 (0.58-3.24) | .470 | |
| Infected/unknown | 20 (7) | 2.32 (0.89-6.06) | .087 | |
| Failure to thrive | ||||
| No (baseline) | 370 (100) | 1.00 | .046 | |
| Yes | 201 (87) | 1.37 (1.01-1.86) | .046 | |
| Genotype | ||||
| IL2RG/JAK3 (baseline) | 198 (45) | 1.00 | <.001 | |
| ADA | 40 (15) | 2.04 (1.12-3.73) | .020 | |
| DCLRE1C | 18 (9) | 4.78 (2.02-11.33) | <.001 | |
| IL7R, CD3 (any), CD45 | 43 (11) | 1.22 (0.62-2.41) | .565 | |
| Other/unknown/ND | 234 (98) | 2.18 (1.51-3.15) | <.001 | |
| RAG | 38 (9) | 1.33 (0.61-2.86) | .472 | |
| Race/ethnicity | ||||
| White and non-Hispanic (baseline) | 272 (61) | 1.00 | <.001 | |
| American Indian/Alaska native | 25 (10) | 1.17 (0.53-2.59) | .690 | |
| Black or African American and non-Hispanic | 51 (28) | 3.23 (2.04-5.11) | <.001 | |
| Hispanic | 116 (40) | 1.75 (1.16-2.65) | .008 | |
| Unknown | 107 (48) | 2.27 (1.54-3.35) | <.001 | |
| Stratum | ||||
| A (baseline) | 503 (167) | 1.00 | .958 | |
| B | 68 (20) | 0.99 (0.60-1.63) | .958 |
For each variable, the categories are compared with the “baseline” reference group. The P values displayed for the individual categories of a variable help to assess the relative evidence of effect among the individual categories, relative to each other, but cannot be interpreted as common P values. The “HR” characterizes the ratio in instantaneous chance of death relative to the reference group. Other statistically significant pairwise comparisons include <3.5 months and active infection vs >3.5 months and active infection: HR, 0.29 (95% CI, 0.11-0.74), P = .009; >3.5 months and active infection vs >3.5 months and no infection: HR, 2.59 (95% CI, 1.34-5.00), P = .005; >3.5 months and active infection vs >3.5 months and resolved infection: HR, 1.66 (95% CI, 1.16-2.38), P = .006; <3.5 months and resolved infection vs >3.5 months and active infection: HR, 0.11 (95% CI, 0.02-0.82), P = .031; DCLRE1C vs IL7R-CD3-CD45: HR, 3.91 (95% CI, 1.43-10.74), P = .008; DCLRE1C vs RAG: HR, 3.60 (95% CI, 1.22-10.61), P = .020; American Indian/Alaska native vs black or African American/Non-Hispanic, HR, 0.36 (95% CI, 0.15-0.86), P = .021; and black or African American/non-Hispanic vs Hispanic: HR, 1.84 (95% CI, 1.11-3.05); P = .018.
ND, not done.
“N” is the number of subjects in the category of the variable; the “N event” is defined by death.
The “HR estimate” is for the event of death.
“Overall P” provides the overall significance of the variable in the model.
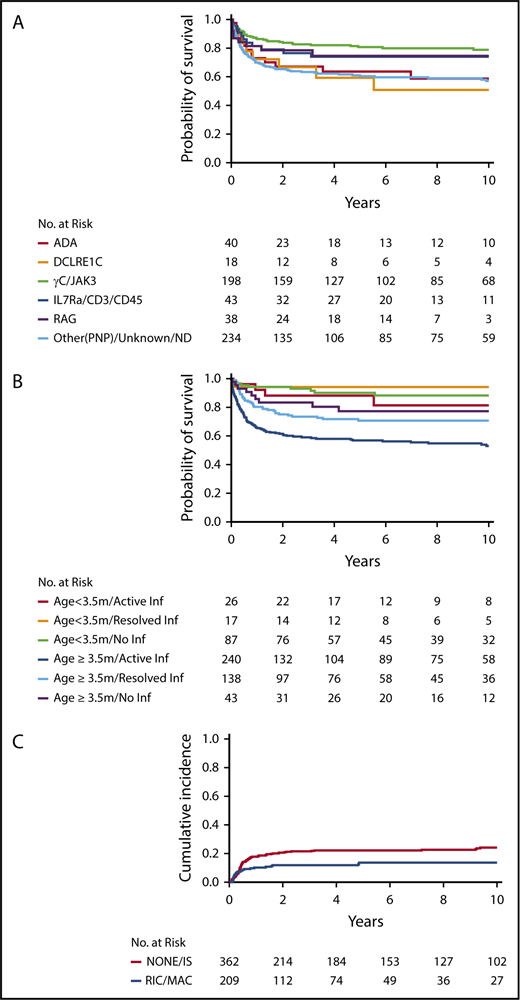
Survival in non-MSD patients. Survival in non-MSD patients according to genotype (P < .001) (A) and age and infection status at transplantation (P < .001) (B). (C) Cumulative probability of graft failure in non-MSD HCT, according to conditioning regimen (P = .025).
Survival in non-MSD patients. Survival in non-MSD patients according to genotype (P < .001) (A) and age and infection status at transplantation (P < .001) (B). (C) Cumulative probability of graft failure in non-MSD HCT, according to conditioning regimen (P = .025).
Factors associated with treatment failure in recipients of non-MSD HCT
We analyzed the factors associated with the need for a second treatment (HCT, ERT, or GT) to address treatment failure. MV analysis in non-MSD HCT recipients revealed that age/infection status at HCT (P = .05), conditioning regimen (P = .009), donor type (P = .004), decade (P = .006), and sex (P = .01) were independent factors associated with treatment failure (Table 4). Patients who received RIC/MAC were less likely to need a second treatment compared with those receiving No/IS only (HR, 0.51; 95% CI, 0.30-0.85; P = .009) (Figure 2C). Graft failure was significantly more frequent in recipients of MMRD HCT vs URD HCT (P = .005). Genotype was not associated with treatment failure overall. Unexpectedly, treatment failure was more frequently observed in the most recent decade (Table 4).
MV analysis of factors associated with a second treatment by HCT, ERT, or GT for patients who initially received non-MSD HCT
| Variable and categories | N (N event)* | HR estimate (95% CI)† | P | Overall P‡ |
|---|---|---|---|---|
| Age at HCT/infection | ||||
| <3.5 m/no infection (baseline) | 87 (9) | 1.00 | .050 | |
| <3.5 m/infected/active | 26 (4) | 1.35 (0.40-4.49) | .628 | |
| <3.5 m/infected/resolved | 17 (3) | 1.66 (0.44-6.32) | .455 | |
| ≥3.5 m/infected/active | 240 (54) | 2.85 (1.40-5.80) | .004 | |
| ≥3.5 m/infected/resolved | 138 (29) | 2.60 (1.22-5.54) | .013 | |
| ≥3.5 m/no infection | 43 (9) | 1.70 (0.66-4.35) | .270 | |
| Infected/unknown | 20 (1) | 0.67 (0.08-5.31) | .702 | |
| Conditioning | ||||
| No/IS (baseline) | 362 (83) | 1.00 | .009 | |
| RIC/MAC | 209 (26) | 0.51 (0.30-0.85) | .009 | |
| Decade | ||||
| 1982-1989 (baseline) | 102 (20) | 1.00 | .006 | |
| 1990-1999 | 192 (29) | 0.88 (0.50-1.58) | .689 | |
| 2000-2012 | 277 (60) | 1.88 (1.08-3.26) | .032 | |
| Donor type | ||||
| MMRD (baseline) | 413 (92) | 1.00 | .004 | |
| MORD | 28 (2) | 0.27 (0.07-1.11) | .069 | |
| URD | 130 (15) | 0.41 (0.21-0.77) | .005 | |
| Sex | ||||
| Female (baseline) | 158 (42) | 1.00 | .010 | |
| Male | 413 (67) | 0.56 (0.36-0.87) | .010 | |
| Genotype | ||||
| IL2RG/JAK3 | 198 (30) | 1.00 | .098 | |
| ADA | 40 (13) | 2.81 (1.38-5.73) | .04 | |
| DCLRE1C | 18 (3) | 0.97 (0.28-3.40) | .962 | |
| IL7Ra, CD3 (any), CD45 | 43 (11) | 1.23 (0.60-2.55) | .571 | |
| Other/unknown/ND | 234 (42) | 1.53 (0.92-2.54) | .097 | |
| RAG | 38 (10) | 1.77 (0.96-3.16) | .163 | |
| Stratum | ||||
| A (baseline) | 503 (92) | 1.00 | .066 | |
| B | 68 (17) | 1.74 (0.96-3.16) | .066 |
For each “variable,” the categories are compared with the “baseline” reference group. The P values displayed for the individual categories of a variable help to assess the relative evidence of effect among the individual categories, relative to each other, but cannot be interpreted as common P values. The “HR” characterizes the ratio in instantaneous chance of a second treatment relative to the reference group. Another statistically significant pairwise comparison includes 1990-1999 vs 2000-2012: HR, 0.48 (95% CI, 0.30-0.78), P = .03. The type of T-cell depletion among MMRD had no effect on the need for a second treatment. Indeed, HR for CD34+ selection vs T-cell depletion by soybean lectin is 1.38 (95% CI, 0.78-2.44), P = 0.27 and HR for other methods vs T-cell depletion by soybean lectin is 1.25 (95% CI, 0.62-2.51), P = 0.53.
ND, not done.
“N” is the number of subjects in the category of the variable; the “N event” is defined by a second treatment using HCT, ERT, or GT.
The “HR estimate” is for the event of a second treatment.
“Overall P” provides the overall significance of the variable in the model.
GvHD
Cumulative incidences of grade 2-4 aGvHD (aGvHD2-4) and cGvHD were 23% (95% CI, 20-27) at 6 months and 16% (95% CI, 13-19) at 5 years and were not significantly different among the various donor types overall (supplemental Figure 1). Among recipients of non-MSD HCT, use of RIC/MAC was associated with an increased risk for aGvHD2-4 (HR, 1.43; 95% CI, 1.01-2.03; P = .047) compared with No/IS regimens (Table 5). In the MV model of aGvHD (Table 5), donor type/method of T-cell depletion were not associated with aGvHD; this was true even in an MV model in which conditioning was removed (data not shown) to account for collinearity between conditioning and donor type/method of T-cell depletion (Table 2). On the other hand, donor type/method of graft T-cell depletion were associated with a risk for cGvHD among recipients of non-MSD HCT (Table 5). Specifically, HCT from an URD was associated with a higher incidence of cGvHD than soybean lectin T-cell–depleted MMRD (HR, 1.87; 95% CI, 1.10-3.18; P = .021). Interestingly, the presence of maternal T cells at presentation was an independent risk factor for aGvHD2-4 and cGvHD. Among MMRD recipients with maternal T-cell engraftment at diagnosis, donor sex had no impact on GvHD (P = .755). Finally, occurrence of aGvHD2-4, but not cGvHD, was associated with increased mortality among recipients of non-MSD HCT (HR, 2.18; 95% CI. 1.48-3.21; P < .001) (data not shown).
MV analysis for GvHD after non-MSD HCT
| Variable and categories | N (N Event)* | HR estimate (95% CI)† | P | Overall P‡ |
|---|---|---|---|---|
| aGvHD2-4 | ||||
| Conditioning | ||||
| No/IS (baseline) | 343 (75) | 1.00 | .047 | |
| RIC/MAC | 202 (60) | 1.43 (1.01-2.03) | .047 | |
| Maternal T-cell result | ||||
| Searched for and absent (baseline) | 147 (37) | 1.00 | .004 | |
| ND | 311 (63) | 0.80 (0.52-1.22) | .303 | |
| Present | 87 (35) | 1.61 (0.99-2.61) | .053 | |
| Stratum | ||||
| A (baseline) | 481 (122) | 1.00 | .315 | |
| B | 64 (13) | 0.73 (0.40-1.35) | .315 | |
| cGvHD | ||||
| Donor type/TCD | ||||
| MMRD-TCD/soybean lectin (baseline) | 276 (35) | 1.00 | .019 | |
| MMRD-TCD/CD34 selection | 74 (12) | 1.16 (0.59-2.30) | .667 | |
| MMRD-other§ | 41 (10) | 3.00 (1.48-6.11) | .002 | |
| MORD | 25 (5) | 1.76 (0.69-4.52) | .239 | |
| URD | 116 (25) | 1.87 (1.10-3.18) | .021 | |
| Maternal T-cell result | ||||
| Searched for and absent (baseline) | 144 (18) | 1.00 | .003 | |
| ND | 300 (45) | 1.38 (0.76-2.51) | .295 | |
| Present | 88 (24) | 3.01 (1.52-5.99) | .002 | |
| Stratum | ||||
| A (baseline) | 475 (75) | 1.00 | .101 | |
| B | 57 (12) | 1.80 (0.89-3.64) | .101 |
For each “variable,” the categories are compared with the “baseline” reference group. The P values displayed for the individual categories of a variable help to assess the relative evidence of effect among the individual categories, relative to each other, but cannot be interpreted as common P values. The “HR” characterizes the ratio in instantaneous chance of aGvHD2-4 or cGvHD relative to the reference group. For aGvHD, other statistically significant pairwise comparisons include maternal T cells ND vs present: HR, 0.50 (95% CI, 0.33-0.75), P = .001; For cGvHD, other statistically significant pairwise comparisons include MMRD-CD34 vs MMRD-other: HR, 0.39 (95% CI, 0.16-0.94), P = .036; maternal T cells ND vs present: HR, 0.46 (95% CI, 0.27-0.78), P = .004.
ND, not determined/not done; TCD, T-cell depletion.
“N” is the number of subjects in the category of the variable; the “N event” is defined by aGvHD2-4 or cGvHD.
The “HR estimate” is for the event of aGvHD2-4 or cGvHD.
“Overall P” provides the overall significance of the variable in the model.
No TCD (n = 13) or TCD performed with anti-T12 (n = 8), monoclonal antibody not specified (n = 2), anti-CT2 (n = 1), OKT3 (n = 1), anti-Leu1 (n = 2), anti-CD6/8 (n = 1), E-rosetting (n = 3), ricin (n = 6), immunomagnetic beads not specified (n = 1), or an unknown method (n = 3).
Immune reconstitution
Donor type was significantly associated with T-cell and B-cell reconstitution (defined in Methods) at 2 to 5 years post-HCT (supplemental Table 4). More specifically, URD was associated with a better T-cell reconstitution, and MMRD was associated with a poorer B-cell reconstitution (supplemental Table 4). We performed an MV analysis to identify variables associated with T- and B-cell reconstitution in the non-MSD recipients. As shown in Tables 6 and 7, conditioning regimen and genotype were independently associated with T- and B-cell reconstitution. The use of RIC/MAC was associated with better T-cell and B-cell reconstitution than No/IS regimens (HR, 9.77; 95% CI, 3.47-27.54; P < .001 and HR, 5.39; 95% CI. 2.74-10.61; P < .001, respectively). For genotype, RAG mutations were associated with poorer T-cell reconstitution than IL2RG/JAK3, IL7R/CD3/CD45, and ADA mutations, and DCLRE1C mutations were associated with poorer T-cell reconstitution than IL2RG/JAK3 genotypes (Table 6). For B-cell reconstitution, in non-MSD recipients, ADA and IL7R/CD45/CD3 genotypes were each associated with a higher probability of being off Ig-replacement therapy than IL2RG/JAK3, RAG, and DCLRE1C mutations (Table 7). In addition, donor type independently influenced B-cell reconstitution (P = .001), with MORD and URD having better reconstitution than MMRD (P = .006 and P = .002), which may also reflect the more frequent use of RIC/MAC regimens in recipients of URD and MORD grafts than in recipients of MMRD grafts (Table 2). By contrast, age and infection status at HCT had no impact on immune reconstitution (data not shown). Finally, although aGvHD had no significant impact on T- or B-cell reconstitution, cGvHD was associated with poorer T- and B-cell reconstitution (P < .001 and P = .014, respectively) (data not shown).
MV analysis for T-cell reconstitution 2 to 5 years after non-MSD HCT
| Variable and categories | N (N event)* | HR estimate (95% CI)† | P | Overall P‡ |
|---|---|---|---|---|
| Conditioning | ||||
| No/IS (baseline) | 174 (115) | 1.00 | <.001 | |
| RIC/MAC | 80 (74) | 9.77 (3.47-27.54) | <.001 | |
| Genotype | ||||
| IL2RG/JAK3 (baseline) | 114 (94) | 1.00 | .002 | |
| IL7R, CD3 (any), CD45 | 22 (14) | 0.43 (0.16-1.19) | .104 | |
| ADA | 11 (8) | 0.59 (0.14-2.51) | .472 | |
| DCLRE1C | 10 (5) | 0.15 (0.03-0.67) | .013 | |
| RAG | 15 (8) | 0.04 (0.01-0.24) | <.001 | |
| Other/unknown | 82 (60) | 0.32 (0.15-0.68) | .003 | |
| Stratum | ||||
| A (baseline) | 232 (170) | 1.00 | .169 | |
| B | 22 (19) | 3.57 (0.58-21.87) | .169 |
For each “variable,” the categories are compared with the “baseline” reference group.
The P values displayed for the individual categories of a variable help to assess the relative evidence of effect among the individual categories, relative to each other, but cannot be interpreted as common P values. The “HR” characterizes the ratio in instantaneous chance of T-cell reconstitution during 2 to 5 y after HCT, relative to the reference group. Other statistically significant pairwise comparisons include ADA vs RAG: HR, 16.17 (95% CI, 1.65-158.82), P = .017; IL7R/CD3/CD45 vs RAG: HR, 11.88 (95% CI, 1.55-91.22), P = .017; Other/unknown vs RAG: HR, 8.82 (95% CI, 1.42-54.68), P = .019.
“N” is the number of subjects in the category of the variable; the “N event” is T-cell reconstitution during 2 to 5 y after HCT; T-cell reconstitution is defined as meeting ≥2 of the following 3 criteria: PHA proliferative response > 50% of the lower limit of the reference range for healthy controls, CD3+ cell count > 1000 cells per cubic millimeter, or CD4+ cell count > 500 cells per cubic millimeter.
The “HR estimate” is for the event of T-cell reconstitution.
“Overall P” provides the overall significance of the variable in the model.
MV analysis for B-cell reconstitution 2 to 5 years after non-MSD HCT
| Variable and categories | N (N event)* | HR estimate (95% CI)† | P | Overall P‡ |
|---|---|---|---|---|
| Conditioning | ||||
| No/IS (baseline) | 189 (57) | 1.00 | <.001 | |
| RIC/MAC | 86 (60) | 5.39 (2.74-10.61) | <.001 | |
| Donor type | ||||
| MMRD (baseline) | 203 (66) | 1.00 | <.001 | |
| MORD | 17 (11) | 5.56 (1.64-18.83) | .006 | |
| URD | 55 (40) | 3.46 (1.56-7.65) | .002 | |
| Genotype | ||||
| IL2RG/JAK3 (baseline) | 127 (39) | 1.00 | <.001 | |
| IL7R, CD3 (any), CD45 | 24 (15) | 6.78 (2.54-18.07) | <.001 | |
| ADA | 14 (9) | 4.55 (1.26-16.49) | .021 | |
| DCLRE1C | 11 (2) | 0.32 (0.05-1.96) | .218 | |
| RAG | 16 (6) | 0.29 (0.06-1.30) | .105 | |
| Other/unknown/ND | 83 (46) | 2.04 (1.05-3.97) | .036 | |
| Stratum | ||||
| A (baseline) | 252 (102) | 1.00 | .393 | |
| B | 23 (15) | 1.73 (0.49-6.04) | .393 |
For each “variable,” the categories are compared with the “baseline” reference group. The P values displayed for the individual categories of a variable help to assess the relative evidence of effect among the individual categories, relative to each other, but cannot be interpreted as common P values. The “HR” characterizes the ratio in instantaneous chance of B-cell reconstitution relative to the reference group. Other statistically significant pairwise comparisons include ADA vs DCLRE1C: HR, 14.21 (95% CI, 1.66-121.27), P = .015; ADA vs RAG: HR, 15.92 (95% CI, 2.46-102.93), P = .004; DLCRE1C vs IL7R-CD3-CD45: HR, 0.05 (95% CI, 0.01-0.35), P = .003; DLCRE1C vs Other/unknown/ND: HR, 0.16 (95% CI, 0.03-0.98), P =.048; IL7R-CD3-CD45 vs RAG: HR, 23.72 (95% CI, 4.13-136.40), P < .001; IL7R-CD3-CD45 vs Other/unknown/ND: HR, 3.33 (95% CI, 1.19-9.27), P = .021; and Other/unknown/ND vs RAG: HR, 7.13 (95% CI, 1.62-31.46), P = .01.
ND, not done.
“N” is the number of subjects in the category of the variable; the “N event” is B-cell reconstitution during 2 to 5 y after HCT, defined as being off intravenous Ig.
The “HR estimate” is for the event of B-cell reconstitution.
“Overall P” provides the overall significance of the variable in the model.
Because genotype and conditioning regimen were independently associated with T- and B-cell reconstitution, we assessed the role of conditioning for each genotype. Because for several genotypes the number of patients was too low, we could perform a univariate analysis only for IL2RG/JAK3 and RAG genotypes. As shown in supplemental Tables 5 and 6, for IL2RG/JAK3 and RAG genotypes, use of RIC/MAC was associated with a better T- and B-cell immune reconstitution.
Biomarkers at 6 months and 1 year for long-term survival and immune reconstitution outcome
Analysis of the entire cohort of patients showed that patients with a CD4+ count < 500 cells per cubic millimeter at 6 and 12 months post-HCT had a significantly lower long-term OS than patients with a CD4+ count ≥ 500 cells per cubic millimeter (P < .001, log-rank test) (Figure 3A-B). A similar trend was observed for CD45RA+CD4+ cell counts; patients with < 200 CD45RA+CD4+ cells per cubic millimeter at 6 and 12 months post-HCT showed a reduced long-term OS (supplemental Figure 2). The data were similar when considering only patients who received a non-MSD HCT or when analyzing MMRD HCT and other non-MSD HCT separately (data not shown).
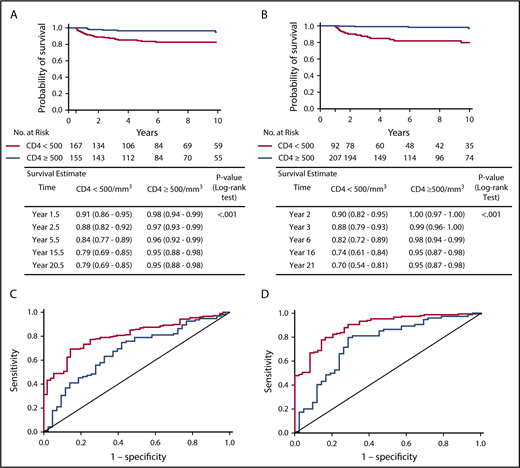
Landmark analysis of survival after 6 months and 1 year post-HCT according to CD4+cell counts and ROC curves of predictive value of CD4+counts at 6 months and 1 year for long-term T-cell reconstitution. Kaplan-Meier plots estimating survival for all patients who were alive at 6 months (A) or at 1 year (B) and did not receive second treatment according to CD4+ cell count, with log-rank test applied to evaluate the association. Estimates and 95% CIs were provided at each time point. ROC curve showing the predictive value of CD4+ cell counts at 6 months (C) or at 1 year (D) posttransplant for long-term T-cell reconstitution at 2-5 years (red) or 6-10 years (blue). Area under the ROC curve is 0.807 for 2-5 year outcome and 0.678 for 6-10 year outcome (C) and 0.890 for 2-5 year outcome and 0.755 for 6-10 year outcome (D).
Landmark analysis of survival after 6 months and 1 year post-HCT according to CD4+cell counts and ROC curves of predictive value of CD4+counts at 6 months and 1 year for long-term T-cell reconstitution. Kaplan-Meier plots estimating survival for all patients who were alive at 6 months (A) or at 1 year (B) and did not receive second treatment according to CD4+ cell count, with log-rank test applied to evaluate the association. Estimates and 95% CIs were provided at each time point. ROC curve showing the predictive value of CD4+ cell counts at 6 months (C) or at 1 year (D) posttransplant for long-term T-cell reconstitution at 2-5 years (red) or 6-10 years (blue). Area under the ROC curve is 0.807 for 2-5 year outcome and 0.678 for 6-10 year outcome (C) and 0.890 for 2-5 year outcome and 0.755 for 6-10 year outcome (D).
The predictive value of these biomarkers was also investigated for long-term immune reconstitution. Long-term T-cell reconstitution was defined as meeting ≥2 of the following criteria: PHA proliferative response > 50% of the lower limit of the reference range for healthy controls, CD3+ cell count > 1000 cells per cubic millimeter, or CD4+ cell count > 500 cells per cubic millimeter at 2-5 years or 6-10 years. As shown in Figure 3C and D, higher CD4+ cell counts at 6 and 12 months post-HCT were predictive of improved long-term T-cell reconstitution at 2-5 years and at 6-10 years post-HCT. A similar positive-predictive value was observed for the CD4+CD45RA+ cell count at 1 year post-HCT (data not shown). Using CD45RA+CD4+ and CD4+ cell counts did not improve the predictive accuracy (data not shown). Similar results were obtained when the analysis was restricted to recipients of non-MSD HCT or when we analyzed MMRD HCT and other non-MSD HCT separately and when T-cell reconstitution was assessed by the unique parameter of CD3+ cell count > 1000 cells per cubic millimeter (data not shown).
Discussion
This North American multicenter retrospective study of 662 SCID patients treated by HCT is one of the largest and most detailed SCID cohorts reported to date.5,6 Our results confirm that OS was significantly higher after MSD HCT than with any other donor type.1,5,6 Furthermore, OS in this study compares favorably with earlier series. Several factors have likely played a role in the improved outcome, including amelioration of HLA-typing techniques and more effective strategies to prevent and treat infections and GvHD. We did not observe any difference in OS among the non-MSD alternative donor types, corroborating the results of Cavazzana-Calvo et al.11 Given the much higher survival with MSD HCT, we focused our MV analysis on non-MSD HCT to identify other factors affecting outcome.
With this large cohort and availability of genotypic data in 58% of subjects, we now demonstrate for the first time that the SCID genotype strongly influences survival and immune reconstitution in recipients of non-MSD HCT. We found that survival was significantly better in patients with RAG gene defects than in those with DCLRE1C gene defects. Because RAG and ARTEMIS deficiency are characterized by a T−B−NK+ phenotype, this difference in survival would have been missed if we had just analyzed survival by SCID phenotype, as has been done in previous studies.5,6 Among DCLRE1C-deficient patients, 64% of deaths were due to noninfectious causes compared with 9% in RAG-deficient patients, suggesting that the difference in survival may be related to increased sensitivity to alkylating chemotherapy in patients with DCLRE1C genotype, which is associated with a DNA-repair defect. Previous studies have shown that DCLRE1C-deficient patients have an increased risk for complications, such as cGvHD, autoimmunity, infections, short stature, dental abnormalities, and requirement for nutritional support.7,12,13 One study failed to detect a difference in OS between RAG- and DCLRE1C-mutated SCID patients,13 although the latter manifested an increased risk for late toxicity, in particular when alkylating agents were used for conditioning. OS in this study, compared with the other study,13 was similar for DCLRE1C-mutated patients who received non-MSD HCT but higher for RAG-mutated patients.
Our results showed a worse outcome following HCT for ADA-deficient patients. This analysis only included patients receiving HCT as the initial treatment and excluded patients receiving ERT prior to HCT, which might have lowered the incidence of infection at the time of HCT. Other possible reasons for the worse outcome observed in ADA-deficient patients include the metabolic nature of ADA deficiency, the existence of organ-specific extraimmune complications (eg, pulmonary alveolar proteinosis and neurodevelopmental abnormalities),14 and the ability of ADA-replete donor cells to cross-correct endogenous ADA-deficient lymphocytes, leading to higher rates of rejection in nonconditioned patients. We plan to evaluate the retrospective and prospective PIDTC ADA SCID cohort in a separate study that will include those treated with ERT and/or gene therapy and/or HCT.
The use of busulfan-based conditioning in non-MSD HCT for typical SCID remains controversial.15 Our MV analysis showed that, although the nature of the conditioning regimen (RIC/MAC vs No/IS) did not have a significant impact on OS, use of RIC/MAC regimens was associated with a lower risk for treatment failure and better T- and B-cell reconstitution than No/IS, confirming previous observations.1,15 However, RIC/MAC was associated with a higher risk for aGvHD than No/IS, and late effects of conditioning have not yet been analyzed in this cohort. These data emphasize the need for developing alternative less-toxic preparative regimens for all patients with SCID, in particular those with DCLRE1C and other radiation-sensitive defects.
In this study, which used criteria that clearly distinguish typical SCID (stratum A) from leaky SCID and Omenn syndrome (stratum B),2 we found that stratum assignment had no impact on survival, need for a second treatment, GvHD, or immune reconstitution. We observed the same outcome in our recent prospective study.16 This is in contrast to earlier studies from the European Inborn Errors Working Party Registry, which suggested that patients with “other T-cell deficiencies,” including Omenn syndrome and probably leaky SCID in some cases, had a worse outcome than patients with well-defined SCID.5,6
We found that conditioning regimen and genotype had a strong impact on T- and B-cell reconstitution after non-MSD HCT. In particular, genotypes associated with lack of B cells (RAG, DCLRE1C) or nonfunctional B cells (IL2RG/JAK3) were associated with a poorer B-cell reconstitution than genotypes associated with functional B cells (IL7R/CD3/CD45).15,17 Our study confirms that use of RIC and MAC regimens increased the independence from Ig replacement, likely by allowing the development of donor B-cell chimerism in patients with nonfunctional B cells.15,18-20 Consistent with previous reports,1,21 we observed that use of RIC/MAC was also associated with improved T-cell reconstitution. This may reflect stem cell engraftment with durable feeding of the thymic niche by lymphoid progenitor cells, resulting in a better thymic output assessed by T-cell receptor excision circles (TRECs)11 ,18 or by naive CD4+CD45RA+ T cells.7,21
Previous reports have shown that robust T-cell reconstitution was associated with better survival,7,22 that good T-cell reconstitution at 1 or 2 years post-HCT was associated with better T-cell reconstitution at the time of last follow-up,7,22 and that high TREC counts at 6 months were associated with good long-term T-cell reconstitution.23 Our large multicenter study has permitted us to confirm these initial single-center reports7,23 in a much larger cohort of patients. Importantly, we have also performed a landmark analysis assessing the impact of CD4+ and/or CD4+CD45RA+ T-cell counts at early time points after HCT on long-term survival and T-cell reconstitution. We now show that CD4+ cell counts as early as 6 and 12 months post-HCT are predictive of OS and long-term T-cell reconstitution. These data emphasize the importance of sequential assessments of immune reconstitution following HCT for SCID.24 Ongoing analyses may also ascertain whether these patients are differentially susceptible to late complications. These data raise the question of whether retransplantation, or other measures to enhance reconstitution, should be considered for patients with low CD4+ cell counts at 6 or 12 months post-HCT.
Finally, our data confirm that younger age and freedom from infection at the time of HCT are important factors for survival1,5,6,25,26 and that both are significantly associated with improved survival in non-MSD HCT, emphasizing the critical need for newborn screening, institution of appropriate isolation, infection prophylaxis, aggressive treatment of any infections pre-HCT, and prompt referral for HCT or GT after a diagnosis of SCID.
Our data showing that the genotype of SCID has a strong impact on many crucial outcomes after HCT emphasize the importance of developing patient-specific treatment strategies. Further, we demonstrate the prognostic significance of CD4 T-cell immune reconstitution as early as 6 months post-HCT. Additional studies need to be done to identify patient- and transplant-related factors that limit early immune reconstitution and to determine best interventions. In our future research, we aim to analyze the late effects of conditioning and quality of immune reconstitution long-term after HCT for SCID.
The online version of this article contains a data supplement.
The publication costs of this article were defrayed in part by page charge payment. Therefore, and solely to indicate this fact, this article is hereby marked “advertisement” in accordance with 18 USC section 1734.
Acknowledgments
The authors thank Kathie Beland for editorial assistance and gratefully acknowledge the pioneering work in SCID transplantation and the continuing wise counsel of Robertson Parkman.
This work was supported by the Division of Allergy, Immunology and Transplantation, National Institute of Allergy and Infectious Diseases (NIAID) and the Office of Rare Diseases Research (ORDR), National Center for Advancing Translational Sciences (NCATS), National Institutes of Health (NIH); Public Health Service grant/cooperative agreements U54-AI082973 (Principal Investigator [PI]: M.J.C.), U54-NS064808 and U01-TR001263 (PI: J. P. Krischer), and R13-AI094943 (M.J.C.); and the Division of Intramural Research, NIAID, NIH. The PIDTC is a part of the Rare Diseases Clinical Research Network of ORDR, NCATS. Collaborative work of the PIDTC with the Pediatric Blood and Marrow Transplant Consortium is supported by the U54 grants above, along with support from the Pediatric Blood and Marrow Transplant Consortium Operations Center by the St. Baldrick’s Foundation and grant/cooperative agreement U10HL069254 (PI: M.A.P.) from the National Heart, Lung and Blood Institute (NHLBI) and the National Cancer Institute (NCI), NIH. Collaborative work of the PIDTC with the Center for International Blood and Marrow Transplant Research is supported by grant/cooperative agreement U24-CA76518 (PI: M.M. Horowitz) from the NCI, NHLBI, and NIAID, NIH and grant/cooperative agreement U01HL069294 from the NHLBI and NCI, NIH; contracts HHSH250201200016C and HHSH234200637015C with the Health Resources and Services Administration/Department of Health and Human Services; and grants N00014-13-1-0039 and N00014-14-1-0028 from the Office of Naval Research.
L.M.G., an employee of Division of Allergy, Immunology, and Transplantation, NIAID, NIH, the funding source, also participated as a PIDTC study team member in the interpretation of data, writing of the manuscript, and decision to submit the manuscript for publication.
Authorship
Contribution: The eligibility review expert panel (E.H., R.H.B., M.J.C., C.C.D., T.A.F., L.M.G., D.B.K., L.D.N., R.J.O., S.-Y.P., J.M.P., and W.T.S.) reviewed each submitted case to assess eligibility criteria. The study was designed by R.J.O., R.H.B., M.J.C., T.A.F., B.R.L., L.M.G., L.D.N., E.H., D.B.K., S.-Y.P., J.M.P., and W.T.S.; data were gathered by H.A.-A., V.A., J.J.B, J.J.H.B., R.H.B., L.B., G.D.E.C., J. A. Connelly, J. A. Craddock, J.C., M.E.C., M.J.C., S.C., B.J.D.S., J.H.D., H.D., C.C.D., K.B.D., A.P.G., F.D.G., E.H., A.E.H., I.C.H., J.H., S.J., J.W.L., N.K., A.P.K., D.B.K., E.M.K., M.K., M.D.K., B.R.L., H.L.M., C.M., T.B.M., M.M., L.D.N., R.J.O., A.P., S.-Y.P., R.E.P., S.E.P., J.M.P., M.H.P., M.A.P., T.C.Q., C.M.S., D.C.S., E.S., P.S., T.N.S., W.T.S., S.S.-S., A.R.S., K.E.S., C.T., A.G.T., M.S.T., P.T., M.T.V.L., and L.C.Y.; B.R.L. and Z.Y. performed the biostatistic analysis of the data; and E.H., B.R.L., L.D.N., R.J.O., and M.J.C. wrote the first draft of the manuscript. All authors edited the manuscript and contributed to the subsequent versions.
Conflict-of-interest disclosure: The authors declare no competing financial interests.
Trudy N. Small died on 14 June 2013.
The content and opinions expressed are solely the responsibility of the authors and do not represent the official policy or position of the NIAID, ORDR, NCATS, NIH, Health Resources and Services Administration, or any other agency of the US government.
Correspondence: Elie Haddad, Department of Pediatrics, University of Montreal, Immunology Division, CHU Sainte-Justine, 3175 Cote Sainte-Catherine, H3T 1C5 Montreal, QC, Canada; e-mail: elie.haddad@umontreal.ca.

This feature is available to Subscribers Only
Sign In or Create an Account Close Modal