Key Points
DNA demethylation activates new and poised enhancers in AML that cause a leukemic transcriptome.
Only a subset of DNA demethylated enhancers becomes activated. A specific additional activation step is required for enhancer activation.
Abstract
Acute myeloid leukemia (AML) is characterized by an impaired differentiation process leading to an accumulation of immature blasts in the blood. One feature of cytogenetically normal AML is alterations to the DNA methylome. We analyzed 57 AML patients with normal karyotype by using Illumina’s 450k array and showed that aberrant DNA methylation is significantly altered at enhancer regions and that the methylation levels at specific enhancers predict overall survival of AML patients. The majority of sites that become differentially methylated in AML occur in regulatory elements of the human genome. Hypermethylation associates with enhancer silencing. In addition, chromatin immunoprecipitation sequencing analyses showed that a subset of hypomethylated sites correlate with enhancer activation, indicated by increased H3K27 acetylation. DNA hypomethylation is therefore not sufficient for enhancer activation. Some sites of hypomethylation occur at weak/poised enhancers marked with H3K4 monomethylation in hematopoietic progenitor cells. Other hypomethylated regions occur at sites inactive in progenitors and reflect the de novo acquisition of AML-specific enhancers. Altered enhancer dynamics are reflected in the gene expression of enhancer target genes, including genes involved in oncogenesis and blood cell development. This study demonstrates that histone variants and different histone modifications interact with aberrant DNA methylation and cause perturbed enhancer activity in cytogenetically normal AML that contributes to a leukemic transcriptome.
Introduction
Acute myeloid leukemia (AML) is characterized by clonal expansion of immature myeloid cells and impairment of normal blood development.1 Pathogenesis in AML involves a number of distinct genetic and epigenetic events that disrupt the normal regulatory mechanisms that operate during blood cell differentiation.2-5 Cytogenetically normal AML (CN-AML) refers to the absence of chromosomal abnormalities that define other specific AML subtypes.6 Instead, CN-AML patients are associated with different somatic mutations, for example, of genes that are involved in epigenetic regulation such as DNMT3A, IDH1, IDH2, and TET2.4,7
The methylation of the DNA at cytosine-guanine dinucleotides (CpGs) occurs in cell- and context-specific patterns.8 CpG-rich regions (CpG islands [CGIs]) are frequently found at transcription start sites (TSSs) and are predominantly unmethylated in contrast to the majority of CpGs in the genome, which are methylated.8 Intragenic and intergenic hypomethylated regions are associated with enhancers.9,10 During normal granulopoesis, differential DNA methylation between progenitors and mature cells occurs at enhancer regions, which become hypomethylated in mature cells.
Differentially methylated CpGs (DMCs) observed in cancer frequently occur in TSS proximal promoter regions.11 We hypothesized that TSS distal DMCs are likely to coincide with enhancers. Our study confirms that the DNA methylation profiles of CN-AML patients share a number of common aberrantly methylated regions in addition to a subset of mutation-specific changes.4,12-14 The majority of sites of hypermethylation occur at active promoters or enhancers, which become silenced in CN-AML. Only certain subsets of the hypomethylated enhancers are activated. These changes correlate with altered gene expression of the enhancer target genes in CN-AML, demonstrating the epigenetic rewiring of the enhancer landscape in CN-AML.
Materials and methods
A flowchart of the analyzed pipeline is shown in supplemental Figure 1, available on the Blood Web site.
Bone marrow samples from patients and healthy donors
Bone marrow samples from 57 CN-AML patients were obtained at diagnosis after informed consent and in accordance to the declaration of Helsinki (supplemental Table 1) and from 3 healthy donors.15,16 The research was approved by the ethical committee in Stockholm, Sweden. Genomic characterization by mutational analysis was performed as previously described.15,16
DNA methylation analysis
Genome-wide DNA methylation levels were detected by Illumina’s Human Methylation 450k Array. Genomic DNA samples were extracted and used as previously described.15,16 A cohort from The Cancer Genome Atlas was used for validation.4 For further information, including correlation with overall survival and pyrosequencing validation, see supplemental Data.
Transcription factor binding motif predictions
Transcription factor binding enrichment of previously identified motifs was predicted by the Hypergeometric Optimization of Motif Enrichment (HOMER) suite of tools.17 Enrichment analysis was verified according to program instructions by using the Kolmogorov-Smirnov test (K-S test). Total cap analysis of gene expression (CAGE) enhancers were used as the background in all analyses.
ChIP-seq
Chromatin immunoprecipitation (ChIP) was performed according to the manufacturer’s instructions (Diagenode iDeal ChIP-seq Kit for histones) and sequenced on a HiSequation 2500 System (Illumina). For information concerning the analyses, see supplemental Data.
Transcriptomic profiling by next-generation sequencing
To profile the transcriptomes, RNA from the mononuclear cells of 7 CN-AML patients (included in the Illumina 450k array cohort) and CD34+ cells from 5 normal healthy donors were included in this study. Fold change of each gene was computed (see supplemental Data), and genes among differentially methylated enhancer putative targets were selected and aligned to H3K27ac levels at their regions.
CRISPR/Cas9-introduced enhancer deletions
The AML cell line KG1a was used to introduce selected genomic deletions of differentially methylated enhancers by the clustered regularly interspaced short palindromic repeats (CRISPR)/Cas9 system (see supplemental Data). Moderated Student t test was used to determine statistical significance of gene expression.
Results
DNA methylation changes in CN-AML
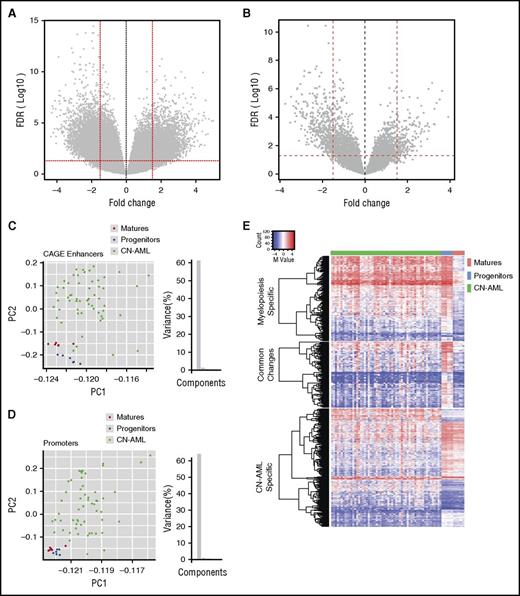
We re-analyzed our previously published data set from normal myelopoiesis, consisting of 4 different myeloid cell populations—common myeloid progenitors (CMPs), granulocyte-macrophage progenitors (GMPs), promyelocytes/myelocytes (PMCs), and mature polymorphonuclear (PMN) cells isolated from healthy human donors.16 We confirmed that the main changes in DNA methylation occur between GMPs and PMCs, as previously reported (supplemental Figure 2A-C).16 The two progenitor populations (CMPs and GMPs) show very similar DNA methylation patterns, with very few differentially methylated CpG sites (DMCs) (supplemental Figure 2A). Consequently, comparing DNA methylation in CN-AML to either CMPs or GMPs showed very similar results (supplemental Figure 2D-E). On the basis of these observations, we subsequently combined myeloid progenitors (CMPs and GMPs) into 1 group and differentiated myeloid cells (PMCs and PMN cells) into another group for all other analyses. We found 3562 statistically significant DMCs between CMPs and GMPs and between PMCs and PMN cells, of which 99.2% of the sites became hypomethylated during differentiation to PMCs (supplemental Figure 2F). To identify aberrant methylation in a CN-AML patient cohort (supplemental Table 1),15 we compared blasts from CN-AML patients with normal progenitor cells (combined CMP and GMP data sets) and found 13 448 DMCs, of which 6607 (49.1%) were hypermethylated (Figure 1A). The DMCs were significantly (χ2P = 8.69e-127) enriched for enhancers in the Illumina 450k array annotation, prompting further investigation.
Enhancer DNA methylation distinguishes CN-AML from granulocytes and progenitor cells. (A) Volcano plots showing DNA methylation in CN-AML relative to normal bone marrow (NBM). Of 13 448 DMCs, 6607 (49.1%) display hypermethylation. (B) DNA methylation profile of CN-AML relative to NBM at CAGE enhancers, 446 (70%) of 632 DMCs are hypermethylated. Dots represent methylation levels of individual probes in the Illumina 450k array. Y-axis indicates the odds ratio of –log10 false discovery rate (FDR); X-axis shows the fold change of the methylation value (M-value). Statistical significance cutoffs are marked with red dashed lines (FDR <0.05; FC >1.5). (C) Principal component analysis (PCA) of CN-AML, normal progenitor cells, and mature cells at CAGE enhancers. (D) PCA of TSS and promoter-associated probes. Enhancer probes (8202) are annotated to CAGE enhancers defined by the FANTOM Consortium, whereas probes located within 2000 bp upstream of TSS regions are included as promoter probes (117 789). Mature myeloid cells (PMCs, PMN cells) are shown as red dots, progenitors (CMPs, GMPs) are shown as blue dots, and CN-AML patients are shown as green dots. (E) Heat map and hierarchical clustering of enhancer DMCs of CN-AML, progenitors, and mature myeloid cells. Enhancer DMCs have been defined by pairwise comparison and clustered for all tested samples with supervised categories. M-value of each of the DMC probes is color-coded in the heat map from low (blue) to high (red). PC1, principal component 1; PC2, principal component 2.
Enhancer DNA methylation distinguishes CN-AML from granulocytes and progenitor cells. (A) Volcano plots showing DNA methylation in CN-AML relative to normal bone marrow (NBM). Of 13 448 DMCs, 6607 (49.1%) display hypermethylation. (B) DNA methylation profile of CN-AML relative to NBM at CAGE enhancers, 446 (70%) of 632 DMCs are hypermethylated. Dots represent methylation levels of individual probes in the Illumina 450k array. Y-axis indicates the odds ratio of –log10 false discovery rate (FDR); X-axis shows the fold change of the methylation value (M-value). Statistical significance cutoffs are marked with red dashed lines (FDR <0.05; FC >1.5). (C) Principal component analysis (PCA) of CN-AML, normal progenitor cells, and mature cells at CAGE enhancers. (D) PCA of TSS and promoter-associated probes. Enhancer probes (8202) are annotated to CAGE enhancers defined by the FANTOM Consortium, whereas probes located within 2000 bp upstream of TSS regions are included as promoter probes (117 789). Mature myeloid cells (PMCs, PMN cells) are shown as red dots, progenitors (CMPs, GMPs) are shown as blue dots, and CN-AML patients are shown as green dots. (E) Heat map and hierarchical clustering of enhancer DMCs of CN-AML, progenitors, and mature myeloid cells. Enhancer DMCs have been defined by pairwise comparison and clustered for all tested samples with supervised categories. M-value of each of the DMC probes is color-coded in the heat map from low (blue) to high (red). PC1, principal component 1; PC2, principal component 2.
Recently, the Functional Annotation of Mammalian Genome (FANTOM) Consortium mapped robust enhancers in the human genome by detecting enhancer transcription using CAGE technology.18 We used the FANTOM atlas of total CAGE-defined enhancers to study aberrant DNA methylation in enhancer regions in CN-AML cells relative to progenitors and differentiated myeloid cells. From a total of 43 011 CAGE enhancers, we identified a subset of 8202 autosomal 450k probes corresponding to 5644 CAGE enhancer regions. Of those, we found 632 CN-AML DMCs in 563 CAGE enhancers. The closest neighboring cytosine to a DMC in CAGE enhancers displays the same methylation trend as the DMC, whereas the differences decline dramatically according to the distance to enhancer DMCs, which suggests that hypo- or hypermethylation is enhancer specific (supplemental Figure 3). The majority of those differentially methylated enhancers were hypomethylated in AML (446 [70%] of 632 DMCs) (Figure 1B).
DNA methylation levels of 5 selected CAGE enhancers associated with 6 DMCs were validated by pyrosequencing in 8 CN-AML (4 included in the 450k cohort and 4 additional) and 5 normal bone marrow CD34+ samples (supplemental Table 2; supplemental Figure 4). As we showed previously, the heterogeneity of the methylation pattern among different individuals is low for normal CD34+ cells compared with the pronounced heterogeneity seen among CN-AML samples.15 Principal component analysis of DNA methylation profiles clearly distinguished CN-AML blast cells from myeloid progenitor cells and differentiated myeloid cells (Figure 1C). Despite the fact that the number of enhancer-annotated 450k probes (8202) was far fewer than the number of promoter-annotated probes (within 2 kb of a TSS) (117 789 probes), the enhancer-located probes distinguished the different cell types as well as TSS- and/or promoter-located probes (Figure 1D).
Because aberrant methylation of AML blasts could reflect DNA methylation changes that occur during normal hematopoiesis, we examined whether changes in AML were leukemia-specific or overlapping with changes that occur during differentiation. Thus, we compared DNA methylation at CAGE enhancers that change DNA methylation either between CN-AML and CMPs/GMPs or at any step during normal myelopoiesis. We found 338 DMCs in 311 CAGE enhancers that changed during normal myelopoiesis, and 632 DMCs in 563 CAGE enhancers that changed between CN-AML and CMPs/GMPs (Figure 1E). DMCs in more mature PMCs/PMN cells were mostly hypomethylated compared with CMPs/GMPs (331 of 338). There were 144 DMCs in 132 CAGE enhancers that were common to both CN-AML and myelopoiesis showing DNA methylation changes in the same direction (42.6% of myelopoiesis DMCs and 22.7% of CN-AML DMCs) (Figure 1E).
Thus, for a subset of DMCs in CN-AML, DNA methylation changes are similar to what occurs during neutrophil differentiation, namely hypomethylation of regions relative to CD34+ cells. However, the larger proportion of DMCs in CAGE enhancers represent leukemia-specific changes in CN-AML, representing events that do not occur during normal differentiation. In addition, another subset of sites that change during myelopoiesis does not change in CN-AML. Ultimately, changes in DNA methylation in the CN-AML epigenome are not simply related to the normal differentiation process but form a complex profile with some regions that change during differentiation, others specifically retaining the DNA methylation status of the parental epigenome, and still others acting as cancer-specific epimutations. The aberrant DNA methylation pattern in CN-AML was validated in an independent CN-AML cohort obtained from The Cancer Genome Atlas network (supplemental Figure 5).4 Moreover, different AML subtypes with certain cytogenetic abnormalities such as inv(16), t(15:17), t(8:21), or complex karyotype form small clusters, which suggests that different CAGE-enhancer methylation profiles may present in different patient groups (supplemental Figure 5). Interestingly, the hypo- and hypermethylated enhancers showed distinct enrichment of transcription factor motifs (supplemental Table 3). The hypomethylated enhancers are enriched for the AP-1 motif, which was previously shown to be common in enhancers18 and binding motifs for the myeloid transcription factors RUNX1 and PU.1. Moreover, such sites contain bona fide AP-1 binding sites as determined by the ENCODE (Encyclopedia of DNA Elements) Consortium in commonly used cell lines and PU.1 binding sites from blood cell types (Gene Expression Omnibus [GEO] accession numbers GSM486702, GSM486709, GSM486708, and GSM772870) (supplemental Figure 6). In addition, empirically determined AP-1 and PU.1 binding sites were specifically enriched in TSS distal hypomethylated regions (supplemental Figure 6).
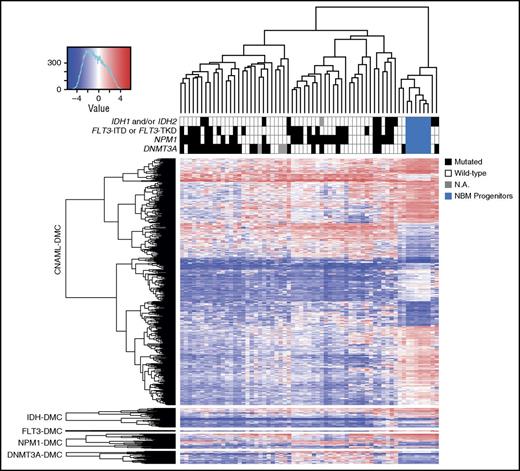
We then examined whether genetic mutations of DNMT3A, IDH, NPM1, and FLT3 internal tandem duplications/tyrosine kinase domains (ITDs/TKDs) influenced DNA methylation signatures at CAGE enhancers. The majority of changes in DNA methylation occurred in a mutation-independent manner and are common among all genotypes (Figure 2; supplemental Figure 7). However, some mutation-specific DMCs exist. A general hypomethylated CAGE-enhancer profile was identified in DNMT3A-mutated patients, but with few significant DMCs and with a trend toward underrepresentation of DNMT3A mutation–dependent enhancer DMCs (hypogeometric test P = .09) (supplemental Figure 8A-B). Mutations of IDH1 and/or IDH2 were associated with a hypermethylated profile (supplemental Figure 8C-D). Patients with NPM1 mutations showed both hypomethylation and hypermethylation in different subsets of CAGE enhancers (supplemental Figure 8E-F), and FLT3-ITD/TKD mutations resulted in significant methylation changes in only 3 CAGE enhancer probes. Ultimately, a large proportion of sites showed CN-AML–specific methylation patterns in CAGE enhancers regardless of mutational differences among patients. This suggests that the aberrant enhancer epigenetic landscape in CN-AML is generally defined by factors other than different somatic mutations. However, we cannot exclude that other somatic mutations may have a more specific impact on aberrant DNA methylation at enhancer regions.
The majority of enhancer DMCs are independent of somatic mutations. DMCs have been tested by comparing either the total CN-AML cohort to normal bone marrow (NBM) progenitors or mutated vs wild-type CN-AML patients. Supervised hierarchical clustering was performed on enhancer DMCs (in rows), whereas individual samples were clustered unsupervised (in columns). Each mutation has been tested separately among CN-AML patients, and the heat map shows mutation-related enhancer DMCs as being mutually exclusive from enhancer DMCs of general CN-AML. The color key provides the mutational status of each patient. M-value of each DMC probe is color-coded for density (blue to red). N.A., not analyzed.
The majority of enhancer DMCs are independent of somatic mutations. DMCs have been tested by comparing either the total CN-AML cohort to normal bone marrow (NBM) progenitors or mutated vs wild-type CN-AML patients. Supervised hierarchical clustering was performed on enhancer DMCs (in rows), whereas individual samples were clustered unsupervised (in columns). Each mutation has been tested separately among CN-AML patients, and the heat map shows mutation-related enhancer DMCs as being mutually exclusive from enhancer DMCs of general CN-AML. The color key provides the mutational status of each patient. M-value of each DMC probe is color-coded for density (blue to red). N.A., not analyzed.
The majority of DMCs in CN-AML occur within DNase-hypersensitive sites
In our cohort, 57% of the hypermethylated and 32% of the hypomethylated DMCs occurred within 2.5 kb of an annotated TSS. Such events are frequently associated with promoter silencing or activation, respectively. We hypothesized that the majority of DMCs distal to TSSs reflect the differential activity of regulatory regions, such as enhancers. Because CAGE enhancers represent only high-confidence enhancers, we used ChIP sequencing (ChIP-seq) for enhancer-associated histone marks and DNase sequencing (DNase-seq) for genome-wide analysis. We divided the DMCs into TSS proximal (± 2.5 kb) and TSS distal for further analyses (supplemental Figure 9A).
Both hypermethylated and hypomethylated DMCs display distinct patterns in relation to both their proximity to TSSs and CpG density (CGI or not CGI). The majority (57%) of hypermethylated probes were TSS proximal occurring within 2.5 kb of an annotated TSS (supplemental Figure 10A). In contrast, the majority of the hypomethylated sites occurred outside TSS proximal regions (68%) (supplemental Figure 10A). Among the hypermethylated DMCs, 30% of TSS distal and 50% of TSS proximal DMCs occurred within CGIs. For hypomethylated sites, only 6% of TSS distal and 10% of TSS proximal DMCs were found to be in CGIs (supplemental Figure 10B). The percentage of TSS distal DMCs in gene bodies was 63% of hypermethylated sites and 68% of hypomethylated sites.
Genomic regulatory elements are characterized by chromatin accessibility, which can be detected by using DNase-seq to analyze DNase hypersensitivity sites (DHSs). The ENCODE Consortium has mapped DHSs in 119 cell types derived from distinct tissues that we used in our analyses.10 As expected, the majority of TSS proximal DMCs localize within approximately 1 nucleosome distance (200 bp) from a DHS (86% of hypermethylated DMCs and 80% of hypomethylated DMCs [supplemental Figure 9B]). In addition, the majority of TSS distal DMCs also fall within 200 bp of a DHS, with 81% of hypermethylated DMCs and 71% of hypomethylated DMCs occurring in or directly adjacent to a DHS (supplemental Figure 9B). This was not a general bias in cytosines represented in the 450k array because only 26% of the total 450k array probes occurred within 200 bp of a DHS as did 19% of 480 000 randomly generated probes. This provided strong evidence that aberrant DNA methylation in AML reflects the differential activity of regulatory elements, including TSS proximal promoter sites and TSS distal enhancers or insulators. However, the activity of DHS-defined regulatory regions needs to be further proven by, for example, enrichment of activating histone marks such as H3K27ac.
Because regulatory regions defined by DHSs are cell type–specific, we examined the relationship between DMCs and DHSs more closely in relation to CD34+ progenitor cells, which represent the parental epigenome of AML blasts. We defined 3 categories of chromatin accessibility: inaccessible with or without background DNase-seq reads, intermediate accessibility, and highly accessible regions (supplemental Figure 11). We classified DMCs as inaccessible, intermediately accessible, or highly accessible in the CD34+ progenitor epigenome. The majority of hypermethylated and hypomethylated TSS proximal and TSS distal DMCs occurred in regions that are accessible in the CD34+ epigenome (supplemental Figure 9C-D). Interestingly, at TSS distal regions, 41% of hypermethylated sites occurred in highly accessible regions compared with only 16% of hypomethylated sites. In contrast, 36% of hypomethylated TSS distal DMCs occurred in inaccessible regions compared with 14% of hypermethylated TSS distal DMCs. This was consistent with the idea that a proportion of hypermethylated cytosines in CN-AML could represent inactivation of active CD34+ cell enhancers whereas hypomethylated sites could represent the formation of enhancers at loci that are not usually active.
AML-specific hypermethylation correlates with reduced chromatin accessibility and reduced active histone marks at both promoters and enhancers
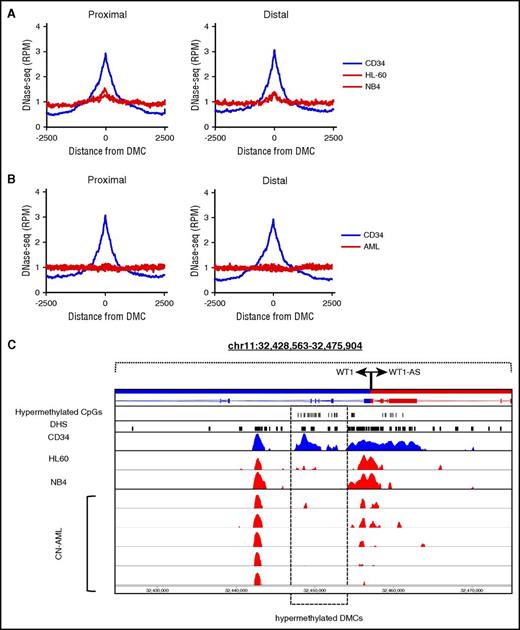
We hypothesized that differential DNA methylation is associated with altered enhancer activation and silencing. To test whether hypermethylation is associated with inactivation or silencing of promoters or enhancers, we examined chromatin status at DMCs. We found that the DNA methylation profiles of the AML cell lines NB4 and HL-60, but not other commonly used cell lines, clustered together with our own clinical CN-AML samples (supplemental Figure 12), validating NB4 and HL-60 cell lines as useful models for studying chromatin and DNA methylation in CN-AML. At hypermethylated TSS proximal and TSS distal DMCs, chromatin accessibility was reduced in NB4 and HL-60 cells relative to CD34+ cells (Figure 3A). Findings were similar in an independent cohort of CN-AML (n = 5)19 samples in which reduced chromatin accessibility was observed in the same type of hypermethylated sites (Figure 3B). We have previously shown that one of the most significantly hypermethylated regions in the CN-AML genome is localized within the WT1 gene that is commonly overexpressed in many types of cancer including AML.15 Interestingly, this region overlaps with an intragenic DHS that, when hypermethylated, becomes inaccessible in AML cell lines and CN-AML patients (Figure 3C).
Chromatin accessibility is reduced at hypermethylated sites. (A) Chromatin accessibility measured by DNase-seq across hypermethylated TSS proximal and TSS distal DMCs in CD34+ cells (blue) and the AML cell lines HL-60 and NB4 (red). (B) Chromatin accessibility across hypermethylated sites in CD34+ cells (blue) and CN-AML patients (red). (C) An example of a silenced DHS in the WT1 gene body, which is accessible in CD34+ cells (blue) and inaccessible in HL-60, NB4, and CN-AML patients (red). RPM, reads per million.
Chromatin accessibility is reduced at hypermethylated sites. (A) Chromatin accessibility measured by DNase-seq across hypermethylated TSS proximal and TSS distal DMCs in CD34+ cells (blue) and the AML cell lines HL-60 and NB4 (red). (B) Chromatin accessibility across hypermethylated sites in CD34+ cells (blue) and CN-AML patients (red). (C) An example of a silenced DHS in the WT1 gene body, which is accessible in CD34+ cells (blue) and inaccessible in HL-60, NB4, and CN-AML patients (red). RPM, reads per million.
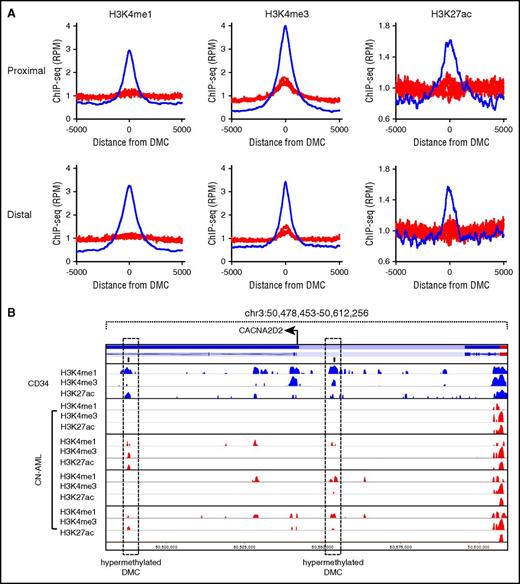
To better understand how methylation influences the chromatin structure, we performed ChIP-seq for active histone marks H3K4me1, H3K4me3, and H3K27ac in 4 CN-AML patients. At both TSS proximal and TSS distal hypermethylated DMCs, a reduction was observed in the active histone marks H3K4me1, H3K4me3, and H3K27ac (Figure 4A). This included promoters and enhancers active in normal CD34+ cells that were silenced in the leukemic epigenome (Figure 4B).
Loss of active histone marks at hypermethylated sites. (A) Hypermethylated DMCs show reduced enrichment of active marks H3K4me1, H3K4me3, and H3K27ac in AML (red) at both TSS proximal and TSS distal DMCs relative to CD34+ cells (blue). (B) Hypermethylated TSS distal DMCs within and adjacent to the CACNA2D2 gene locus. Loss of H3K4 methylation and H3K27 acetylation is observed in AML samples at the sites of hypermethylation.
Loss of active histone marks at hypermethylated sites. (A) Hypermethylated DMCs show reduced enrichment of active marks H3K4me1, H3K4me3, and H3K27ac in AML (red) at both TSS proximal and TSS distal DMCs relative to CD34+ cells (blue). (B) Hypermethylated TSS distal DMCs within and adjacent to the CACNA2D2 gene locus. Loss of H3K4 methylation and H3K27 acetylation is observed in AML samples at the sites of hypermethylation.
A subset of AML-specific hypomethylated DMCs is associated with enhancer activation
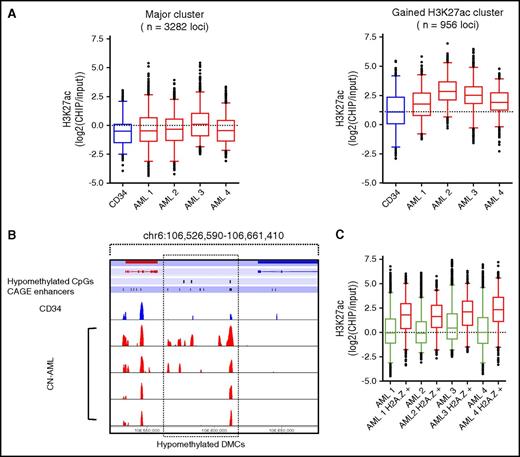
We did not observe a generally increased H3K27ac level at hypomethylated sites (supplemental Figure 13). However, hierarchical clustering revealed a subset of sites (n = 1170; 28% of hypomethylated sites) that showed increased chromatin accessibility in NB4 and HL-60 relative to CD34+ progenitors (supplemental Figure 14). Similarly, hierarchical clustering using H3K27ac ChIP-seq data in CN-AML patients showed that a subset of hypomethylated sites had an increase in active histone marks (n = 956 [23%]) whereas the majority of TSS distal DMCs showed no increase in active histone marks (n = 3282 [77%]) relative to CD34+ cells (Figure 5A-B). These data suggest that DNA hypomethylation alone is not sufficient for enhancer activation. Because previous studies have suggested that incorporation of H2A.Z may be an essential step in promoter activation induced by DNA demethylation,20 we examined activation of hypomethylated sites using H2A.Z ChIP-seq data from the same CN-AML cohort (n = 4). Indeed, we found that sites containing H2A.Z in CN-AML had increased H3K27ac relative to hypomethylated regions in which H2A.Z was absent (Figure 5C).
Activation of a subset of hypomethylated TSS distal DMCs in CN-AML patients. (A) Hierarchical clustering of hypomethylated TSS distal DMCs for H3K27ac revealed 2 distinct clusters showing either no activation (n = 3282) or a gain of histone acetylation (n = 956) in AML patients. (B) TSS distal DMCs overlapping with enhancers showing increased H3K27ac in AML. (C) H3K27ac at TSS distal hypomethylated DMCs not overlapping H2A.Z ChIP-seq peaks (green) or overlapping H2A.Z peaks (red).
Activation of a subset of hypomethylated TSS distal DMCs in CN-AML patients. (A) Hierarchical clustering of hypomethylated TSS distal DMCs for H3K27ac revealed 2 distinct clusters showing either no activation (n = 3282) or a gain of histone acetylation (n = 956) in AML patients. (B) TSS distal DMCs overlapping with enhancers showing increased H3K27ac in AML. (C) H3K27ac at TSS distal hypomethylated DMCs not overlapping H2A.Z ChIP-seq peaks (green) or overlapping H2A.Z peaks (red).
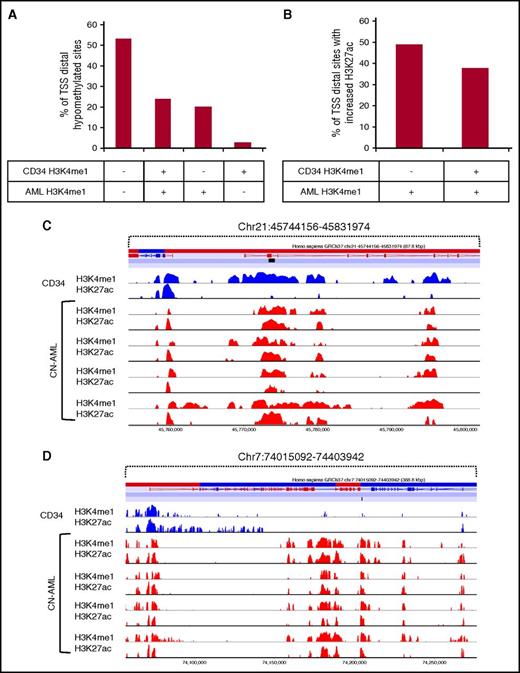
To study enhancer activation at hypomethylated DMCs in more detail, we examined which DMCs occurred within regions marked by H3K4me1 in the CD34+ progenitor and CN-AML epigenomes. Of 4789 hypomethylated CN-AML–specific TSS distal DMCs, 1155 (24.0%) occurred in a region associated with H3K4me1 in both the CD34+ and AML epigenomes, whereas 962 DMCs (20.0%) occurred in regions that gain H3K4me1 in CN-AML (Figure 6A). To examine whether the enhancers that lack H3K4me1 in CD34+ cells but gain H3K4me1 in CN-AML are active and whether enhancers in normal CD34+ cells were associated with increased activity, we examined the fold change of H3K27. We identified enhancers that showed increased H3K27ac, which was defined as 1 log2-fold higher average H3K27ac signal in CN-AML samples relative to CD34+ cells. We found that 48.9% of the hypomethylated DMCs that occurred in CN-AML gained H3K27ac whereas 37.7% of DMCs occurring within CD34/AML H3K4me1 poised enhancer regions showed increased H3K27ac (Figure 6B). To conclude, hypomethylated TSS distal DMCs occur in regions that are inactive and remain inactive, poised in CD34+ cells and activated in CN-AML, or are de novo CN-AML enhancers that have been established specifically in the CN-AML epigenome (Figure 6C-D).
TSS distal hypomethylation and enhancer activation occurs at both CD34+poised enhancers and de novo CN-AML enhancers. (A) Identification of hypomethylated TSS distal DMCs occurring in H3K4me1 ChIP-seq peaks from the epigenome of CD34+ cells, CN-AML samples, or both. (B) The percentage of H3K4me1-positive hypomethylated TSS distal DMCs displaying increased average H3K27ac ChIP-seq signals in CN-AML relative to CD34+ cells. (C) Example of a poised CD34+ enhancer region that becomes activated in association with increased H3K27ac. (D) A de novo established AML-specific enhancer in the AML epigenome at a hypomethylated TSS distal DMC showing gain of H3K4me1 and H3K27ac.
TSS distal hypomethylation and enhancer activation occurs at both CD34+poised enhancers and de novo CN-AML enhancers. (A) Identification of hypomethylated TSS distal DMCs occurring in H3K4me1 ChIP-seq peaks from the epigenome of CD34+ cells, CN-AML samples, or both. (B) The percentage of H3K4me1-positive hypomethylated TSS distal DMCs displaying increased average H3K27ac ChIP-seq signals in CN-AML relative to CD34+ cells. (C) Example of a poised CD34+ enhancer region that becomes activated in association with increased H3K27ac. (D) A de novo established AML-specific enhancer in the AML epigenome at a hypomethylated TSS distal DMC showing gain of H3K4me1 and H3K27ac.
Target gene expression of aberrantly methylated enhancers
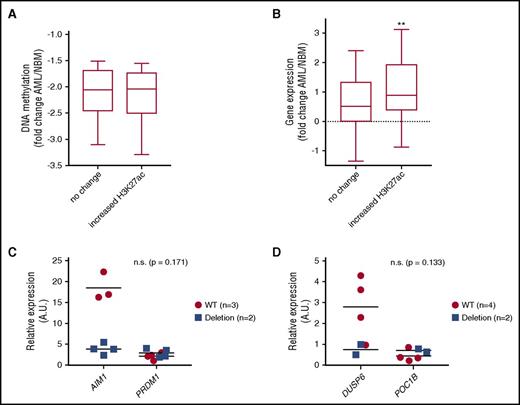
To study the effect of differentially methylated enhancers on target gene transcription, we determined the number of enhancer-TSS pairs reported by the FANTOM Consortium (25 719) that are represented on Illumina 450k array. We identified 3911 enhancer-TSS pairs targeting 2456 genes/transcripts. Among hypermethylated enhancers in CN-AML, 320 enhancer-TSS pairs (151 enhancers associated with 255 genes/transcripts) were identified; among hypomethylated enhancers, 126 enhancer-TSS pairs (71 differential methylated [DM] enhancers targeting 108 genes/transcripts) were identified (supplemental Table 4). Gene ontology and Kyoto Encyclopedia of Genes and Genomes pathway analysis by using Database for Annotation, Visualization and Integrated Discovery (DAVID) tools (https://david.ncifcrf.gov) showed these putative target genes to be enriched for pathways related to hematopoiesis and cancer pathways as well as to immune response and signaling pathways such as Wnt, MAPK, and Toll-like receptor signaling (supplemental Table 5). This suggests that enhancers regulating hematopoiesis and leukemogenesis are targeted by differential methylation in AML. We correlated the AML-specific differential methylated enhancers with H3K27ac levels and putative target gene expression changes in AML patients compared with normal CD34+ cells. Enhancer target gene expression was analyzed by RNA sequencing in 7 AML patients and in CD34+ cells isolated from 5 healthy donors. In total, 135 DM enhancer-TSS pairs (96 CAGE enhancers associated with 92 genes) covered by 105 DMCs were defined in the CN-AML group. The H3K27ac status at these DM-enhancer regions was analyzed and compared among AML patients and normal CD34+ cells. The decrease in DNA methylation was similar between hypomethylated enhancer subgroups with and without changes in H3K27ac (Figure 7A). Gain of H3K27ac was associated with higher expression of the putative target genes in AML cells compared with normal CD34+ cells (P < .01; Figure 7B). The enhanced target gene expression suggests an increased enhancer activity in the hypomethylated enhancer subset with increased H3K27ac levels. Motif analysis of those enhancers with increased H3K27ac levels revealed a robust enrichment of myeloid trasnscription factor (TF) motifs such as the PU.1-IRF motif (presents in 59 of 101 enhancers; K-S test P < 10−15) (supplemental Table 6).
Enhancer hypomethylation and activation is associated with increased target gene expression in CN-AML patients. (A) DNA methylation fold change between progenitors and CN-AML at hypomethylated CAGE enhancers that show no change or gain H3K27ac. (B) Gene expression of enhancer target genes in CN-AML relative to NBM shows increased expression relative to NBM. This increased expression is significantly greater at target genes of hypomethylated enhancers that show increased H3K27ac (Student t test P ≤ .01). (C-D) CRISPR-cas9 deletion of 2 candidate enhancers showing reduced trend of target gene expression in homozygous deletion clones (blue squares) relative to wild-type clones (red circles) of target genes in KG1a cells. A.U., arbitrary unit; n.s., not significant; WT, wild-type.
Enhancer hypomethylation and activation is associated with increased target gene expression in CN-AML patients. (A) DNA methylation fold change between progenitors and CN-AML at hypomethylated CAGE enhancers that show no change or gain H3K27ac. (B) Gene expression of enhancer target genes in CN-AML relative to NBM shows increased expression relative to NBM. This increased expression is significantly greater at target genes of hypomethylated enhancers that show increased H3K27ac (Student t test P ≤ .01). (C-D) CRISPR-cas9 deletion of 2 candidate enhancers showing reduced trend of target gene expression in homozygous deletion clones (blue squares) relative to wild-type clones (red circles) of target genes in KG1a cells. A.U., arbitrary unit; n.s., not significant; WT, wild-type.
To further validate the relation between differentially methylated enhancers and change in target gene expression, we deleted 2 enhancers that were hypomethylated in CN-AML in the undifferentiated AML cell line KG1a with CRISPR-Cas9 methodology. Three to 4 monoclonal subclones with enhancer deletion were analyzed for each enhancer. Each of the 2 deleted enhancers had 2 potential target genes, of which 1 gene for each enhancer showed reduced expression upon enhancer deletion (Figure 7C-D).
Differential methylation of CAGE enhancers correlates with patient clinical outcome
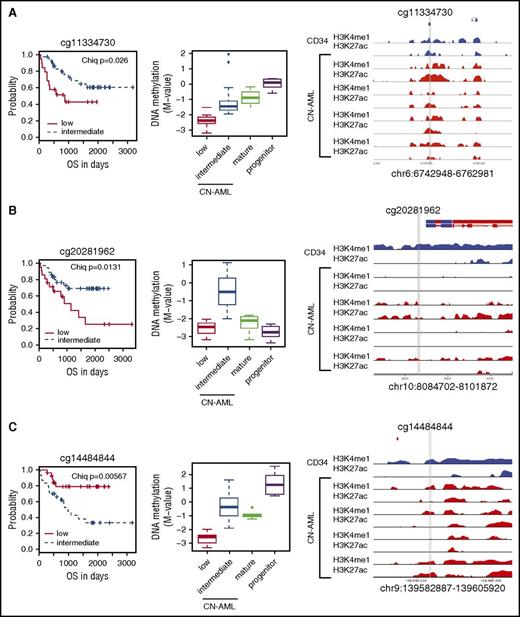
To determine whether any of the DM enhancers correlate with survival of CN-AML patients, we classified the methylation level of CN-AML–specific DMCs into 3 categories—low, β ≤0.2; intermediate, 0.2  0.8; high, β ≥0.8–and correlated that to overall survival. In total, the methylation levels of 8 DM enhancers were identified to have prognostic significance among the CN-AML patients by using a log-rank test that compared survival experiences among subcategorized CN-AML patients (Figure 8A-C; supplemental Figure 15). Hypo- or hypermethylation correlated with better prognosis in an enhancer-specific manner. Interestingly, the activity of the prognostic enhancers varied among AML patients, judging by the level of H3K4me1 and H3K27ac (Figure 8A-C; supplemental Figure 13), indicating that the prognostic enhancers may play a role in leukemogenesis.
DNA methylation at CAGE enhancers is correlated with survival in CN-AML. (A-C) Variably methylated CpG probes (A) cg11334730, (B) cg20281962, and (C) cg14484844) that occur in CAGE enhancer regions in CN-AML patients. Each example showing (from left to right) Kaplan-Meier curves, DNA methylation plots, and active histone mark ChIP-seq profiles for 1 normal CD34+ and 4 independent CN-AML patients. CN-AML patients were categorized into low (β <0.2), intermediate (0.2 < β<0.8), or high (β >0.8) DNA methylation subcategories. Statistical significance was determined by using the log-rank test. DNA methylation levels are plotted against mature and progenitor cells. Active histone marks are displayed for the surrounding area for each probe marked with a gray vertical line.
DNA methylation at CAGE enhancers is correlated with survival in CN-AML. (A-C) Variably methylated CpG probes (A) cg11334730, (B) cg20281962, and (C) cg14484844) that occur in CAGE enhancer regions in CN-AML patients. Each example showing (from left to right) Kaplan-Meier curves, DNA methylation plots, and active histone mark ChIP-seq profiles for 1 normal CD34+ and 4 independent CN-AML patients. CN-AML patients were categorized into low (β <0.2), intermediate (0.2 < β<0.8), or high (β >0.8) DNA methylation subcategories. Statistical significance was determined by using the log-rank test. DNA methylation levels are plotted against mature and progenitor cells. Active histone marks are displayed for the surrounding area for each probe marked with a gray vertical line.
Discussion
Perturbed DNA methylation is a common component of many different cancers, including AML.4,12,21 AML is characterized by an aberrant DNA methylation profile, which can distinguish AML blasts from normal CD34+ cells.12,15,21 It was recently demonstrated that leukemic stem cells have a DNA methylation signature that is largely mutation independent.22 Here we describe aberrant DNA methylation in enhancer regions that are commonly altered in CN-AML. The importance of aberrant DNA methylation of enhancers in the development of AML was recently demonstrated in a mouse model with DNMT3A mutations.23 The CN-AML DNA methylation signature consisted of a major mutation-independent common cluster of DMCs. The differentially methylated enhancers can accurately cluster myeloid progenitor, mature cell, and AML samples. A subset of DMCs change in accordance with normal myelopoiesis, whereas a larger number of sites that change during granulopoiesis retain the DNA methylation profile of progenitor cells. However, the vast majority of the aberrantly methylated CpG sites in CAGE-defined enhancers are AML specific and are not part of normal myelopoiesis. Strikingly, the majority of differentially methylated regions in CN-AML occur at regulatory regions in the human genome, including enhancers identified by the FANTOM or ENCODE Consortiums. The majority of these regions are active and/or accessible in the parental CD34+ progenitor epigenome. It is not clear whether this is related to the mechanism of DNA methylation and demethylation, but it has been demonstrated that both the DNA methylation and DNA demethylation (Tet2) machinery are recruited to regulatory elements by the TFs. For example, PU.1 drives both hypermethylation and hypomethylation of regulatory regions during monocyte-to-osteoclast differentiation.24 Of note, both PU.1 and AP-1 motifs and TF binding are enriched in the hypomethylated differentially methylated enhancers in our study.
Hypermethylated sites commonly occur within TSS regions, consistent with previous studies that demonstrate DNA methylation and transcriptional silencing of a subset of genes in AML.11,25-27 We found that both CGI promoters and non-CGI promoters become hypermethylated in CN-AML to a similar extent. It is not surprising that the majority of hypermethylated sites in CN-AML involve TSS proximal promoters and CGIs, given that such regions are commonly hypomethylated.28 Because the majority of the genome is methylated, hypermethylation of most CpGs is not possible, and only CpGs that show low DNA methylation can become methylated further during development or carcinogenesis. We show for the first time that enhancers that are marked by active histone modifications and accessible chromatin in normal CD34+ progenitors become hypermethylated and silenced in CN-AML. A recent study identified a similar process that occurred in multiple myeloma in which B-cell enhancers that are dormant in stem cells and activated in B cells become silenced during transformation of B cells.29 Similarly, these findings seem intuitive given that, with the exception of TSS proximal regions and CGIs, the major sites of low or intermediate DNA methylation in the genome are enhancer regions. The bulk of the inter- and intragenic CpGs are normally methylated.28 In almost all cases in which accessible regions in active TSS and enhancer regions become methylated, they also become silenced. This is consistent with the incompatible nature of DNA methylation and the active chromatin state.30-32 Of note, it was recently observed that 1 key regulator of AML cell growth is CHD4, a well-described downstream effector of DNA methylation capable of restricting chromatin accessibility.33
In relation to hypomethylated sites, it must be considered that the majority of the genome is methylated, and thus the majority of methylated CpGs do not represent a functional regulatory element. Hypomethylated sites could therefore occur in regulatory elements or nonfunctional intra- and intergenic sites. We hypothesized that the former is more likely, given that for a hypomethylated CpG to be selected for, it must confer a survival advantage and therefore have some potential function. Whereas a subset of hypomethylated sites show increased activity as measured by H3K27ac, we found that many hypomethylated regions in CN-AML do not become active, as indicated by the lack of chromatin accessibility and the absence of active histone marks. Hence, DNA hypomethylation is not sufficient to induce activation of a locus, but additional activation mechanisms are required. Intriguingly, these sites are associated with regions of H2A.Z incorporation, which suggests a model similar to that observed during pharmacologically induced DNA hypomethylation, whereby chromatin changes such as H2A.Z deposition are required for full activation.20 Another possible mechanism may relate to transcription factor expression and binding dynamics, which may promote DNA hypomethylation and activation of target loci.10 Furthermore, it was demonstrated that pharmacologic disruption of DNA methylation in a given cell type leads to the activation of only a subset of transcription factor binding sites, whereas the majority of unbound sites remain unbound.34 In addition, hypomethylated regions include poised enhancers marked by H3K4me1 in the CD34+ epigenome that subsequently become more active in CN-AML as well as regions that are established as active enhancers specifically in the CN-AML epigenome. Schlesinger et al35 proposed a model whereby the majority of inter- and intragenic regulatory regions are pre-established as accessible regions in the stem cell epigenome, a subset of which become further demethylated during maturation coinciding with enhancer activation and transcription. It is possible that inactive sites associated with hypomethylation could become functional under the right environmental stimulus or were functional at an earlier point in AML development. A recent study demonstrated that an accessible hypomethylated region in the MLH1 promoter occurs in glioblastoma, whereby chromatin accessibility is dynamic and related to the stimulus of temozolomide selection, switching between accessible and inaccessible states.36
Our results suggest that deregulation of DNA methylation at enhancers potentially contributes to disease pathogenesis in AML. Indeed the target genes of the differentially methylated enhancers become aberrantly activated or repressed in relation to whether they become hypermethylated or hypomethylated. Several of those genes are implicated in tumorigenesis and hematopoiesis and are likely to contribute to leukemogenesis. The clinical importance of perturbed epigenetic regulation of enhancer activity is demonstrated by their prognostic value to predict the overall survival of AML patients.
This article contains a data supplement.
The publication costs of this article were defrayed in part by page charge payment. Therefore, and solely to indicate this fact, this article is hereby marked “advertisement” in accordance with 18 USC section 1734.
Acknowledgments
The authors acknowledge the Bioinformatics, Expression and Analysis facility at the Department of Biosciences and Nutrition, Karolinska Institutet. The authors thank Sten Linnarsson for RNA sequencing and Marios Dimitriou and Åsa-Lena Dackland for fluorescence-activated cell sorting and analyses.
This work was supported by the Swedish Childhood Cancer Foundation (A.L.), the Swedish Cancer Foundation (K.E., S.L., and A.L.), the Swedish Research Council (K.E., S.L., and A.L.), the Åke Ohlssons Foundation (A.L.), Radiumhemmets Forskningsfonder (A.L.), the Knut and Alice Wallenberg Foundation (K.E. and S.L.), and in part by the German Research Foundation Heisenberg-Professor BU 1339/8-1 (L.B.) and SFB 1074 project B03 (L.B. and K.D.).
Authorship
Contribution: A.L. and S.L. designed the study; S.L., K.D., and L.B. provided the samples; V.I.G., L.B., and K.D. performed the mutation analyses; Y.Q. performed and analyzed the DNA methylation experiments; Y.Q. and L.S. performed the clustered regularly interspaced short palindromic repeats/Cas9 enhancer deletions; L.S. analyzed the chromatin immunoprecipitation sequencing data; K.E. planned and L.C. performed the chromatin immunoprecipitations; K.K. performed the RNA sequencing data analysis; K.E., L.S., Y.Q., S.L., and A.L. wrote the manuscript; and all authors read and approved the manuscript.
Conflict-of-interest disclosure: The authors declare no competing financial interests.
Correspondence: Sören Lehmann, Hematology Center, Karolinska Institutet, Hälsovägen 7-9, 14157 Huddinge, Sweden; e-mail: soren.lehmann@ki.se; and Andreas Lennartsson, Department of Biosciences and Nutrition, Karolinska Institutet, Hälsovägen 7-9, 14157 Huddinge, Sweden; e-mail: andreas.lennartsson@ki.se.
References
Author notes
Y.Q. and L.S. contributed equally to this study.
S.L. and A.L. contributed equally to this study.

This feature is available to Subscribers Only
Sign In or Create an Account Close Modal