Abstract
Introduction: Thrombin generation (TG) assesses the hemostatic capacity of an individual and is indicative of a person's bleeding and thrombosis risk. TG dependson the balance between the pro- and anticoagulant processes in clotting plasma. Recently, we developed a method to study the main pro- and anticoagulant processes at the basis of TG, called the thrombin dynamics method. Vitamin K antagonist (VKA) treatment is known to reduce TG and that the reduction of TG correlates with the international normalized ratio (INR). In this study, we aim to investigate the effect of VKA therapy on the dynamics of TG by examining prothrombin conversion and thrombin inactivation.
Materials and methods: TG was measured in platelet poor plasma at 1 pM tissue factor in 129 healthy subjects and 129 patients treated with VKA. The patients were classified according to the INR value: INR<2 (n=17), 2<INR<3 (n=55), 3<INR<4 (n=38) and INR>4 (n=19). Thrombin dynamics was calculated from TG curves and plasma antithrombin (AT), α2-macroglobulin (α2M) and fibrinogen levels. Three thrombin dynamics parameters were determined: the total amount of prothrombin conversion (PCtot), the maximum rate of prothrombin conversion (PCmax) and the thrombin decay capacity (TDC) of each plasma sample.
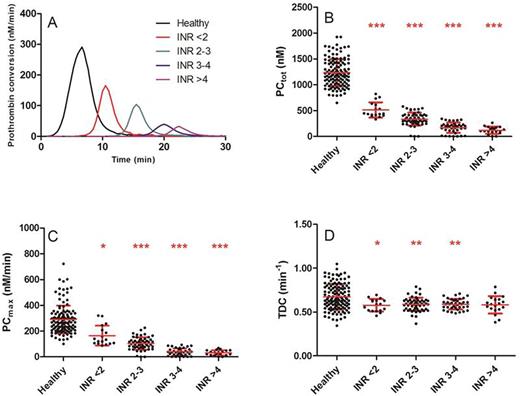
Results: Vitamin K antagonist treatment reduced the ETP and peak height significantly at all INR values (p<0.001), and the INR is negatively correlated with the TEP and the peak height (R2=0.47, p<0.001). The lag time was increased in patients compared to controls (3.3 vs. 16.3 min, P<0.001). VKA reduce prothrombin conversion by decreasing both the total amount of prothrombin converted and the maximum rate of the prothrombinase (figure 1A-C). Surprisingly, the rate of thrombin inactivation was attenuated in patients treated with VKA, and this effect was independent of the INR (0.67 vs. 0.58 min-1, p<0.001, figure 1D).
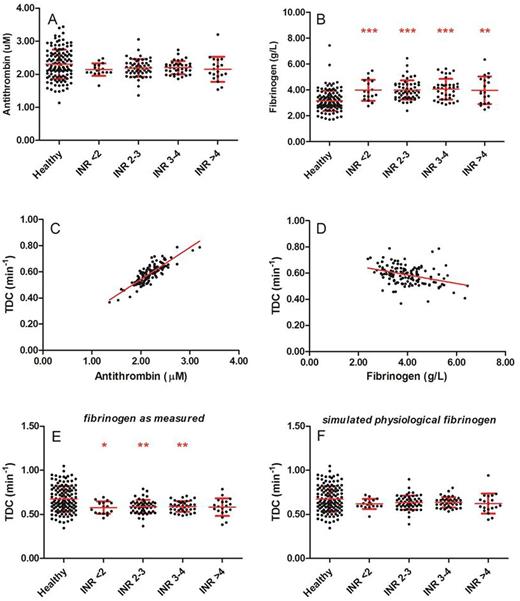
As previously reported, the thrombin decay capacity is mainly dependent on the plasma antithrombin and fibrinogen level. Plasma antithrombin levels were comparable between healthy subjects and patients on VKA (figure 2A) and showed a clear positive correlation with the thrombin decay constant in the patient group (R2=0.72, p<0.001, figure 2C). As antithrombin levels did not differ between healthy subjects and patients, the difference in TDC could not be attributed to antithrombin. In contrast, fibrinogen levels were elevated in all patients, regardless of the INR (figure 2B), and were were negatively correlated with the TDC (R2=0.13, p<0.001, figure 2D). Therefore we performed in silico testing to investigate whether thrombin decay is attenuated in patients by elevated levels of fibrinogen, by calculating prothrombin conversion as if fibrinogen levels were physiological (the average fibrinogen level found in the group of healthy subjects). Figure 2E-F shows that indeed, the thrombin decay capacity in patients is reduced compared to controls due to increased fibrinogen levels. If in an in silico model of the thrombin decay capacity the measured fibrinogen levels are substituted by the average healthy subject fibrinogen levels, the thrombin decay constant restores to normal (0.67 vs. 0.63 min-1, p=0.238) in the VKA-treated patients.
Conclusion: Thrombin dynamics analysis shows that prothrombin conversion is reduced in patients treated with VKA and that thrombin inactivation is significantly attenuated. We demonstrate that the latter effect can be attributed to the elevated fibrinogen levels that accompany VKA treatment.
Thrombin dynamics in healthy subjects and VKA patients. (A) Prothrombin conversion curves. (B) PCtot: total amount of prothrombin converted; (C) PCmax: maximum rate of prothrombin conversion; (D) TDC: thrombin decay capacity. *p<0.05, **p<0.01, ***p<0.001 compared to healthy subjects.
Thrombin dynamics in healthy subjects and VKA patients. (A) Prothrombin conversion curves. (B) PCtot: total amount of prothrombin converted; (C) PCmax: maximum rate of prothrombin conversion; (D) TDC: thrombin decay capacity. *p<0.05, **p<0.01, ***p<0.001 compared to healthy subjects.
The role of the plasma antithrombin and fibrinogen levels in the attenuation of the thrombin inactivation capacity in patients on VKA. (A) Antithrombin levels in healthy subjects and patients; (B) Fibrinogen levels in healthy subjects and patients. (C-D) The correlation of the thrombin decay capacity with antithrombin (C) and fibrinogen levels (D). (E) The measured thrombin decay capacity in healthy subjects and patients. (F) The simulated thrombin decay capacity in heathy subjects and patients at physiological fibrinogen levels. *p<0.05, **p<0.01, ***p<0.001 compared to healthy subjects.
The role of the plasma antithrombin and fibrinogen levels in the attenuation of the thrombin inactivation capacity in patients on VKA. (A) Antithrombin levels in healthy subjects and patients; (B) Fibrinogen levels in healthy subjects and patients. (C-D) The correlation of the thrombin decay capacity with antithrombin (C) and fibrinogen levels (D). (E) The measured thrombin decay capacity in healthy subjects and patients. (F) The simulated thrombin decay capacity in heathy subjects and patients at physiological fibrinogen levels. *p<0.05, **p<0.01, ***p<0.001 compared to healthy subjects.
Hemker:Diagnostica Stago: Consultancy.
Author notes
Asterisk with author names denotes non-ASH members.


This feature is available to Subscribers Only
Sign In or Create an Account Close Modal