Key Points
Primary BCP-ALL cells use tunneling nanotubes to signal to mesenchymal stromal cells and thereby trigger cytokine secretion.
Inhibiting tunneling nanotube signaling is a promising approach to induce apoptosis and sensitize BCP-ALL cells toward prednisolone.
Abstract
Acute lymphoblastic leukemia (ALL) cells reside in the bone marrow microenvironment which nurtures and protects cells from chemotherapeutic drugs. The disruption of cell-cell communication within the leukemic niche may offer an important new therapeutic strategy. Tunneling nanotubes (TNTs) have been described as a novel mode of intercellular communication, but their presence and importance in the leukemic niche are currently unknown. Here, we show for the first time that primary B-cell precursor ALL (BCP-ALL) cells use TNTs to signal to primary mesenchymal stromal cells (MSCs). This signaling results in secretion of prosurvival cytokines, such as interferon-γ–inducible protein 10/CXC chemokine ligand 10, interleukin 8, and monocyte chemotactic protein-1/CC chemokine ligand 2. A combination of TNT-disrupting conditions allows us to analyze the functional importance of TNTs in an ex vivo model. Our results indicate that TNT signaling is important for the viability of patient-derived B-cell precursor ALL cells and induces stroma-mediated prednisolone resistance. Disruption of TNTs significantly inhibits these leukemogenic processes and resensitizes B-cell precursor ALL cells to prednisolone. Our findings establish TNTs as a novel communication mechanism by which ALL cells modulate their bone marrow microenvironment. The identification of TNT signaling in ALL-MSC communication gives insight into the pathobiology of ALL and opens new avenues to develop more effective therapies that interfere with the leukemic niche.
Introduction
Acute lymphoblastic leukemia (ALL) cells reside in the local microenvironment of the bone marrow and are able to disrupt normal hematopoietic stem cell niches.1 The disrupted, so-called leukemic, niche is essential in initiating and facilitating leukemogenesis.2-6 In addition, the leukemic niche protects leukemic cells from elimination by immune responses and chemotherapeutic agents, and can facilitate the development of drug resistance of leukemic cells.7-10 Therefore, the disruption of the ALL-leukemic niche interaction offers a promising new therapeutic strategy.11-16 However, it is still largely unclear how crosstalk occurs within the leukemic niche, and how this drives leukemic cell survival and chemotherapy resistance.
Recently, tunneling nanotubes (TNTs), or membrane nanotubes, have been described as a novel mode of communication between eukaryotic cells.17-21 TNTs are thin membrane protrusions consisting of F-actin, that connect cells and facilitate the transport of several types of cargo, including organelles, pathogens, calcium fluxes, death signals, and membrane-bound proteins.19,20,22-24 These intercellular membrane conduits have been observed in several cell types, like cancer cells, complex tissues, and organisms.20,21,24-29 The pathophysiological importance of TNTs has become evident by studies showing that prions and HIV-1 particles use TNTs to promote disease spread.21,30 However, the presence of TNTs within the leukemic niche and hence their role in communication between leukemic cells and the bone marrow microenvironment has not yet been addressed. Here, we study the role of TNT signaling in communication between primary B-cell precursor ALL (BCP-ALL) cells and mesenchymal stromal cells (MSCs), and the contribution of TNT signaling to mesenchymal-mediated survival and resistance to the chemotherapeutic drug prednisolone.
Methods
Cell lines
BCP-ALL cell lines, NALM6 (B-Other) and REH (TEL-AML1), were obtained from Deutsche Sammlung von Mikroorganismen und Zellkulturen (DSMZ). Only low cell passages were used, and the identity of cell lines was routinely verified by DNA fingerprinting. Immortalized human telomerase reverse transcriptase (hTERT)-MSCs were a kind gift from Prof Dr D. Campana, St. Jude Children’s Hospital (Memphis, TN).
Primary patient-derived material
Bone marrow aspirates were obtained from children with newly diagnosed BCP-ALL prior to treatment. Mononuclear leukemic cells were collected and processed as previously described.31 All samples used in this study contained ≥97% leukemic blasts (supplemental Figure 7, see supplemental Data available at the Blood Web site). MSCs were isolated from bone marrow aspirates obtained from newly diagnosed BCP-ALL patients (before treatment) and healthy controls. MSCs were processed as described previously.32 Primary MSCs were characterized using positive (CD44/CD90/CD105/CD54/CD73/CD146/CD166/STRO-1) and negative (CD19/CD45/CD34) surface markers (supplemental Figure 6). Multilineage potential of MSCs was confirmed for adipocyte (Oil Red O staining), osteocyte (Alizarin Red S staining), and chondrocyte (Col2a/Thionine/Alcian Blue staining) differentiation.
Dye transfer experiments
Cells were stained with 1,1′-dioctadecyl-3,3,3′,3′-tetramethylindocarbocyanine perchlorate (DiI; yellow), 3,3′-dioctadecyloxacarbocyanine (DiO; green), 1,1′-dioctadecyl-3,3,3′3′-tetramethylindodicarbocyanine perchlorate (DiD; red), or Calcein red–orange AM (all from Life Technologies) according to the manufacturer’s protocol. Target populations were analyzed before and after coculture with flow cytometry (BD Biosciences) or confocal microscopy (next paragraph).
Confocal laser-scanning microscopy
For high-resolution images, differentially stained cells were cultured on a glass slide coated with 10 µg/mL fibronectin (Sigma-Aldrich) at 37°C and 5% CO2. Cells were fixated as previously described.33 Confocal images were acquired with sequential scanning of different channels at a resolution of 1024 × 1024 pixels in the x × y plane and 0.15-µm steps in z-direction (Leica SP5). For time-lapse confocal imaging, cultures were maintained at 37°C on a heated stage at 5% CO2 and images were acquired with sequential scanning of different channels at a resolution of 512 × 512 pixels in the x × y plane and 0.5-µm steps in z-direction. Three-dimensional (3D) image stacks were acquired by optical sectioning using the LAS software provided with the instrument. The system was equipped with a 63× plan-apochromat oil 1.4 numerical aperture differential interference contrast objective. The pinhole diameter was set to 1 airy unit (95.5 μm). DiO and DiI were excited with a 488-nm Argon laser and a 561-nm diode-pumped solid-state laser, respectively. Phalloidin–fluorescein isothiocyanate (Phalloidin-FITC; Sigma-Aldrich) was excited with the 488-nm Argon laser. Image processing was done with Fiji software.34
TNT inhibition
TNTs were inhibited using actin inhibition by latrunculin B (125-500 nM; Sigma-Aldrich) or cytochalasin D (250 nM–1 µM; Sigma-Aldrich),20 by mechanical disruption via gentle shaking of cell cultures (250 rpm),21,35 or by physical separation of leukemic cells (cultured in a 3.0-µm pore-sized insert) and MSCs (cultured in the bottom compartment of a transwell system; Corning).21,36
Cell viability assays
Primary patient cells (1 × 10⁶ cells) were cocultured with or without primary MSCs (5 × 10⁴) for 5 days in a 24-well plate at 37°C and 5% CO2. The percentage of viable leukemic cells was determined by staining with Brilliant Violet 421 anti-human CD19 or CD45 antibody (Biolegend), FITC Annexin V (Biolegend), and propidium iodide (PI; Sigma), after which the percentage of AnnexinVneg/PIneg/CD19pos/CD45pos cells within the MSC-negative fraction (see Figure 6A for gating strategy) was determined by flow cytometry (BD Biosciences). In supplemental Figure 10, viable leukemic cells were counted (PIneg/CD19pos) using a MACSQuant analyzer (Miltenyi Biotec).
Multiplexed fluorescent bead-based immunoassay (Luminex)
Primary leukemic cells and leukemic cell lines were cocultured with primary MSCs with or without TNT inhibition (shaking or transwell condition) for indicated time points at 37°C and 5% CO2. Next, the supernatant was collected and cell viability of leukemic cells was assessed as described in the preceding paragraph. The concentration of 64 cytokines/chemokines in supernatants of ALL-MSC cocultures was analyzed using a fluorescent bead-based immunoassay (Luminex Human Cytokine/Chemokine Panel I and II; Merck Millipore) according to the manufacturer’s protocol.
Statistical analysis
The Student t test was used as a statistical test and a Student paired t test was used when applicable (indicated in figure legends). Bar graphs represent the mean of biological replicates. Error bars represent standard error of the mean (SEM).
For more details, see supplemental Methods.
Results
BCP-ALL cells use TNTs to effectively signal to MSCs
TNT formation within the hematopoietic niche was studied by confocal microscopy and flow cytometry. TNTs are thin membrane tethers and can be visualized using lipophilic carbocyanine dyes.20,21 These dyes stain lipophilic structures in the entire cell, and exhibit very low cell toxicity, whereas passive transfer of these dyes is negligible. Therefore, these dyes are widely used in live cell-tracking experiments.1,37 Interestingly, it has been shown that organelles and membrane components stained by these dyes can be actively transported via TNTs.20 Therefore, these dyes were used to visualize intercellular communication via TNTs within the leukemic niche.
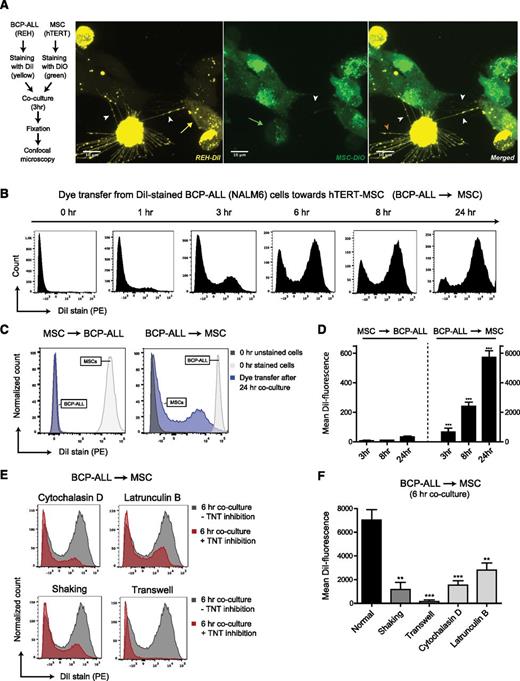
Differential staining of NALM6 BCP-ALL cells (stained with DiI-yellow) and mesenchymal stromal cells (hTERT-MSCs; stained with DiO-green) revealed that TNTs were formed within 3 hours of coculture (Figure 1A; supplemental Figure 1M-P). 3D reconstruction of these images shows that nanotubular structures between cells do not connect with the substratum (ie, the fibronectin-coated glass slide; see supplemental Videos 1A-B and 2). As expected, staining with Phalloidin-FITC shows the presence of F-actin filaments in these nanotubular structures (see supplemental Figure 1Q-R). Importantly, bidirectional transfer of lipophilic dyes was observed, indicating active crosstalk within the leukemic niche (Figure 1A). Besides formation of TNTs between leukemic cells and MSCs, TNT networks and transfer of lipophilic dye was also observed in monocultures of BCP-ALL cells and MSCs (supplemental Figures 1A-L and 2).
TNT signaling between BCP-ALL cells and MSCs. (A) Representative confocal images (Z-stack) showing TNT networks (white arrowheads) between BCP-ALL cell line REH (DiI, yellow) and hTERT-immortalized MSCs (DiO, green) after coculture for 3 hours. Bidirectional exchange of lipophilic dye via TNTs was observed (green arrow for MSC to ALL, yellow arrow for ALL to MSC). Leukemic cells also formed TNT-like structures toward the fibronectin-coated substratum (orange arrowhead). (B) Graph showing quantification of dye transfer from DiI-stained NALM6 cells toward unstained hTERT-MSCs (cultured in 4:1 ratio) in time. Figure shows representative experiment (n = 3). (C) Graph showing quantification of dye transfer after 24 hours of coculture (cultured in 1:1 ratio). Left panel, Dye transfer from DiI-stained hTERT-MSCs toward unstained NALM6 cells. Right panel, The reciprocal experiment (also performed in a 1:1 ratio). White and gray histograms represent staining intensity at the start of each experiment. (D) Quantification of dye transfer in time of experiment as exemplified in panel C, performed with 2 different BCP-ALL cell lines (REH and NALM6). Dye transfer from MSCs toward ALL was compared with dye transfer from ALL toward MSCs (n = 4; 2-tailed t test, unpaired). (E) Graph showing quantification of dye transfer from DiI-stained NALM6 cells toward unstained hTERT-MSCs with (red histograms) or without (gray histograms) TNT inhibition. Cells were cocultured in 4:1 ratio for 6 hours. Three independent TNT inhibiting conditions were used: actin inhibition by cytochalasin D or latrunculin B, physical disruption by gentle shaking, or culture in a 3.0-μm transwell system. (F) Quantification of dye transfer experiment exemplified in panel E, performed with 2 different BCP-ALL cell lines (REH and NALM6) (n = 4; 1-tailed t test, unpaired). Data are means ± SEM; **P ≤ .01, ***P ≤ .001 (see also supplemental Figures 1 and 3, and supplemental Videos 1A-B and 2).
TNT signaling between BCP-ALL cells and MSCs. (A) Representative confocal images (Z-stack) showing TNT networks (white arrowheads) between BCP-ALL cell line REH (DiI, yellow) and hTERT-immortalized MSCs (DiO, green) after coculture for 3 hours. Bidirectional exchange of lipophilic dye via TNTs was observed (green arrow for MSC to ALL, yellow arrow for ALL to MSC). Leukemic cells also formed TNT-like structures toward the fibronectin-coated substratum (orange arrowhead). (B) Graph showing quantification of dye transfer from DiI-stained NALM6 cells toward unstained hTERT-MSCs (cultured in 4:1 ratio) in time. Figure shows representative experiment (n = 3). (C) Graph showing quantification of dye transfer after 24 hours of coculture (cultured in 1:1 ratio). Left panel, Dye transfer from DiI-stained hTERT-MSCs toward unstained NALM6 cells. Right panel, The reciprocal experiment (also performed in a 1:1 ratio). White and gray histograms represent staining intensity at the start of each experiment. (D) Quantification of dye transfer in time of experiment as exemplified in panel C, performed with 2 different BCP-ALL cell lines (REH and NALM6). Dye transfer from MSCs toward ALL was compared with dye transfer from ALL toward MSCs (n = 4; 2-tailed t test, unpaired). (E) Graph showing quantification of dye transfer from DiI-stained NALM6 cells toward unstained hTERT-MSCs with (red histograms) or without (gray histograms) TNT inhibition. Cells were cocultured in 4:1 ratio for 6 hours. Three independent TNT inhibiting conditions were used: actin inhibition by cytochalasin D or latrunculin B, physical disruption by gentle shaking, or culture in a 3.0-μm transwell system. (F) Quantification of dye transfer experiment exemplified in panel E, performed with 2 different BCP-ALL cell lines (REH and NALM6) (n = 4; 1-tailed t test, unpaired). Data are means ± SEM; **P ≤ .01, ***P ≤ .001 (see also supplemental Figures 1 and 3, and supplemental Videos 1A-B and 2).
To quantify active crosstalk via TNTs, we used flow cytometric analysis of dye transfer from labeled donor cells to unlabeled recipient cells. First, CD19-positive BCP-ALL cell lines (NALM6 and REH) were stained with lipophilic dye DiI and cocultured with unstained CD19-negative hTERT-MSCs (supplemental Figure 3A-C for gating strategy). After 6 hours of culture, >50% of the MSCs were positive for DiI. This number increased to >85% after 24 hours, highlighting the efficient dye transfer from leukemic cells to MSCs (Figure 1B; supplemental Figure 3D). In reciprocal experiments we also observed dye transfer from MSCs to BCP-ALL cells, but the magnitude of dye transfer was strikingly less than from ALL cells toward MSCs (175-fold, P value ≤ .001) (Figure 1C-D). Transfer of lipophilic dyes can be mediated by several processes including TNT signaling and signaling via extracellular vesicles (ECVs). To evaluate the contribution of TNT signaling to the observed lipophilic dye transfer between leukemic cells and MSCs, we inhibited TNTs using 3 independent experimental setups: (1) reducing TNT formation through actin inhibition,20 (2) mechanical disruption of TNT connections through gentle shaking of cell cultures,21,35 and (3) prevention of TNT formation by physically separating leukemic cells (cultured in a 3.0-µm pore-sized insert) and MSCs (cultured in the bottom compartment of a transwell system).21,36 For inhibition of the polymerized F-actin of which TNTs are composed,20 we used 2 classes of F-actin polymerization inhibitors: cytochalasin D and latrunculin B. In addition to F-actin elements, TNTs need prolonged cell contact to signal efficiently. Gentle shaking of ALL-MSC cocultures reduces the lifespan of TNTs, whereas direct contact between BCP-ALL cells and MSCs is still possible. However, it is well established in literature that flow-derived shear forces (gentle shaking) induce integrin-mediated signaling.38,39 Therefore, we also physically separated ALL cells and MSCs using a transwell system, to exclude the effects of increased integrin signaling. We used a 3.0-µm transwell system to also investigate the contribution of extracellular vesicle signaling to lipophilic dye transfer. In this transwell system leukemic cells are physically separated from MSCs, while exchange of extracellular vesicles (30-1000 nm) is still possible.
Cytochalasin D and latrunculin B both caused a dose-dependent reduction of dye transfer after 6 hours of coculture (P ≤ .01; Figure 1E-F; supplemental Figure 3E-F). Due to the short half-time of these actin inhibitors,40,41 TNT formation was restored within 24 hours (supplemental Figure 3E-F). Disruption of TNT structures by gentle shaking reduced dye transfer by more than fivefold (P ≤ .01; Figure 1E-F; supplemental Figure 3G). Importantly, dye transfer from BCP-ALL cell lines to MSCs was nearly absent in transwell experiments (P ≤ .001), which indicates that dye transfer occurs mainly via TNTs and not via extracellular vesicles (Figure 1E-F; supplemental Figure 3H).
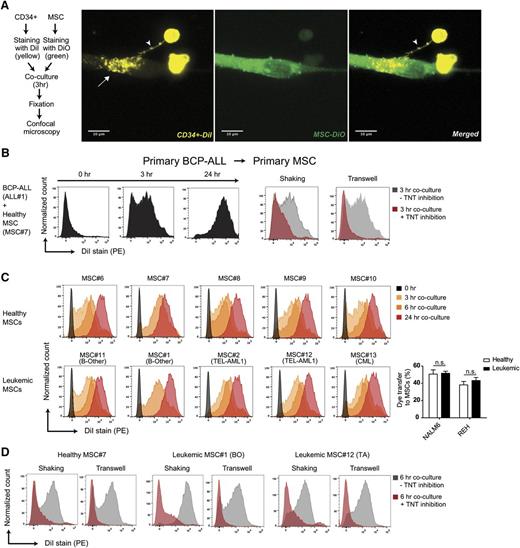
The TNT-forming capacity was also evaluated in an ex vivo niche model using leukemic cells and MSCs that were both freshly obtained from patients with newly diagnosed BCP-ALL (Figure 2A; supplemental Figures 4A-J, 5A-D, 6, and 7). Ex vivo cocultures revealed that TNTs rapidly (<3 hours) form between primary BCP-ALL cells and primary MSCs, and efficiently transfer lipophilic dye (Figure 2B; supplemental Figures 4G-J and 5). The source of MSCs did not affect the efficacy of TNT signaling. Dye transfer was similarly efficient from ALL cells toward 10 different primary MSCs (n = 5 healthy and n = 5 leukemic primary patient-derived MSCs; Figure 2C-D; supplemental Figure 8A-C).
Primary BCP-ALL cells signal to MSCs via TNTs. (A) Representative confocal images (Z-stack) showing TNT formation (white arrowhead) between a primary CD34-positive cell (DiI, yellow) and a hTERT-immortalized MSC (DiO, green) after coculture for 3 hours. White arrow indicates transfer of dye to recipient cell. (B) Graphs showing quantification of dye transfer in cocultures of BCP-ALL patient cells with primary MSCs (cultured in 4:1 ratio). Inhibition of TNTs was performed by gentle shaking of cocultures, or coculture in a 3.0-μm transwell system (red histograms). (C) Graphs showing quantification of dye transfer from DiI-stained NALM6 cells toward 10 different unstained primary MSCs (cultured in 4:1 ratio) obtained from leukemia patients (n = 5) and healthy controls (n = 5). (D) Graphs showing quantification of dye transfer from DiI-stained NALM6 cells toward 3 different primary MSCs with (red histograms) or without (gray histograms) TNT inhibition (see also supplemental Figures 4-8).
Primary BCP-ALL cells signal to MSCs via TNTs. (A) Representative confocal images (Z-stack) showing TNT formation (white arrowhead) between a primary CD34-positive cell (DiI, yellow) and a hTERT-immortalized MSC (DiO, green) after coculture for 3 hours. White arrow indicates transfer of dye to recipient cell. (B) Graphs showing quantification of dye transfer in cocultures of BCP-ALL patient cells with primary MSCs (cultured in 4:1 ratio). Inhibition of TNTs was performed by gentle shaking of cocultures, or coculture in a 3.0-μm transwell system (red histograms). (C) Graphs showing quantification of dye transfer from DiI-stained NALM6 cells toward 10 different unstained primary MSCs (cultured in 4:1 ratio) obtained from leukemia patients (n = 5) and healthy controls (n = 5). (D) Graphs showing quantification of dye transfer from DiI-stained NALM6 cells toward 3 different primary MSCs with (red histograms) or without (gray histograms) TNT inhibition (see also supplemental Figures 4-8).
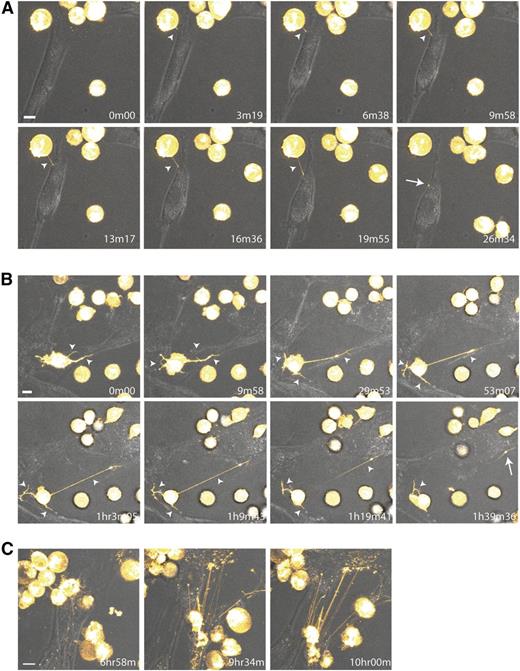
The dynamics of TNT formation between BCP-ALL cells and MSCs were investigated using time-lapse confocal microscopy. Leukemic cells initiated formation of TNTs and transferred lipophilic dye toward MSCs within minutes (Figure 3A; supplemental Videos 3 and 4A). Leukemic cells were able to form multiple TNTs and signal to several MSCs simultaneously (Figure 3B; supplemental Videos 3 and 4A-B). TNTs formed between MSCs and leukemic cells were stable for multiple hours and could reach several cell diameters in length (Figure 3C; supplemental Videos 3 and 4A). After 10 hours, the majority of MSCs became DiI-positive (supplemental Videos 3 and 4B), as confirmed by flow cytometry (Figure 1B).
Dynamic nature of TNT formation between BCP-ALL cells and MSCs. (A-C) Time-lapse confocal images (3D image stacks) showing TNT formation (white arrowhead) between NALM6 cells (DiI, yellow) and primary MSCs at multiple time points. White arrow indicates transfer of dye to recipient cell. Time indicated in the right lower corner is the duration from start of the experiment. Orange Hot look-up table (LUT) and transmission overlays were used to illustrate dye transfer toward MSCs. Scale bars represent 10 µm. (A,C) Depicted images are closeups of the upper left corner of supplemental Video 3. (B) Depicted images are closeups of supplemental Video 4A. Data are representative of 3 independent experiments (see also supplemental Figure 5 and supplemental Videos 3 and 4A-B).
Dynamic nature of TNT formation between BCP-ALL cells and MSCs. (A-C) Time-lapse confocal images (3D image stacks) showing TNT formation (white arrowhead) between NALM6 cells (DiI, yellow) and primary MSCs at multiple time points. White arrow indicates transfer of dye to recipient cell. Time indicated in the right lower corner is the duration from start of the experiment. Orange Hot look-up table (LUT) and transmission overlays were used to illustrate dye transfer toward MSCs. Scale bars represent 10 µm. (A,C) Depicted images are closeups of the upper left corner of supplemental Video 3. (B) Depicted images are closeups of supplemental Video 4A. Data are representative of 3 independent experiments (see also supplemental Figure 5 and supplemental Videos 3 and 4A-B).
TNTs are important players in signaling from BCP-ALL cells to MSCs
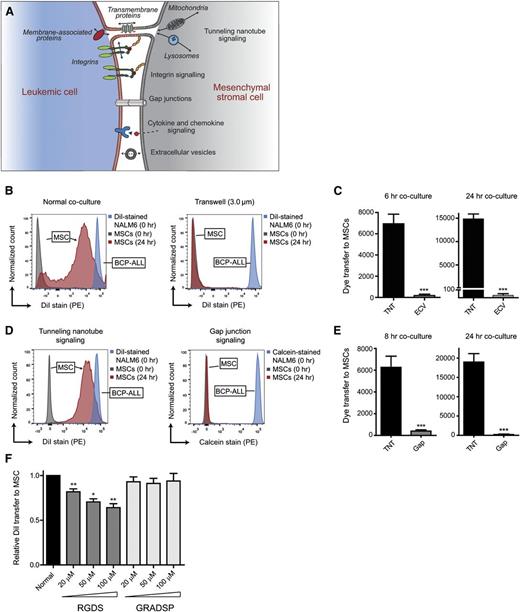
The above-mentioned findings suggest that TNT signaling is a highly effective communication mechanism between ALL cells and MSCs. This was further illustrated by comparing TNT signaling to other intercellular communication mechanisms, including gap junctions, integrins, and ECVs (Figure 4A). Dye transfer from leukemic cells toward MSCs was minimal using a 3.0-µm transwell system, in which ECV signaling is possible (>500-fold lower compared with normal coculture after 24 hours; P ≤ .001; Figure 4B-C). Transfer experiments with the gap junction-specific dye Calcein revealed that signaling from leukemic cells toward primary MSCs via gap junctions is highly ineffective compared with signaling via TNTs (>90-fold lower after 24 hours; P ≤ .001; Figure 4D-E). Integrin signaling has been implicated in the induction of TNTs,42 raising the question of whether TNTs function autonomously or in an integrin-dependent manner. To inhibit integrin signaling between BCP-ALL cells and MSCs, we used Arg-Gly-Asp-Ser (RGDS) peptides, reported to prevent the binding of integrins to membranes.43 RGDS negatively affected the efficiency of lipophilic dye transfer via TNTs whereas the transfer in the presence of negative control peptides (Gly-Arg-Ala-Asp-Ser-Pro [GRADSP]) remained unaffected (Figure 4F). The reduction in lipophilic dye transfer was limited to a maximum of 30% (P ≤ .01). Taken together, these data reveal that TNT signaling acts independently of other important intercellular communication mechanisms, that is, signaling via extracellular vesicles, gap junctions, and integrins.
TNTs are important players in signaling from BCP-ALL cells to MSCs. (A) Model of crosstalk between leukemic cells and MSCs in the hematopoietic niche. (B) Graphs showing quantification of dye transfer from DiI-stained NALM6 cells toward unstained hTERT-MSCs. Blue and gray histograms represent staining intensity at the start of each experiment. Red histogram represents signaling efficiency via TNTs (normal coculture; left panel) and via ECVs (3.0-μm transwell; right panel). (C) Bar graphs of experiment shown in panel B after 6 hours (left panel) and 24 hours (right panel) of coculture (n = 4; 2-tailed t test, unpaired). (D) Graphs showing quantification of dye transfer from BCP-ALL cell line NALM6, stained with either DiI or calcein, toward primary MSCs after 24 hours of coculture. Blue and gray histograms represent staining intensity at the start of each experiment. Red histogram shows signaling efficiency via TNTs (left panel) and via gap junctions (right panel). (E) Bar graphs of experiment shown in panel D after 8 hours (n = 6; left panel) and 24 hours (n = 4; right panel) of coculture (2-tailed t test, unpaired). (F) Bar graphs representing dye transfer from DiI-stained REH cells toward unstained primary MSCs with and without integrin blocking. Integrin signaling was blocked by addition of RGDS peptide, and compared with addition of the integrin nonbinding peptide GRADSP (n = 5; 1-tailed t test, paired). Data are means ± SEM; *P ≤ .05, **P ≤ .01, ***P ≤ .001.
TNTs are important players in signaling from BCP-ALL cells to MSCs. (A) Model of crosstalk between leukemic cells and MSCs in the hematopoietic niche. (B) Graphs showing quantification of dye transfer from DiI-stained NALM6 cells toward unstained hTERT-MSCs. Blue and gray histograms represent staining intensity at the start of each experiment. Red histogram represents signaling efficiency via TNTs (normal coculture; left panel) and via ECVs (3.0-μm transwell; right panel). (C) Bar graphs of experiment shown in panel B after 6 hours (left panel) and 24 hours (right panel) of coculture (n = 4; 2-tailed t test, unpaired). (D) Graphs showing quantification of dye transfer from BCP-ALL cell line NALM6, stained with either DiI or calcein, toward primary MSCs after 24 hours of coculture. Blue and gray histograms represent staining intensity at the start of each experiment. Red histogram shows signaling efficiency via TNTs (left panel) and via gap junctions (right panel). (E) Bar graphs of experiment shown in panel D after 8 hours (n = 6; left panel) and 24 hours (n = 4; right panel) of coculture (2-tailed t test, unpaired). (F) Bar graphs representing dye transfer from DiI-stained REH cells toward unstained primary MSCs with and without integrin blocking. Integrin signaling was blocked by addition of RGDS peptide, and compared with addition of the integrin nonbinding peptide GRADSP (n = 5; 1-tailed t test, paired). Data are means ± SEM; *P ≤ .05, **P ≤ .01, ***P ≤ .001.
BCP-ALL cells use TNTs to drive cytokine release within the microenvironment
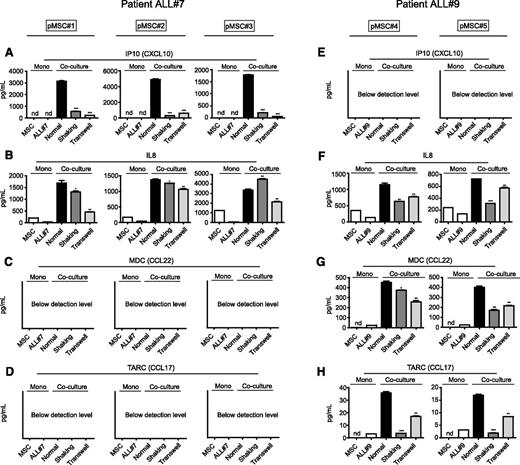
The question of how TNT signaling from leukemic cells affects their microenvironment remains. Because cytokines and chemokines can greatly affect the survival of leukemic cells,44,45 we considered that the microenvironment responds to TNT signaling by secreting supportive soluble factors. Therefore, we investigated the secreted levels of 64 known cytokines/chemokines in cocultures of primary leukemic cells of 2 BCP-ALL patients with different sources of primary MSCs. Coculture of these cells induced the secretion of several cytokines. The cytokine signature produced within cocultures suggested that this secretion was leukemia-driven and independent of the MSC source (Figure 5). Interferon-γ–inducible protein 10 (IP10)/CXC chemokine ligand 10 (CXCL10) levels increased >1000-fold when patient ALL#7 cells were cocultured with MSCs, but were undetectable in cocultures from patient ALL#9 cells (Figure 5A,E). Likewise, macrophage-derived chemokine (MDC)/CC chemokine ligand 22 (CCL22) and thymus and activation-regulated chemokine (TARC)/CC chemokine ligand 17 (CCL17), both undetectable in patient ALL#7 cocultures, were induced sixfold to 18-fold when patient ALL#9 cells were cocultured with MSCs (Figure 5C-D,G-H). Interleukin-8 (IL8) levels were induced (twofold to sevenfold) by primary ALL cells from both patients (Figure 5B,F). Cytokines that were induced less than twofold in coculture are shown in supplemental Figure 9. Only a limited number of cytokines/chemokines were found to be significantly upregulated in patients’ ALL-MSC cocultures compared with monocultures of both cell types (see supplemental Table 3). Also, in a proliferative setting (using the BCP-ALL cell line NALM6), a limited number of known cytokines were upregulated in coculture with 2 different primary MSCs: IL8 and vascular endothelial growth factor levels were on average induced twofold and threefold, respectively (n = 3, P ≤ .01; supplemental Figure 9E-H). These MSC-independent and leukemia-consistent cytokine signatures suggest that leukemic cells, and not MSCs, are responsible for the active modulation of the tumor microenvironment.
BCP-ALL cells use TNTs to drive cytokine release within the microenvironment. (A) IP10/CXCL10 supernatant levels in coculture of primary leukemic patient ALL#7 cells with primary MSC#1 (left panel), MSC#2 (middle panel), or MSC#3 (right panel). TNT signaling was inhibited by gentle shaking or culture in a transwell system (1-tailed t test, unpaired). (B) Same as panel A for IL8 levels. (C) Same as panel A for MDC (CCL22) levels. (D) Same as panel A for TARC (CCL17) levels. (E) IP10/CXCL10 supernatant levels in coculture of primary leukemic patient ALL#9 cells with primary MSC#4 (left panel) or MSC#5 (right panel). (F) Same as panel E for IL8 levels. (G) Same as panel E for MDC (CCL22) levels. (H) Same as panel E for TARC (CCL17) levels. Data are means ± SEM; *P ≤ .05, **P ≤ .01. nd, not detectable (below detection level) (see also supplemental Figure 9).
BCP-ALL cells use TNTs to drive cytokine release within the microenvironment. (A) IP10/CXCL10 supernatant levels in coculture of primary leukemic patient ALL#7 cells with primary MSC#1 (left panel), MSC#2 (middle panel), or MSC#3 (right panel). TNT signaling was inhibited by gentle shaking or culture in a transwell system (1-tailed t test, unpaired). (B) Same as panel A for IL8 levels. (C) Same as panel A for MDC (CCL22) levels. (D) Same as panel A for TARC (CCL17) levels. (E) IP10/CXCL10 supernatant levels in coculture of primary leukemic patient ALL#9 cells with primary MSC#4 (left panel) or MSC#5 (right panel). (F) Same as panel E for IL8 levels. (G) Same as panel E for MDC (CCL22) levels. (H) Same as panel E for TARC (CCL17) levels. Data are means ± SEM; *P ≤ .05, **P ≤ .01. nd, not detectable (below detection level) (see also supplemental Figure 9).
Induction of the observed cytokines was dependent on TNT signaling, as TNT inhibition significantly lowered the secreted levels of these factors (Figure 5A-H; supplemental Figure 9E-H). However, TNT inhibition only partly reversed the induction of cytokine levels in ALL-MSC cocultures, suggesting that, next to TNT signaling, other intercellular signaling routes contribute to the induction of these secretomes.
TNT signaling is important for the survival of primary BCP-ALL cells
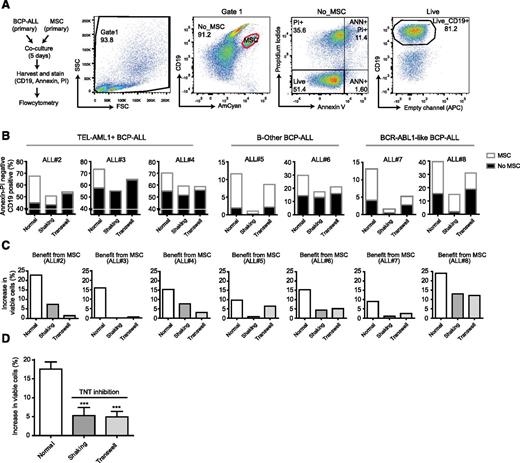
Several studies have shown the importance of the microenvironment for the survival of malignant cells, but without elucidating how.46 To study the effect of TNT signaling on leukemic cell viability, we used ex vivo cocultures of primary BCP-ALL cells and primary MSCs (see supplemental Table 1 for BCP-ALL subtype information, Figure 6A for gating strategy). Primary BCP-ALL cell survival significantly increased in 5-day cocultures with primary MSCs compared with monocultures. When TNT formation was prevented by shaking of cocultures or by transwell conditions, this increase significantly reduced 3.5- and 3.6-fold, respectively (n = 7, P ≤ .001; Figure 6B-D). The effect of TNT inhibition was consistent across leukemic cells from multiple cytogenetic BCP-ALL subgroups (TEL-AML1, BCR-ABL1–like, and B-Other).
TNT signaling is important for the survival of primary BCP-ALL cells. (A) Flowchart and flow cytometric gating strategy used to study the effect of TNTs on BCP-ALL cell survival. Cocultures of CD19positive leukemic cells and CD19negative MSCs were stained with Brilliant Violet 421 anti-human CD19 antibody, FITC Annexin V, and PI. MSCs were excluded (red gate), and the percentage of viable BCP-ALL blasts (AnnexinVneg/PIneg/CD19pos cells) was determined within the MSC-negative fraction. (B) Percentage of viable primary leukemic patient cells (n = 3 TEL-AML1, n = 2 B-Other, n = 2 BCR-ABL1-like) in monoculture (▪) or coculture with patient MSCs (□) after 5-day coculture. (C) The survival benefit for primary leukemic patient cells (n = 3 TEL-AML1, n = 2 B-Other, n = 2 BCR-ABL1-like) in coculture with patient MSCs. (D) The mean survival benefit for primary leukemic patient cells in coculture with patient MSCs (n = 7; 1-tailed t test, paired). Data are means ± SEM; ***P ≤ .001.
TNT signaling is important for the survival of primary BCP-ALL cells. (A) Flowchart and flow cytometric gating strategy used to study the effect of TNTs on BCP-ALL cell survival. Cocultures of CD19positive leukemic cells and CD19negative MSCs were stained with Brilliant Violet 421 anti-human CD19 antibody, FITC Annexin V, and PI. MSCs were excluded (red gate), and the percentage of viable BCP-ALL blasts (AnnexinVneg/PIneg/CD19pos cells) was determined within the MSC-negative fraction. (B) Percentage of viable primary leukemic patient cells (n = 3 TEL-AML1, n = 2 B-Other, n = 2 BCR-ABL1-like) in monoculture (▪) or coculture with patient MSCs (□) after 5-day coculture. (C) The survival benefit for primary leukemic patient cells (n = 3 TEL-AML1, n = 2 B-Other, n = 2 BCR-ABL1-like) in coculture with patient MSCs. (D) The mean survival benefit for primary leukemic patient cells in coculture with patient MSCs (n = 7; 1-tailed t test, paired). Data are means ± SEM; ***P ≤ .001.
Inhibition of TNTs sensitizes BCP-ALL cells to prednisolone
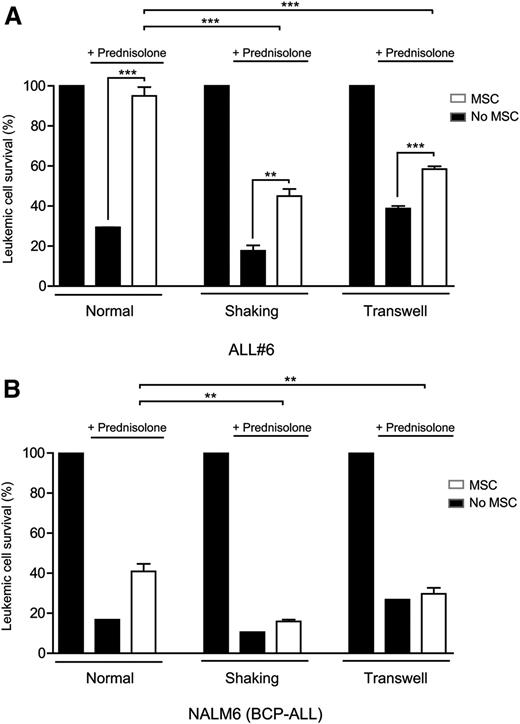
We investigated whether inhibition of TNT signaling also affects the response of leukemic cells to chemotherapeutic drugs. BCP-ALL patient cells were treated with the ALL spearhead drug prednisolone for 5 days. Prednisolone was less effective in inducing apoptosis of primary BCP-ALL cells in the presence of primary MSCs compared with monocultures of primary BCP-ALL cells (70% vs 5% reduced viability; P ≥ .001; Figure 7A), underlining the importance of MSCs in the induction of prednisolone resistance (Figure 7A). The protective effect of MSCs was significantly reduced by 2.4- and 3.3-fold (shaking and transwell conditions, n = 4, P ≤ .001; Figure 7A) when TNT signaling was inhibited. TNT inhibition alone was not sufficient to abrogate all microenvironment-induced drug resistance. In shaking and transwell conditions, which allow signaling via integrins, soluble factors or ECVs, microenvironment-induced resistance to prednisolone was still present (P ≥ .01).
Because ex vivo cultured leukemic patient cells lose their propensity to proliferate, we also addressed the effect of TNT signaling on drug resistance in a proliferative setting using the BCP-ALL cell line NALM6. Similar to primary BCP-ALL cells, coculture with MSCs induced prednisolone resistance of NALM6 cells (Figure 7B). Inhibition of TNT formation by shaking of cocultures or transwell conditions significantly reduced this effect 4.5- and 8.5-fold, respectively (P ≤ .01; Figure 7B; supplemental Figure 10A-B). These data show that inhibition of TNT signaling in cocultures sensitizes BCP-ALL cells to the antileukemic effects of prednisolone in both a primary nonproliferative and a proliferative setting.
Inhibition of TNTs sensitizes BCP-ALL cells to prednisolone. (A) Leukemic cell survival of patient ALL#6 cells cultured with or without MSCs after 5 days of prednisolone exposure (0.3 µg/mL). All graphs show percentage compared with untreated control. TNT signaling was inhibited by shaking or transwell conditions (1-tailed t test, unpaired). Quadruplicates represent 4 different sources of MSCs (MSC#1, MSC#2, MSC#6, MSC#7). (B) Leukemic cell survival of BCP-ALL cell line NALM6 cultured with or without MSCs after 5 days of prednisolone exposure. All graphs show percentage compared with untreated control. TNT signaling was inhibited by shaking or transwell conditions (1-tailed t test, unpaired). Triplicates represent 3 different sources of MSCs (hTERT, MSC#1, and MSC#2). Data are means ± SEM; *P ≤ .05, **P ≤ .01 (see also supplemental Figure 10).
Inhibition of TNTs sensitizes BCP-ALL cells to prednisolone. (A) Leukemic cell survival of patient ALL#6 cells cultured with or without MSCs after 5 days of prednisolone exposure (0.3 µg/mL). All graphs show percentage compared with untreated control. TNT signaling was inhibited by shaking or transwell conditions (1-tailed t test, unpaired). Quadruplicates represent 4 different sources of MSCs (MSC#1, MSC#2, MSC#6, MSC#7). (B) Leukemic cell survival of BCP-ALL cell line NALM6 cultured with or without MSCs after 5 days of prednisolone exposure. All graphs show percentage compared with untreated control. TNT signaling was inhibited by shaking or transwell conditions (1-tailed t test, unpaired). Triplicates represent 3 different sources of MSCs (hTERT, MSC#1, and MSC#2). Data are means ± SEM; *P ≤ .05, **P ≤ .01 (see also supplemental Figure 10).
Discussion
The presented study identifies TNT formation as a novel regulator of interaction between BCP-ALL cells and their bone marrow niche, which facilitates signaling from leukemic cells toward MSCs and affects the release of cytokines and chemokines in the microenvironment. Disruption of TNTs inhibits this release, decreases the survival benefit that MSCs provide to primary BCP-ALL cells, and sensitizes BCP-ALL cells to the important antileukemic drug prednisolone (supplemental Figure 11).
Relapse of leukemia is caused by a small number of leukemic cells that are able to withstand chemotherapy and can cause the complete reconstitution of the tumor. Leukemogenic mouse models show the importance of signaling between leukemic cells and their bone marrow microenvironment and emphasize the pathophysiological relevance of cytokines within the leukemic niche.1,47-49 However, a major shortcoming in our knowledge about the leukemic niche is the lack of insight into the functional mechanism mediating crosstalk between leukemic cells and their local niche. Our data add significant insight into this process and provide an opportunity to inhibit the leukemic niche. Importantly, primary BCP-ALL cells use TNTs to modulate their microenvironment, identifying the leukemic cell, and not MSCs, as the driver of niche modulation.
Several studies report that the leukemic niche can induce drug resistance for both classical chemotherapeutic agents and newly developed targeted therapies.9,44-46,50-52 The seminal papers by Straussman et al44 and Wilson et al45 revealed the widespread potential for growth-factor–driven resistance to kinase inhibitors in several tumor types. A recent study by Manshouri et al52 showed the induction of resistance against Janus kinase 2 (JAK2) inhibitors by bone marrow stroma-secreted cytokines in JAK2-mutated primary hematopoietic cells. BCP-ALL cells use TNTs to induce a proinflammatory cytokine signature53 within their microenvironment. These cytokines have been reported to be involved in leukemia survival and resistance to therapy, like IP10/CXCL10,52 IL-8,54 and monocyte chemotactic protein-1 (MCP-1)/CCL2.55 When TNTs were inhibited, this signature was partly reversed and simultaneously leukemic cell survival was decreased. Because these cytokines also have a chemoattractive function, it is likely that migration toward the stromal compartments of the niche and subsequent induction of contact-dependent signaling modules, like integrins and gap junctions, also play a role in this process. Furthermore, we observed TNT signaling from MSCs toward leukemic cells, which might also influence drug resistance of leukemic cells. For example, TNTs have been shown to transport drug-efflux pumps such as P-glycoproteins,24 and to transport mitochondria preferentially toward cancer cells.28
Although less pronounced as seen between ALL cells and MSCs, TNTs are also used for communication between leukemic cells. This discovery may reveal a new aspect of tumor heterogeneity. In many cancer types, clonal evolution has been observed.56 A recent study in T-cell ALL by Blackburn et al shows that leukemia subclones acquire mutations, which can mediate chemotherapy resistance even without prior drug exposure.57 Leukemic cells might exploit TNTs, which can transfer a broad spectrum of molecules and organelles like membrane-associated signaling molecules (eg, H-Ras19 ), to transfer mutant proteins and subsequently chemotherapy resistance between subclones.
Interestingly, we observed leukemia-specific cytokine patterns in MSC-ALL cocultures that were affected by abrogation of TNT signaling. This observation opens the discussion how TNT signaling can lead to the upregulation of different soluble factors. The broad spectrum of signaling molecules that are transported by TNTs potentially allows the ALL to convey specific messages to MSCs in order to differentially regulate the secretion of soluble factors by its microenvironment. In addition, leukemia is a highly heterogeneous disease consisting of different (cyto)genetic subtypes that also have individual heterogeneity with regards to their transcriptome and proteome.58 These factors are all likely to contribute to leukemia-unique demands for microenvironmental support.
Targeting TNT-directed communication between leukemic cells and their supportive niche may be a promising new approach to kill leukemic cells and prevent drug resistance in clinical practice. As of yet, no agents are available that induce specific inhibition of TNT signaling, but our data point to the importance to develop such agents. TNT signaling can be disrupted through shear stress, applying a physical distance between the cells, actin inhibition, and in some cases tubulin inhibition. In additional experiments, we observed that tubulin inhibition did not inhibit TNT signaling between BCP-ALL cells and MSCs (data not shown). The common building block for all TNTs reported in literature is F-actin, making it an obvious target for TNT disruption. Actin inhibitors are derived from fungi, plants, and sponges, which developed these toxins as a defense mechanism. Consequently, these compounds inhibit TNT formation (Figure 1E-F) and induce cell death (data not shown). Therefore, it is important to develop more specific and less-toxic small-molecule inhibitors that target elements of the actin cytoskeleton important for TNT formation. We propose our primary patient-derived ex vivo model system as a highly suitable platform to identify such inhibitors. Once identified, these TNT-specific agents will allow us to investigate TNT signaling also in vivo.
In conclusion, the discovery of TNT signaling between BCP-ALL cells and mesenchymal stromal cells adds significant insight into the mechanisms of communication in the leukemic niche. BCP-ALL cells use TNT networks to modify their healthy microenvironment and hereby create a leukemic niche that induces survival and drug resistance. Current chemotherapeutic regimens are primarily focused on combating tumor-intrinsic properties. Our data provide a new concept to develop alternative therapeutic strategies that include targeting of the leukemic niche in BCP-ALL.
The online version of this article contains a data supplement.
The publication costs of this article were defrayed in part by page charge payment. Therefore, and solely to indicate this fact, this article is hereby marked “advertisement” in accordance with 18 USC section 1734.
Acknowledgments
The authors thank all members of the Pediatric Oncology research laboratory of the Erasmus MC for their help in processing leukemic and mesenchymal stromal cell samples, in particular L. C. J. van den Berk, C. van de Ven, and F. Meijers-Stalpers; M. Buitenhuis and M. Bierings for critical discussions and reading of the manuscript; D. Geerts for scientific input and critical discussions; the Erasmus Optical Imaging Centre for providing support of confocal laser scanning microscopy (CLSM); the Department of Hematology of the Erasmus MC for providing the use of CLSM and Flow Cytometers; and the Vlietland Ziekenhuis for collecting and providing cord blood.
This work was supported by the KiKa Foundation (Stichting Kinderen Kankervrij–Kika-39), the Dutch Cancer Society (UVA 2008; 4265, EMCR 2010; 4687), the Netherlands Organization for Scientific Research (NWO–VICI M.L. den Boer), and the Pediatric Oncology Foundation Rotterdam.
Authorship
Contribution: R. Polak and B.d.R. designed the study, performed the experiments, collected and analyzed all data, and wrote the paper; M.L.d.B. designed the study, analyzed data, and wrote the paper; R. Pieters analyzed data and wrote the paper; and all authors discussed the results and approved the submitted manuscript.
Conflict-of-interest disclosure: The authors declare no competing financial interests.
Correspondence: Monique L. den Boer, Sophia Children’s Hospital, Erasmus MC, Wytemaweg 80, Room Na-1603, PO Box 2060, 3000 CB Rotterdam, The Netherlands; e-mail: m.l.denboer@erasmusmc.nl.
References
Author notes
R. Polak and B.d.R. contributed equally to this work and the study.

This feature is available to Subscribers Only
Sign In or Create an Account Close Modal