

Key Points
Dynein-dependent microtubule sliding drives proplatelet elongation under static and physiological shear stress conditions.
Proplatelet formation is a process that can be divided into repetitive phases: extension, pause, and retraction.
Abstract
Bone marrow megakaryocytes produce platelets by extending long cytoplasmic protrusions, designated proplatelets, into sinusoidal blood vessels. Although microtubules are known to regulate platelet production, the underlying mechanism of proplatelet elongation has yet to be resolved. Here we report that proplatelet formation is a process that can be divided into repetitive phases (extension, pause, and retraction), as revealed by differential interference contrast and fluorescence loss after photoconversion time-lapse microscopy. Furthermore, we show that microtubule sliding drives proplatelet elongation and is dependent on cytoplasmic dynein under static and physiological shear stress by using fluorescence recovery after photobleaching in proplatelets with fluorescence-tagged β1-tubulin. A refined understanding of the specific mechanisms regulating platelet production will yield strategies to treat patients with thrombocythemia or thrombocytopenia.
Introduction
The human body produces 1011 platelets daily to maintain hemostasis.1 Conditions that cause insufficient platelet production or accelerated platelet clearance pose a risk for death from bleeding complications and are of major clinical significance after acquired thrombocytopenia resulting from radiation exposure, chemotherapy, transplant, or surgery, as well as for patients with inherited thrombocytopenias.2 A detailed understanding of the underlying cytoskeletal mechanisms involved in platelet production will yield improved therapies for thrombocytopenia and thrombocythemia.
Blood platelets are derived from bone marrow megakaryocytes (MKs). MKs migrate to sinusoidal blood vessels, where they extend long cytoplasmic protrusions (proplatelets), from which they sequentially release platelet intermediates (preplatelets3 ) and platelets into the vasculature.4 The terminal stage of platelet production occurs in the bloodstream, where platelets attain their final shape and size.5,6
Reorganization of the MK cytoskeleton is critical to platelet production;7,8 however, the precise mechanisms involved remain poorly understood. An essential cytoskeletal protein is β1-tubulin, which dimerizes with α-tubulin and polymerizes into long microtubules that become bundled in the MK cortex when proplatelet extension begins. These microtubule bundles of mixed polarity run throughout the length of the proplatelet shafts and tips and are thought to provide the primary force for proplatelet elongation.7,9,10 Although microtubule forces are essential for proplatelet and platelet production, details on how they interact to extend proplatelets and release platelets are not defined. Three models have been proposed for how microtubule function might contribute to proplatelet elongation: cytoplasmic dynein-based sliding of overlapping, antiparallel microtubules past each other, which would push the ends of an extended proplatelet away from one another; the localized polymerization of microtubules within the proplatelet shaft; or the combination of both mechanisms. We have previously shown by expression of the microtubule end-binding protein (EB3) in MKs that microtubules continuously polymerize in vitro, growing at a rate ranging from 1.5 to 23.5 μm/minute, which is considerably faster than the average in vitro proplatelet extension rate of 0.85 μm/minute.11 Because the ability of MKs to form and extend proplatelet extensions was not impaired after incubation of cultured MKs with 100 nM nocodazole,11 a concentration that blocks microtubule assembly but does not depolymerize microtubules, tubulin polymerization per se is unlikely to be the primary driver of proplatelet elongation. Furthermore, we have shown that when permeabilized proplatelets are reactivated with ATP, proplatelet shafts elongated independent of microtubule polymerization. Conversely, overexpression of the dynactin-subunit dynamitin, a condition that results in dynactin disassociation and disrupts dynein function, inhibited proplatelet elongation.11 Although we hypothesized that microtubule sliding is responsible for proplatelet elongation and plays a pivotal role in platelet biogenesis, these experiments provided only indirect evidence for microtubule sliding; direct observations of sliding movements within growing proplatelets have not been reported.
Here we extend our findings by definitively showing that dynein-dependent microtubule sliding powers proplatelet elongation by using dynein function-modifying chemicals and directly visualizing microtubule sliding, using 2 quantitative fluorescence techniques: fluorescence recovery after photobleaching (FRAP) and fluorescence loss after photoconversion (FLAC). These microscopy tools allow us to directly measure microtubule sliding rates, demonstrating that microtubule sliding is a dynamic process whereby proplatelets can extend, pause, and retract. Finally, we capitalize on the recent development of a microfluidic platelet bioreactor to reveal that dynein-dependent microtubule sliding is necessary for proplatelet elongation under physiological shear stress and that shear forces accelerate proplatelet extension by reducing pause phases.
Methods
Research was conducted in accordance with the Declaration of Helsinki.
Reagents
Methylcellulose (STEMCELL Technologies Inc., Vancouver, BC, Canada), Ciliobrevin D, erythro-9-(2-hydroxy-3-nonyl)-adenine (EHNA; Calbiochem, San Diego, CA), nocodazole, taxol (Sigma-Aldrich, St. Louis, MO), and Na3VO4 (Santa Cruz Biotechnology, Dallas, TX) were used.
Primary mouse MK culture
Mouse fetal liver cell cultures were collected from wild-type CD1 mice (Charles River Laboratories, Wilmington, MA), and MKs were cultured as previously described.3 A bovine serum albumin (BSA) density gradient was used at culture day 3 to separate MKs from non-MK cells. If applicable, a second BSA density gradient was performed on the day of the experiment (day 4 or 5) to enrich for proplatelets. All studies complied with the Children’s Hospital Animal Care and Use Committee guidelines.
Expression of β1-tubulin in MKs
β1-tubulin-Dendra2-MSCV DNA was transfected into 293T cells by using the pCL vector system and the X-tremeGENE9 DNA Transfection Reagent (Roche Diagnostics, Indianapolis, IN). Subsequently, viral supernatant was collected and fetal liver cell-derived cells were infected in the presence of 10 μg/mL polybrene (Santa Cruz Biotechnology) under centrifugation. Cells were cultured at 37°C and 5% CO2.
Live cell microscopy
For shear stress cultures, MKs were loaded onto “naked” microfluidic bioreactors (only BSA-coated) and infused at 12.5 µL/hour during a 2-hour period, as previously described.12 For static cultures, isolated MKs were pipetted into chambers formed by mounting a glass cover slide coated with 3% BSA onto a 10-mm petri dish with a 1-cm hole, as previously described,7 and cultured for 24 hours. Both static and shear stress cultures were maintained at 37°C and 5% CO2 and examined on a Zeiss Axiovert 200 (Carl Zeiss, Thornwood, NY) equipped with a ×10 (numerical aperture, 0.30) Plan-Neofluar air objective. Differential interference contrast images were obtained using a Hamamatsu charged coupled device camera (Hamamatsu Photonics, Boston, MA) at either 2-second (shear stress cultures) or 20-minute (static cultures) intervals. Proplatelets were treated with 1 mM sodium orthanovanadate (Na3VO4), 1 mM EHNA, or 100 µM Ciliobrevin D, as indicated. Images were analyzed using the Metamorph version 7.7.2.0 image analysis software (Molecular Devices, Sunnyvale, CA) and ImageJ version 1.47p software (National Institutes of Health, Bethesda, MD).
Immunofluorescence microscopy
Released proplatelets were purified and probed, as previously described.13 Briefly, samples were fixed in 4% formaldehyde and centrifuged onto poly-L-lysine (1 μg/mL)-coated cover slides. Samples were permeabilized with 0.5% Triton-X-100 and blocked in immunofluorescence-blocking buffer (1% BSA, 0.05% sodium azide, 10% fetal calf serum in ×1 phosphate-buffered saline) overnight before antibody labeling.14 To delineate the microtubule cytoskeleton, samples were incubated with a rabbit polyclonal primary antibody for mouse β1-tubulin, as described previously.15 To correct for background fluorescence and nonspecific antibody labeling, slides were incubated with the secondary antibody alone, and all images were adjusted accordingly. Samples were examined with a Zeiss Axiovert 200 (Carl Zeiss) equipped with ×10 (numerical aperture, 0.30) Plan-Neofluar air and ×63 (numerical aperture, 1.4) Plan-ApoChromat oil immersion objectives, and images were obtained using a Hamamatsu charged coupled device camera (Hamamatsu Photonics). Images were analyzed using the Metamorph version 7.7.2.0 image analysis software (Molecular Devices) and ImageJ version 1.47p software (National Institutes of Health).
Cell size and morphological determinations
Cells were individually thresholded, and high-content cytoplasmic area and perimeter measurements were performed in ImageJ, using investigator-coded software, as outlined.12,15 Proplatelet elongation was quantified between the individual frames of time-lapse movies taken every minute. The length of proplatelets was measured in the individual frames, using ImageJ. A total of 250 images were measured. Analysis was confirmed by manual inspection of all samples, and improperly thresholded cells were excluded from the analysis. More than 2000 cells were counted for each condition, and analysis of proplatelet perimeter was performed for at least 4 independent samples. Statistical significance was established using a 2-tailed Student t test for paired samples. Error bars represent 1 standard deviation about the mean.
Image analysis
The digital images acquired in Metamorph were analyzed using ImageJ and Adobe Photoshop CS3 (Adobe Systems, San Jose, CA). Dividing lines explicitly separate different images or separate regions of the same image. No specific features within an image were enhanced, obscured, moved, removed, or introduced, and adjustments made to the brightness, contrast, and color balance were linearly applied to the whole image.
FRAP
Enriched proplatelets expressing β1-tubulin-Dendra2 were incubated with chemicals, as indicated. To assess β1-tubulin dynamics in proplatelets, infected cells in phenol-free CO2-independent medium were either seeded on a 3% BSA blocked 35-mm glass-bottom dish (MatTek, Ashland, MA) or infused into the microfluidic platelet bioreactor (blocked with 3% BSA). Images were captured on a Leica SP5 confocal microscope with a ×40 objective (Leica HCX PL APO CS 40× 1.25 oil). Regions of interest (ROIs) were photobleached (1.5 µm for 9 seconds in static cultures, 3 µm for 4 seconds in the microfluidic platelet bioreactor) by using the 488-nm argon laser line. Time-lapse images were acquired before and after (every 5 seconds for static cultures, every 0.661 seconds for microfluidic bioreactor) photobleaching.
Normalized fluorescence intensity was derived by fitting data to the following equation:
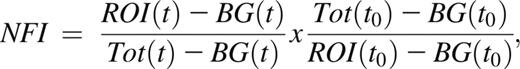
where BG stands for background, Tot for total, and t for time. Videos were analyzed with ImageJ version 1.45r software. Half-time of equilibration was calculated as described by Snapp et al.16 For determination of FRAP plateau point under static conditions, all intensity values after bleaching were compared with the measurement taken 35 seconds later. The point after which all comparative measurements differed by less than 1% for at least 3 consecutive comparisons, and subsequent values maintained no consistent increase, was taken as the FRAP plateau point. Determination of FRAP plateau point under dynamic conditions: each value was compared with the values taken 6 seconds later. When an increase of less than 0.1% recovery was observed for 2 of 3 consecutive comparative values and the subsequent values did not increase consistently, the initial point was taken as the FRAP plateau point.
Outlier values (>2%) in the plateau phase were excluded from the calculation of FRAP plateau point.
FLAC
FLAC methodology was performed as previously described.17 Briefly, cells expressing a photoconvertible fluorophore (Dendra2) were maintained in a 3% BSA blocked 35-mm glass-bottom dish (MatTek, Ashland, MA) with phenol-free CO2-independent medium at 37°C. An external 405-nm laser was coupled to a Zeiss Axiovert 405M microscope (objective: Zeiss ×100 1.3 oil iris) and used to illuminate a spot for 125 milliseconds, converting the β1-tubulin-Dendra2 from its green to a red fluorescent state. Time-lapse images of red fluorescence were acquired every 1.378 seconds, allowing photo-tagged tubulin to be tracked in time. Images were obtained with SPOT 5.0 software and a SPOT PURSUIT USB 1.4 Mp monochrome camera (SPOT Imaging Solutions, Sterling Heights, MI).
Microfluidics device
The microfluidics device used for the experiments was manufactured following the protocol published recently.18
Statistics
Results are presented as mean ± standard deviation. Differences were assessed by Student t test (*P < .05, **P < .01, ***P < .001).
Results
Proplatelets repeatedly elongate, pause, and retract during platelet production
MKs remodel their cell mass to form proplatelets (supplemental Figure 1A, available on the Blood Web site; supplemental Video 1). We followed fetal liver cell-derived MKs with proplatelets by time-lapse microscopy and observed that most proplatelets undergo cycles of behavior in which they elongate, pause, and then retract back to the MK cell body (supplemental Figure 1B-C; supplemental Video 2). Released proplatelets also elongate over time, pause, and retract (Figure 1; supplemental Video 3). These results demonstrate that proplatelet elongation is not a continuous process but, instead, occurs in bursts. Furthermore, proplatelets released from the MK body contain within their cytoplasm all motor proteins necessary to regulate their length. We quantified proplatelet length with time in MK cultures (Figure 1, length between proplatelet tips marked in red) and determined that proplatelets move in bursts up to 20 µm/minute (supplemental Figure 1D; 94.85% of events are in the range up to 20 µm/minute). The reported range of velocities includes all proplatelets that were not in an extended pause phase. Incorporation of the pause time reduces the rate of elongation to the previously determined average rate of ∼0.85 µm/minute.11

Released proplatelets can elongate, pause, and retract. Representative time-lapse differential interference contrast microscopy: released proplatelets in static tissue culture elongate, pause, and retract over time. Scale bar is 10 µm. Red arrows indicate proplatelet tips.
Released proplatelets can elongate, pause, and retract. Representative time-lapse differential interference contrast microscopy: released proplatelets in static tissue culture elongate, pause, and retract over time. Scale bar is 10 µm. Red arrows indicate proplatelet tips.
To track microtubule mobility during proplatelet elongation, we expressed β1-tubulin-Dendra2 in MKs and used FLAC Microscopy.17 FLAC enables spots to be marked along the proplatelet shafts by irreversibly photoconverting the fluorophore Dendra219 from its green to a red fluorescent state with a 405-nm laser source, as illustrated by supplemental Figure 2A. In Figure 2, 2 spots of the proplatelet shaft were photoconverted and followed over the course of 46 minutes (supplemental Video 4). During proplatelet elongation, microtubules comprising the proplatelet shaft slid into the proplatelet tip, which was accompanied by twisting and bending the proplatelet shaft. The rate of the photoconverted β1-tubulin spot moving toward the proplatelet tip was, on average, 0.72 μm/minute, which is characteristic of the proplatelet elongation rate, ranging from 0.30 to 1.59 μm/minute in culture conditions (average rate, 0.85 μm/minute).11 Sliding of the proplatelet shaft into the proplatelet tip was interrupted by multiple pause phases. Here, the fastest unidirectional rate of proplatelet elongation reached 6.3 μm/minute (Figure 2). These data reveal that faster net extension/retraction rates apply to the cytoskeleton-dependent process of proplatelet formation than previously proposed because proplatelets spend considerable time in pause when in culture.

FLAC microscopy enables labeling and observation of proplatelet regions. Representative images of FLAC microscopy performed with MKs expressing β1-tubulin-Dendra2. Two ROIs (white arrows) were photoconverted with a 405-nm laser. Diamond: proplatelet tip. Scale bar is 20 µm. Phases were selected on the basis of an inflection point of the curve.
FLAC microscopy enables labeling and observation of proplatelet regions. Representative images of FLAC microscopy performed with MKs expressing β1-tubulin-Dendra2. Two ROIs (white arrows) were photoconverted with a 405-nm laser. Diamond: proplatelet tip. Scale bar is 20 µm. Phases were selected on the basis of an inflection point of the curve.
Microtubule sliding drives proplatelet extension and is dependent on cytoplasmic dynein in static tissue culture
To study microtubule sliding in vitro, released proplatelets were incubated with the broad-spectrum cytoplasmic dynein inhibitor Na3VO4, EHNA, or the recently described AAA+ ATPase motor cytoplasmic dynein inhibitor, Ciliobrevin D.20,21 The analysis of the mean proplatelet perimeter of several thousands of individual proplatelets over time was automated to quantify proplatelet elongation and was compared with no-drug controls (supplemental Figure 3A-B). Untreated proplatelets consistently increased their mean proplatelet perimeter within the 9-hour observation period (Figure 3; supplemental Figures 3C and 4). However, proplatelets treated with Na3VO4 or EHNA were significantly shorter at the 6-hour mark (Figure 3) and demonstrated no further elongation during the next 3 hours (supplemental Figure 5, representative images; supplemental Video 5, Na3VO4; supplemental Video 6, EHNA). Although Ciliobrevin D treatment reduced the mean proplatelet perimeter when added at the 6-hour point, the effect of Ciliobrevin D treatment was not significant unless it was added at the 0-hour point (Figure 3). These data show that cytoplasmic dynein is critical for proplatelet elongation of cultured MKs.

Proplatelets become shorter after inhibition of dynein function. Mean proplatelet perimeter increases by ∼1.5-fold over the course of 9 hours during static tissue culture. The addition of 1 mM Na3V04 or EHNA (broad-spectrum cytoplasmic dynein inhibitors) at 6 hours inhibits further proplatelet elongation. Comparable inhibition of proplatelet elongation was attained with 100 µM Ciliobrevin D (specific cytoplasmic dynein inhibitor) when added at 0 hours, but not at 6 hours, of culture. Analyses were performed for at least 4 independent samples. Error bars represent 1 standard deviation about the mean. Statistical significance was established using a 1-tailed Student t test for paired samples (**P < .01, *P < .05).
Proplatelets become shorter after inhibition of dynein function. Mean proplatelet perimeter increases by ∼1.5-fold over the course of 9 hours during static tissue culture. The addition of 1 mM Na3V04 or EHNA (broad-spectrum cytoplasmic dynein inhibitors) at 6 hours inhibits further proplatelet elongation. Comparable inhibition of proplatelet elongation was attained with 100 µM Ciliobrevin D (specific cytoplasmic dynein inhibitor) when added at 0 hours, but not at 6 hours, of culture. Analyses were performed for at least 4 independent samples. Error bars represent 1 standard deviation about the mean. Statistical significance was established using a 1-tailed Student t test for paired samples (**P < .01, *P < .05).
To further resolve the kinetics driving proplatelet elongation, we applied FRAP microscopy22 to released proplatelets expressing β1-tubulin-Dendra2. A 488-nm laser was used to bleach a 1.5-μm spot, and fluorescence recovery rates were determined as illustrated in supplemental Figure 2B. Representative images are shown in Figure 4A. ROIs were photobleached from 100% to 19.8% ± 0.07% fluorescence intensity and recovered to 72% ± 0.15% within 300 seconds in control proplatelets (Figure 4B; supplemental Video 7). The recovery plateaued after ∼255 seconds, with a half-time of equilibration (time to 50% of fluorescence recovered in photobleached zones) requiring 55 seconds. Incomplete recovery (approximately 30%) is most likely a result of a portion of microtubules in the bleached bundle region not contributing to fluorescence recovery (immobile microtubule fraction). Figure 4C shows that when proplatelets were incubated with 100 nM nocodazole, to prevent new tubulin polymerization, fluorescence recovery occurred, suggesting new tubulin polymerization is dispensable for fluorescence recovery. A maximum fluorescence intensity of 61.3% ± 0.11% was obtained within 300 seconds of photobleaching (Figure 4C; supplemental Video 8). The plateau was reached after ∼215 seconds with a shorter half-time of equilibration at 30 seconds compared with the control sample. Proplatelets treated with 1 mM EHNA (Figure 4D; supplemental Video 9) or 100 μM Ciliobrevin D (Figure 4E; supplemental Video 10) were unable to recover fluorescence in the photobleached zones. Stabilization of microtubules with 10 μM taxol significantly abolished fluorescence recovery of the infected proplatelets (Figure 4F; supplemental Video 11). Because the bleach spots remain near their original bleached positions and recovery does not require addition of tubulin dimers to microtubule ends, microtubules in the bundles must be sliding in both directions to effect recovery, and doing so at rates of 1.64 to 3 µm/minute. Taken together, these data show that dynein-dependent microtubule sliding (and not microtubule polymerization) drives proplatelet elongation in static tissue culture MKs.

Strongly decreased FRAP in proplatelets treated with cytoplasmic dynein inhibitors. (A) Representative images of time-lapse microscopy after photobleaching of ROIs (dashed arrows). White arrow in zoomed area indicates microtubule entering photobleached ROI. Indicated numbers represent seconds. pre, before photobleaching. Scale bar is 10 µm. (B-F) Cells were preincubated with indicated agonists, and fluorescence intensity in photobleached ROI was measured. n = at least 10 per condition. P values after photobleaching: nocodazole treatment to control: before t = 255 seconds (not significant), and after t = 255 seconds (not significant, **P < .01, *P < .05); EHNA treatment to control (***P < .001, **P < .05), and Ciliobrevin D and taxol treatment to control (***P < .001 for all time points).
Strongly decreased FRAP in proplatelets treated with cytoplasmic dynein inhibitors. (A) Representative images of time-lapse microscopy after photobleaching of ROIs (dashed arrows). White arrow in zoomed area indicates microtubule entering photobleached ROI. Indicated numbers represent seconds. pre, before photobleaching. Scale bar is 10 µm. (B-F) Cells were preincubated with indicated agonists, and fluorescence intensity in photobleached ROI was measured. n = at least 10 per condition. P values after photobleaching: nocodazole treatment to control: before t = 255 seconds (not significant), and after t = 255 seconds (not significant, **P < .01, *P < .05); EHNA treatment to control (***P < .001, **P < .05), and Ciliobrevin D and taxol treatment to control (***P < .001 for all time points).
Proplatelet elongation and dynein-dependent microtubule sliding under physiologic shear stress
To produce platelets in situ, bone marrow MKs extend proplatelets through gaps/fenestrations in endothelial cells lining sinusoidal blood vessels. Proplatelets penetrating through the vascular sinusoids experience vascular shear stresses that trigger proplatelet elongation and platelet release. To determine how these physiologically relevant shear stresses affect microtubule sliding, we studied proplatelet movements made when isolated fetal liver cell-derived mouse MKs were infused into a biomimetic platelet bioreactor that recapitulates sinusoidal blood vessel architecture and flow profile.12 Briefly, this bioreactor comprises 2 parallel microfluidic channels (an upper and a lower channel) that are separated by a series of columns spaced 1 to 2 μm apart. MKs in culture media are infused in the upper channel, and flow is directed through the gaps between the columns, so that the media exits from the lower channel. MKs are trapped between columns because of their size, and shear stress triggers proplatelet formation and platelet release in the lower channel. Proplatelets contain beaded swellings and platelet-sized tips that are morphologically and structurally identical to in vivo proplatelet production, as documented by Two-Photon microscopy.5,23,24 Proplatelets formed by MKs within the platelet bioreactor elongated, on average, at a rate of 30 μm/minute (Figure 5A; supplemental Video 12; supplemental Figure 1E; Thon et al12 ), which is a much higher rate than the average rate measured for proplatelet formation in culture11 and more accurately reproduces proplatelet extension rate in vivo. Next, we treated mouse MKs in the bioreactor with drugs that interfere with different aspects of microtubule function. We determined that 100 nM nocodazole (an inhibitor of tubulin polymerization) had no effect on proplatelet formation (Figure 5B; supplemental Video 13), whereas treatment with 1 mM EHNA reduced proplatelet formation from 90% to 26% in the platelet bioreactor (Figure 5C; supplemental Video 14; Thon et al12 ). We then employed FRAP on proplatelets expressing β1-tubulin-Dendra2 in the platelet bioreactor and photobleached 3-μm zones in the proplatelet shafts. In control-treated (Figure 6A representative control images; supplemental Video 15; Figure 6B) and nocodazole-treated (Figure 6B) samples, photorecovery occurred rapidly, within 30 seconds, and plateaued at 48.4% ± 16.7% and 58.6% ± 14.8%, respectively. The half-time of equilibration was 6 seconds in control and 8 seconds in nocodazole-treated samples, respectively (values are summarized in supplemental Figure 6). Critically, EHNA-, Ciliobrevin D- (Figure 6B), Na3VO4-, or taxol-treated (supplemental Figure 7) proplatelets were unable to recover fluorescence in the bleached area after photobleaching.

Proplatelet elongation is caused by cytoplasmic dynein-dependent microtubule sliding, and not tubulin polymerization. Primary mouse MKs were (A) untreated, incubated with (B) 100 nM nocodazole (microtubule polymerization inhibitor), or (C) 1 mM EHNA (cytoplasmic dynein inhibitor) before infusion into the microfluidic bioreactor. Whereas nocodazole treatment had no visible effect on shear-induced proplatelet production and proplatelet elongation compared with no-drug controls (Thon et al12 ), inhibition of cytoplasmic dynein visibly reduced both. Scale bars are 50 µm.
Proplatelet elongation is caused by cytoplasmic dynein-dependent microtubule sliding, and not tubulin polymerization. Primary mouse MKs were (A) untreated, incubated with (B) 100 nM nocodazole (microtubule polymerization inhibitor), or (C) 1 mM EHNA (cytoplasmic dynein inhibitor) before infusion into the microfluidic bioreactor. Whereas nocodazole treatment had no visible effect on shear-induced proplatelet production and proplatelet elongation compared with no-drug controls (Thon et al12 ), inhibition of cytoplasmic dynein visibly reduced both. Scale bars are 50 µm.

Strongly decreased FRAP in proplatelets treated with cytoplasmic dynein inhibitors in platelet bioreactor. (A) Representative images of time-lapse microscopy of control MKs expressing β1-tubulin Dendra2 that were infused into the platelet bioreactor. FRAP was performed on formed proplatelets. White dashed arrow indicates flow direction. Dashed area indicates packs. Gap width is 1 to 2 μm. White arrows indicate photobleached ROI. Indicated numbers represent seconds. pre, before photobleaching. Scale bar is 20 µm. (B) Cells were preincubated with indicated agonists, and fluorescence intensity in photobleached ROI was measured. n = at least 5 per condition. P values after photobleaching: nocodazole treatment to control, not significant; EHNA treatment to control (**P < .01, *P < .05), except t = 8, 26, and 28 seconds; and Ciliobrevin D treatment to control (**P < .01, *P < .05 for all points).
Strongly decreased FRAP in proplatelets treated with cytoplasmic dynein inhibitors in platelet bioreactor. (A) Representative images of time-lapse microscopy of control MKs expressing β1-tubulin Dendra2 that were infused into the platelet bioreactor. FRAP was performed on formed proplatelets. White dashed arrow indicates flow direction. Dashed area indicates packs. Gap width is 1 to 2 μm. White arrows indicate photobleached ROI. Indicated numbers represent seconds. pre, before photobleaching. Scale bar is 20 µm. (B) Cells were preincubated with indicated agonists, and fluorescence intensity in photobleached ROI was measured. n = at least 5 per condition. P values after photobleaching: nocodazole treatment to control, not significant; EHNA treatment to control (**P < .01, *P < .05), except t = 8, 26, and 28 seconds; and Ciliobrevin D treatment to control (**P < .01, *P < .05 for all points).
Together, these data show that dynein-dependent microtubule sliding is responsible for proplatelet elongation under physiologically relevant shear stress, whereas tubulin polymerization is dispensable for this process.
Discussion
Although microtubule sliding has been proposed to drive proplatelet elongation,25 direct proof has been lacking. Here, we directly visualize microtubule movements in proplatelets after FLAC17 or FRAP22 microscopy and provide definitive evidence that dynein-dependent microtubule sliding is crucial for proplatelet elongation in both static cultures and under physiologically relevant shear stress.
We previously reported that microtubules continuously grow within the microtubule bundles of elongating proplatelets in a reaction that is associated with EB3 complexes at the high-affinity microtubule ends. Because EB3 moved in both directions within these proplatelet bundles, and with a highly variable rate of movement (1.5-23.5 μm/minute), we concluded that bundles have mixed microtubule polarity and that end growth is superimposed on sliding microtubule movements.11 However, inhibitory studies clearly revealed that microtubule assembly is not required per se for proplatelet elongation, as diminishing microtubule assembly at the high-affinity ends of microtubules with low doses (100 nM) of nocodazole did not slow or prevent proplatelet elongation.11 In addition, the sliding of microtubules within the bundles of permeabilized proplatelets could be induced with ATP, indicative of energy-dependent motor protein involvement in proplatelet elongation.11 Finally, overexpression of the dynamitin (p50) subunit in MKs, which dissociates the p150 subunit from the dynactin complex and inactivates it, grossly decreased proplatelet formation and generated abnormal proplatelets.11 Hence, we hypothesized that dynein, which complexes with dynactin, was the motor protein affected and is responsible for sliding microtubules relative to one another to effect proplatelet elongation.
Here we have employed FRAP-based microscopy22 to quantify microtubule movements in proplatelets and inhibited microtubule growth or dynein function to dissect their roles in proplatelet movements. Half-times for the recovery of equilibration (t1/2) fluorescent values (time to 50% of fluorescence recovered in photobleached zones) is a quantitative measure of microtubule sliding. Microtubule sliding rates in released proplatelets were 1.64 to 3 μm/minute in culture when the proplatelets were neither elongating nor retracting (paused) but were strikingly accelerated to 30 μm/minute in the presence of fluid flow when proplatelets were being rapidly elongated. Although the average microtubule sliding rates, as determined by FRAP studies, are in agreement with previously reported proplatelet elongation rates under static11 and physiological shear stress conditions,12 detailed studies on the formation of proplatelets revealed that they undergo rapid extensions and retractions, and do so repeatedly in the absence of fluid flow. Moreover, although the prevention of microtubule growth did not alter proplatelet elongation or the recovery from FRAP, the widely used dynein inhibitor, EHNA, and the AAA+ ATPase motor cytoplasmic dynein inhibitor, Ciliobrevin D, prevented both proplatelet elongation and fluorescence recovery in proplatelets.
Ciliobrevin D was highly effective in preventing fluorescence recovery (microtubule sliding) in our FRAP experiments. In a similar fashion, Ciliobrevin D significantly decreased proplatelet elongation when it was added at the beginning of the observation period (time point, 0 hours), although it was less effective when added later (time point, 6 hours). Because the FRAP experiments were performed within minutes after drug treatment, they are likely to be the best reporter of drug inhibition, as the culture experiments were performed on the hour time scale. The underlying molecular mechanism by which taxol inhibited microtubule sliding is unclear and requires further investigation. The microtubule sliding rate determined in the presence of nocodazole (3 μm/minute) was slightly increased compared with control samples in static conditions, and the recovery attained equilibrium earlier. This indicates that the slow phase of recovery is mediated by tubulin polymerization, either as de novo formed microtubules or by the addition of labeled dimers onto the ends of microtubules in the bleached zone. The total fluorescence recovery after nocodazole treatment, however, was slightly reduced compared with the no-drug control, which might be indicative of minor tubulin depolymerization over time.
It has been previously suggested11 that microtubule movements within bundles are more complex than simple sliding, as microtubule cross-linking or twisted microtubules may influence the direction of net microtubule movement. Detailed analysis of our FRAP videos revealed that the FRAP region in static conditions recovered from both directions, which is indicative of microtubule sliding occurring equally in both directions within a proplatelet over short distances, and spots marked by the FLAC method moved relative to the cell. We conclude from these observations that efficient net proplatelet outward movement before proplatelet release requires microtubule sliding away from resistive forces such as the mass of the MK cell body. Once the proplatelet is released, sliding may distribute the forces evenly, and sliding forces may now serve primarily to subfragment the proplatelet. Although super-resolution microscopy might be a valuable technique to observe single microtubules passing each other, it will be necessary to overcome the requirement of high laser power and the long acquisition time before direct visualization of this mechanism by super-resolution microscopy becomes possible.
Platelet elaboration in the presence of fluid flow requires dynein-dependent microtubule sliding and, importantly, the shear forces produced in the bioreactor accelerate proplatelet extension into the range observed in vivo. Proplatelets in the bioreactor extend ∼30 to 40 times faster than the average extension rate in culture and ∼1.5 to 7 times faster than the fastest rate measured in cultured MKs when the pause phases are ignored. This might be explained by additional shear stresses in the microfluidic device possibly triggering enhanced dynein function or recruiting more dynein to the proplatelet shafts. It is unlikely that the flow itself is responsible for an increased rate of proplatelet elongation, as the flow rate is significantly higher than the proplatelet elongation rate,12 and proplatelet pause and retraction phases still occurred under shear stress. Moreover, proplatelet elongation was significantly decreased by the dynein inhibitors EHNA, Ciliobrevin D, and Na3VO4, which shows that elongation under flow remains a dynein-dependent process. The plateau of fluorescence intensity recovery was ∼20% lower in the platelet bioreactor than in culture experiments, suggesting that the immobile fraction of microtubules is higher in rapidly elongating proplatelet projections. The morphology of the proplatelets was also altered by flow, as proplatelet shafts were narrowed compared with those in culture. The rapid release of proplatelets from the MKs prohibited us from making measurements over a longer time scale. Critically, photobleached spots within the shafts of proplatelets rapidly extruded into the flow moved outward in sync with the rate of proplatelet elongation. This demonstrates that microtubule sliding in this case is predominately toward the tips of the proplatelet.
It is unclear why MKs undergo these different phases of proplatelet formation (ie, proplatelet elongation, pause, and retraction). However, this process is not limited to mouse MKs. MKs from human umbilical cord blood form branched proplatelets that frequently pause and retract (supplemental Video 16) in similar fashion to mouse MKs (Figure 1). Furthermore, proplatelets of primary human MKs elongate and retract when infused into the platelet bioreactor, suggesting similar mechanisms are used by human and mouse proplatelets (supplemental Figure 8; supplemental Video 17) and that fetal liver-derived MKs are as appropriate as human MKs for studies of motile mechanics.
It was recently26 shown that dynein slides microtubules apart to reorganize the marginal microtubule band of the resting platelet after activation. These forces extend the marginal band and induce coiling and are followed by actomyosin-mediated compression forces. Our data suggest that proplatelets may release platelets from their ends by sliding their microtubules apart and then refusing the plasma membranes of the daughter fragments. The rolling up of microtubules as they drive apart is likely to be involved in forming the coils found in the proplatelet tips and the mature platelets. The mechanics of this process need to be resolved, and we propose that the techniques described in this manuscript may offer useful tools to address this important question.
In summary, we show that dynein-dependent microtubule sliding drives proplatelet extension in static and dynamic systems. We suggest that the platelet bioreactor will be a useful tool to study platelet biogenesis in genetically modified mouse lines with defects in the microtubule system. Furthermore, a high number of fluorescently labeled platelets can be generated from infected MKs, which enables studying functional consequences bypassing difficulties with platelet transfection.
The online version of this article contains a data supplement.
There is an Inside Blood Commentary on this article in this issue.
The publication costs of this article were defrayed in part by page charge payment. Therefore, and solely to indicate this fact, this article is hereby marked “advertisement” in accordance with 18 USC section 1734.
Acknowledgments
We are very thankful to the David A. Weitz laboratory (School of Engineering and Applied Sciences/Department of Physics, Harvard University, Cambridge, MA), the Harvard Materials Research Science and Engineering Center (DMR-0820484), and the National Science Foundation (DMR-1310266). We also thank Adrian Pegoraro and Tom Kodger for help with the confocal microscope and Karin M. Hoffmeister, Antonija Jurak-Begonja, Mehrshad Aschmann, and Hervé Falet for helpful suggestions throughout the study.
M.B. was supported with a postdoctoral fellowship (BE 5084/1-1) by the Deutsche Forschungsgemeinschaft. This work was supported in part by National Institutes of Health, National Heart, Lung, and Blood Institute grants 1K99HL114719-01A1 (J.N.T) and R01Hl68130 (J.E.I.), and National Institute of Diabetes and Digestive and Kidney Disease grant DK083592 (A.J.E.). L.M. was supported by Marie Curie International Outgoing Fellowship (300121).
Authorship
Contribution: M.B. and J.N.T. designed and performed the experiments, analyzed the data, and wrote the manuscript; A.J.E. designed and performed the experiments, analyzed the data, and contributed to writing the manuscript; S.W. performed experiments. L.M. designed and fabricated the microfluidic bioreactors; E.D. and M.S.-V. generated the human cord blood MK cultures; J.E.I. designed the experiments, analyzed the data, and contributed to writing the manuscript; and J.H.H. designed the experiments, analyzed the data, and wrote the manuscript.
Conflict-of-interest disclosure: J.N.T., L.M., and J.E.I. are founders of and have financial interest in Platelet BioGenesis, a company that aims to produce donor-independent human platelets from human induced pluripotent stem cells at scale. J.N.T., L.M., and J.E.I. are inventors on this patent. J.N.T. and J.E.I.’s interests were reviewed and are managed by the Brigham and Women’s Hospital and Partners HealthCare, in accordance with their conflict-of-interest policies. L.M.’s interests are managed by Harvard University, in accordance with their conflict-of-interest policies. The remaining authors declare no competing financial interests.
Correspondence: Markus Bender, Brigham and Women’s Hospital, 1 Blackfan Circle, Karp 6, Boston, MA 02115; e-mail: mbender1@partners.org.
