Key Points
We determined the location of gal3bp and gal3 and their role in promoting VT and leukocyte/endothelial cell interactions for the first time.
Gal3bp and gal3 have the potential to be used as targets for future VT therapies.
Abstract
Galectin-3–binding protein (gal3bp) and its receptor/ligand, galectin-3 (gal3), are secreted proteins that initiate signaling cascades in several diseases, and recent human proteomic data suggest they may play a role in venous thrombosis (VT). We hypothesized that gal3bp and gal3 may promote VT. Using a mouse stasis model of VT, we found that gal3bp and gal3 were localized on vein wall, red blood cells, platelets, and microparticles, whereas leukocytes expressed gal3 only. Gal3 was dramatically increased during early VT and gal3bp:gal3 colocalized in the leukocyte/endothelial cell interface, where leukocytes were partially attached to the vein wall. Thrombus size correlated with elevated gal3 and interleukin-6 (IL-6) vein wall levels. Recombinant gal3 promoted VT and increased vein wall IL-6 mRNA. Although recombinant gal3 restored the VT size in gal3−/− mice, it had no effect on IL6−/− mice, suggesting that gal3:gal3bp promotes VT through IL-6. Moreover, significantly fewer activated neutrophils were present in the gal3−/− vein walls. In a group of human patients, elevated circulating gal3bp correlated with acute VT. In conclusion, gal3bp:gal3 play a critical role in VT, likely via IL-6 and PMN-mediated thrombotic mechanisms, and may be a potential biomarker in human VT.
Introduction
In the United States, an estimated 900 000 people are affected by venous thrombosis (VT)/pulmonary embolism (PE) annually.1 Causes for VT were originally identified to be blood stasis, hypercoagulability, and changes in the vein wall expression of procoagulant adhesion molecules.2 However, in the 1970s, inflammation was added as a contributing factor to VT.3 If not treated acutely, VT/PE is a morbid and life-threatening condition, and the Centers for Disease Control and Prevention estimate that as much as 30% of persons affected will die within 1 month of their initial diagnosis.4 The current standard treatment is anticoagulation therapy, but this carries significant bleeding risks. Intracranial hemorrhage occurs in 1.15% of patients receiving anticoagulation therapy each year, with a case fatality rate (major bleeding) of 13%.4 Therefore, it is imperative that continuous methods for safe, cost-effective therapies for VT be established.
Galectin-3–binding protein (gal3bp), a 60- to 90-kDa protein, and its receptor/ligand, galectin-3 (gal3), a ∼35-kDa protein, are secreted proteins that can interact with each other to promote cell-to-cell adhesion and initiate pathologic, proinflammatory signaling cascades.5-8 Both gal3bp and gal3 are found in most normal adult tissues, mainly in epithelial and myeloid/amoeboid cells,9 but to our knowledge they have never been previously explored in platelets (PLTs), red blood cells (RBCs), microparticles, vein walls, and venous thrombus, all critical elements that participate in VT. Gal3 is found within the nucleus, cytoplasm, cell surface, and extracellular space as a monomer, or multimer, or it is fragmented as a result of enzymatic cleavage.10 Gal3 multimerization is known to have physiologic consequences, such as enhancing the ability of gal3 to facilitate cell-to-cell interactions.11,12 Gal3bp and gal3, in both its monomeric and multimeric forms, are thought to play pathologic roles in a number of diseases such as cancer and rheumatoid arthritis.7,8,13,14 In cancer, gal3bp and both gal3 monomers and multimers contribute to metastasis by promoting cell-cell adhesion.7,9,13 Exogenous gal3, administered IV to mice or directly to cultured cells in doses intended to mimic the amount of circulating gal3 observed in patients with inflammatory diseases (1-10 μg/mL), induces the secretion of interleukin-6 (IL-6), CCL2, the mouse version of human MCP1, and tumor necrosis factor (TNF)-α.9 Both cell-cell adhesion and inflammation are mechanisms deeply involved in VT.2,3 The importance of IL-6 was recently highlighted in the context of VT in the same animal model as was used in the present work. Wojcik et al showed that neutralizing IL-6 significantly reduces VT via reductions in CCL2.15 Although gal3bp and gal3 have been shown to be important in a number of diseases, their role in VT has yet to be investigated.
In prior studies from our laboratory, high levels of gal3bp were detected in procoagulant, circulating microparticles from patients with VT.2 These findings led us to investigate gal3bp and gal3 to define the role they play in VT.2,16 We hypothesized that gal3bp and gal3 promote VT. The purpose of this study was to determine (1) whether gal3bp and gal3 are prothrombotic; (2) the location of gal3bp and gal3 in solid tissue (vein wall and thrombus) and blood (RBCs, white blood cells [WBCs], PLTs, and microparticles); (3) the proinflammatory properties of gal3bp and gal3 during VT, and whether the induction of IL-6 through gal3 promotes thrombosis; and (4) whether gal3bp and gal3 are associated with VT in humans.
Methods
Animals
Male mice (n = 244), 8 to 10 weeks old (20-25 g) and all of the C57BL/6 strain background, were used. This included wild-type (WT) and gal3 knockout (KO), and IL-6KO mice (Jackson Laboratories, Bar Harbor, ME; stock #006338 and #002650, respectively).
Inferior vena cava stasis model
Surgery.
Mice were anesthetized with isofluorane and inferior vena cava (IVC) ligation was performed as previously described.17 Treatments were given 24 hours before surgery (Day −1) and mice were killed at 3 hours, 6 hours, and 48 hours postligation, as previously described.17 Non-VT mice did not undergo surgery. The number of animals per experiment is described in the figure legends.
Gal3bp antibody treatment.
Mice received one dose of anti-mouse gal3bp antibody (Abcam, Cambridge, MA), 20 g diluted in saline or an equal volume of saline via intraperitoneal injection.
Gal3 treatment.
Mice received one dose of human recombinant galectin-3 (rGal3; Peprotech, Rocky Hill, NJ), 5 μg diluted in saline or an equal volume of saline given IV.
Harvest.
Blood was collected from the retro-orbital venous sinus, to prevent platelet activation, into a tube containing sodium citrate (3.2%). The IVC and associated thrombi were removed and weighed in grams (thrombus weight). Vein wall samples were immersed in 1.0 mL TRIzol (Invitrogen, Grand Island, NY), homogenized, and then frozen in preparation for quantitative real-time polymerase chain reaction (qRT-PCR) analysis, or they minced finely using a scalpel and placed in 1% sodium dodecyl sulfate preparation for western blot analysis. For histology, the IVC, aorta, and surrounding tissues were removed as previously described.15
Isolation of PLTs, microparticles, and WBCs
PLT, microparticle, and leukocyte isolation.
See supplemental Methods, available on the Blood Web site.
Western blot analysis
Western blot analyses were performed using 7 μg protein per lane, and 4% to 12% bis-Tris NUPAGE gels (Bio-Rad Laboratories, Inc., Hercules, CA). Gels were run in 1× 3-(N-morpholino)propanesulfonic acid buffer for 60 minutes at 150 V, followed by 15 minutes at 200 V. Membranes were blocked with 5% bovine serum antigen (BSA) in Tween–Tris-buffered saline (TTBS) before incubation with antibodies. Membrane-bound gal3bp was detected using a rabbit anti-mouse gal3bp antibody (Abcam); 1:500, 5% BSA in TTBS, and gal3 using a Rat anti-mouse gal3 antibody (R&D Systems, Minneapolis, MN); and 1:100, 5% BSA in TTBS. Membrane-bound IL-6 was detected using a rabbit anti-mouse antibody (1:500, 5% BSA in TTBS; Abcam). Membrane-bound β-actin was detected using a horseradish peroxidase–conjugated mouse anti-bird β-actin antibody (Santa Cruz Biotechnology, Dallas, TX) 1:2000, 5% BSA in TTBS. Appropriate secondary antibodies were used. Membranes were visualized using the Bio-Rad Gel-Doc Imager, and band intensity was quantified using the Bio-Rad Gel-Doc Imager’s Volume Analysis Tool.
Histology
Hematoxylin and eosin (H&E), immunohistochemistry (IHC), and immunofluorescence (IF) were performed on non-VT 3 hours, 6 hours, and 48 hours postligation on IVC and IVC and thrombus samples.
H&E.
H&E stain was prepared as previously described.18
Immunohistochemistry for Gal3.
IHC was prepared as previously described and stained for gal3. Primary antibodies were diluted in mouse anti-mouse gal3 (1:500, Novus Biologicals, Littleton, CO). A mouse-on-mouse (MOM) kit was used to reduce background noise. Secondary antibody and avidin-biotin complex steps, followed by color development with 3,3′-diaminobenzidine (DAB) substrate and then slides were counterstained with hematoxylin QS (all reagents from Vector Laboratories, Burlingame, CA).
IHC for leukocytes.
Slides were depariffinized and rehydrated using xylene, graded ethanol, and water. Antigen retrieval was performed using 10 mM sodium citrate (1.47 g in 500 mL dH20 pH to 6.0) for 5 minutes at 30% power in a microwave. Endogenous peroxide activity was blocked by soaking slides in 3% H2O2 in methanol for 10 minutes and then blocked in 2.5% normal goat serum (blocking buffer) for 30 minutes. Rat anti-mouse Ly-6G was diluted (1:1000, 0.5 μg/mL) in 2.5% normal goat serum, placed on slides, and incubated for 30 minutes. The control tissue received no primary antibody. Impress anti-rat Ig solution containing peroxidase was added to all slides (Vector Laboratories). Slides were color developed with DAB substrate (Vector Laboratories) for 1 minute, and then the reaction was stopped by putting slides in distilled water. Slides were counterstained with Hematoxylin QS (Vector Laboratories) for 45 seconds, washed in distilled water, and then cover-slipped when dry.
IF.
Samples were cryopreserved, cut into 6-μ sections, and probed for gal3bp and gal3. Primary antibodies were diluted for gal3bp and gal3, as described previously. Gal3bp was secondarily labeled with a fluorescein isothiocyanate (FITC)-conjugated antibody (Thermo Scientific Pierce, Waltham, MA) and gal3 was secondarily labeled with Texas Red dye.
qRT-PCR: Gal3bp, gal3, IL-6, and CCL2 IVC wall gene expression
RNA was isolated by homogenizing IVC samples in TRIzol reagent, as per the manufacturer’s protocol. Of the total RNA, 5 μg was reverse transcribed using Oligo dT, RNaseOUT, and Moloney murine leukemia virus reverse transcriptase (all from Invitrogen, Grand Island, NY). Gene expression determinations used commercially available primers (mouse gal3BP [Lgals3bp]: PPM24925E; mouse gal3 [Lgals3]: PPM06208C; mouse IL-6: PM03015A; mouse CCL2: PPM03151F; USA-QIAGEN Inc., Valencia, CA) in a Rotor-Gene 3000 thermocycler (Corbett Life Science, San Francisco, CA). Relative expression levels were normalized to β-actin (PPM02945B) expression (USA-QIAGEN Inc.).
Statistics
All statistical analyses were performed using GraphPad Prism 6 (GraphPad Software, San Diego, CA). Statistical differences between groups were determined using a Student t test with Welch correction and a 1-way analysis of variance with a Tukey multiple-comparison test performed between groups for additional comparisons. Spearman correlations among thrombus weight, gal3, IL-6, and CCL2 were also performed. A value of P ≤ .05 was considered significant, and data are reported as mean ± standard error of the mean.
Results
Gal3 is increased locally and systemically during VT
Systemic gal3 and gal3bp (western blot analysis).
RBCs.
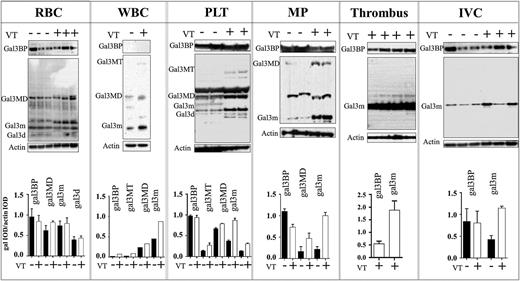
Gal3bp and gal3 were detected in VT and non-VT samples. Gal3bp (64kDa) levels did not significantly vary. A faint ∼100-kDa band was detected in all samples on the gal3bp blot, which may represent a conjugated form of gal3bp, or gal3bp in association with another protein (data not shown). Multiple bands were also observed on the gal3 blot. Gal3 monomers (gal3m), multimer dimers (gal3MD), and degradation products (gal3d) were detected in all samples. β-actin was used as a loading control. Individual lanes represent RBC lysate from a single mouse (Figure 1).
The effects of VT on Gal3BP and gal3 in blood-circulating elements (systemic) or thrombus and vein wall (Local). Western blot and quantification: western blot analysis of gal3BP and gal3 in RBCs (n = 1 per band), WBCs (n = 5 per band), PLTs (n = 3 per band), procoagulant microparticles (n = 3 per band), thrombus (n = 1 per band), and vein wall (n = 1 per band) collected from non-VT (–) (n = 21) or VT (+) (n = 25) mice 48 hours postthrombosis. Actin was used as a loading control. Quantification of blot intensity relative to loading control is shown below. gal3BP, galectin 3–binding protein; gal3, galectin 3; gal3m, gal3 monomer; gal3MD, gal3 multimer dimer; gal3MT, gal3 multimer trimer; gal3d, gal3 degradation product; IVC, vein wall; MP, procoagulant microparticles.
The effects of VT on Gal3BP and gal3 in blood-circulating elements (systemic) or thrombus and vein wall (Local). Western blot and quantification: western blot analysis of gal3BP and gal3 in RBCs (n = 1 per band), WBCs (n = 5 per band), PLTs (n = 3 per band), procoagulant microparticles (n = 3 per band), thrombus (n = 1 per band), and vein wall (n = 1 per band) collected from non-VT (–) (n = 21) or VT (+) (n = 25) mice 48 hours postthrombosis. Actin was used as a loading control. Quantification of blot intensity relative to loading control is shown below. gal3BP, galectin 3–binding protein; gal3, galectin 3; gal3m, gal3 monomer; gal3MD, gal3 multimer dimer; gal3MT, gal3 multimer trimer; gal3d, gal3 degradation product; IVC, vein wall; MP, procoagulant microparticles.
WBCs.
Only gal3 was detected. Gal3m, gal3MD, and multiple trimers (gal3MT) were detected and upregulated in the VT group. Gal3m trimers were present in the non-VT condition (twofold increase), considerably lower levels than were found in VT. Individual lanes represent WBC lysate pooled from 5 mice (Figure 1).
PLTs.
Gal3bp and gal3 were detected in both groups. Gal3bp was abundant in both VT and non-VT and did not vary between the 2 conditions. Gal3m, gal3MD, and gal3MT and degradation products (∼22 kDa) were considerably upregulated in the VT condition (gal3m >twofold increase). Gal3MT trimers were detected only in VT PLT samples. Individual lanes represent PLT pooled from 3 mice (Figure 1).
Microparticles (MP).
Gal3bp and gal3 were detected in both the VT and non-VT groups. Gal3bp was slightly decreased (<onefold) in the VT group, whereas gal3m and gal3MD were considerably upregulated. The faint gal3MD bands (>35 kDa) were detected in the VT group only (Figure 1). Individual lanes represent MP pooled from 3 mice.
Local gal3 and gal3bp (western blot analysis).
Thrombus.
Gal3bp and gal3 were present in large quantities in 48-hour thrombi. Only monomeric gal3 (∼37 kDa, gal3m) was present and/or detectable. Individual lanes represent a protein sample derived from a single 48-hour murine thrombus (Figure 1).
IVC.
Gal3 and gal3bp were detected in both groups. Gal3 was upregulated in VT mice compared with non-VT mice. Gal3bp levels did not differ between VT and non-VT mice (Figure 1). Individual lanes represent an IVC sample from a single mouse.
qRT-PCR and IHC analysis.
IVC.
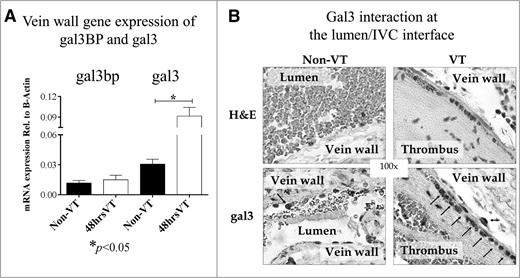
Gal3bp and gal3 mRNA in IVC was quantified by qRT-PCR for the VT and non-VT groups (Figure 2A). Gal3bp mRNA levels were similar in VT and non-VT (0.0150 vs 0.0118, respectively). A significant increase in gal3 mRNA was observed in VT mice (0.0915 vs 0.0305, P < .05) compared with non-VT mice. Gal3bp and gal3 mRNA levels were quantified relative to β-actin expression (Figure 2A). To confirm gal3 VT increases, IHC was performed on slides from VT and non-VT groups. These slides showed a qualitative increase in gal3 staining at the lumen/vein wall interface (Figure 2B).
The effects of VT on Gal3BP and gal3 in vein wall and thrombus (local). Gene expression and Histology. (A) Analysis of gal3BP and gal3 in vein wall by qRT-PCR: gal3BP and gal3 mRNA isolated from the IVC (vein wall) of non-VT (n = 8) or 48 hours VT (n = 12) WT mice were quantified using qRT-PCR. Gene expression was quantified relative to β-actin. (B) H&E and IHC for gal3. H&E stain and IHC for gal3 in both non-VT and VT conditions. Arrows indicate positive stained cells. Of note, the number of gal3 positive cells were increased on VT condition.
The effects of VT on Gal3BP and gal3 in vein wall and thrombus (local). Gene expression and Histology. (A) Analysis of gal3BP and gal3 in vein wall by qRT-PCR: gal3BP and gal3 mRNA isolated from the IVC (vein wall) of non-VT (n = 8) or 48 hours VT (n = 12) WT mice were quantified using qRT-PCR. Gene expression was quantified relative to β-actin. (B) H&E and IHC for gal3. H&E stain and IHC for gal3 in both non-VT and VT conditions. Arrows indicate positive stained cells. Of note, the number of gal3 positive cells were increased on VT condition.
Vein wall expression of gal3 correlates with thrombus weight
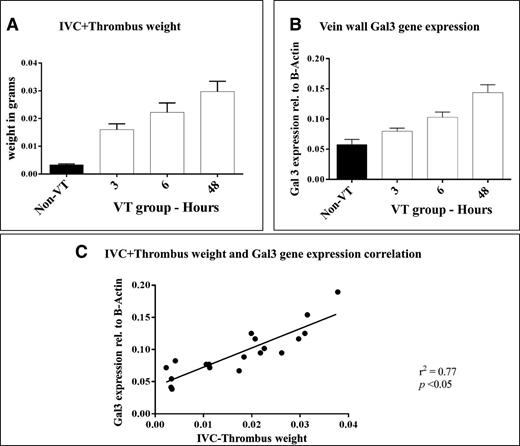
Thrombus weight was measured and gal3 expression in the IVC was quantified by qRT-PCR for VT (3, 6, and 48 hours) and non-VT groups (Figure 3A-B). Thrombus weight increased between 3 hours and 48 hours, as did the expression of gal3 in the IVC. A statistically significant, positive correlation was found between gal3 expression in the IVC and thrombus weight (r2 = 0.77, P < .05) (Figure 3C).
Gal3 correlation with IVC+thrombus weights: time course. (A) IVC or IVC+thrombus weight 3 hours, 6 hours, or 48 hours (n = 5 per time point) postligation, and in non-VT mice (n = 5). (B) Expression of gal3 in the vein wall of non-VT and VT mice 3 hours, 6 hours, or 48 hours postligation. (C) Correlation between gal3 gene expression in the IVC and IVC+thrombus weight. VT, venous thrombosis; IVC, inferior vena cava.
Gal3 correlation with IVC+thrombus weights: time course. (A) IVC or IVC+thrombus weight 3 hours, 6 hours, or 48 hours (n = 5 per time point) postligation, and in non-VT mice (n = 5). (B) Expression of gal3 in the vein wall of non-VT and VT mice 3 hours, 6 hours, or 48 hours postligation. (C) Correlation between gal3 gene expression in the IVC and IVC+thrombus weight. VT, venous thrombosis; IVC, inferior vena cava.
Vein wall expression of gal3 correlates with vein wall expression of IL-6
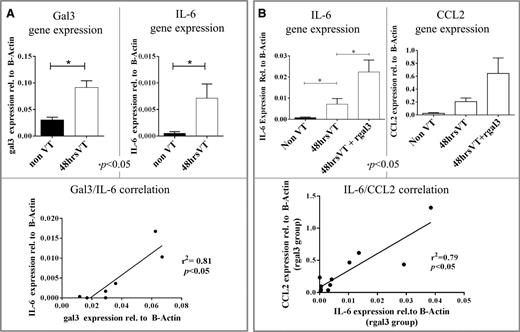
The expression of gal3 and IL-6 was measured in IVC samples collected from VT (48 hours) and non-VT mice (Figure 4A). Significant increases in gal3 (P < .05) and IL-6 (P < .05) expression were observed in VT mice. A significant positive correlation was found between gal3 expression and IL-6 expression (r2 = 0.81, P < .05) (Figure 4A).
Gal3/IL-6 and IL-6/CCL2 correlations in VT. (A) Gal3 and IL-6 gene expression in the IVC of non-VT (n = 4) and 48 hours VT (n = 3) mice. Shown below is the correlation between gal3 and IL-6 gene expression in individual mice. (B) IL-6 and CCL2 gene expression in the IVC of non-VT (n = 4), 48 hours VT (n = 3), and 48 hours VT mice that were treated with recombinant human gal3 (n = 4). Shown below is the correlation between IL-6 and CCL2 expression in individual mice.
Gal3/IL-6 and IL-6/CCL2 correlations in VT. (A) Gal3 and IL-6 gene expression in the IVC of non-VT (n = 4) and 48 hours VT (n = 3) mice. Shown below is the correlation between gal3 and IL-6 gene expression in individual mice. (B) IL-6 and CCL2 gene expression in the IVC of non-VT (n = 4), 48 hours VT (n = 3), and 48 hours VT mice that were treated with recombinant human gal3 (n = 4). Shown below is the correlation between IL-6 and CCL2 expression in individual mice.
Vein wall expression of IL-6 correlates with vein wall expression of CCL2
The expression of IL-6 and CCL2 was measured in IVC samples collected from VT mice (48 hours) that either received rGal3 or saline before surgery, and samples collected also from non-VT mice. IL-6 expression was significantly increased in mice that underwent surgery compared with non-VT mice (0.00715 vs 0.00054, P < .05) (Figure 4B). Furthermore, IL-6 expression was significantly increased in mice that received rGal3 before undergoing surgery compared with mice that received a control injection before undergoing surgery (0.02382 vs 0.00715, P < .05) (Figure 4B). CCL2 expression was increased in mice that underwent surgery compared with non-VT mice, but this increase failed to reach statistical significance (Figure 4B). CCL2 expression was also increased in mice that received rGal3 before undergoing surgery compared with mice that received saline, but this increase also failed to reach statistical significance (Figure 4B). A strong positive correlation was found between IL-6 expression and CCL2 expression (r2 = 0.79, P < .05) (Figure 4B).
Exogenous gal3 does not increase thrombus weight in IL-6–deficient mice
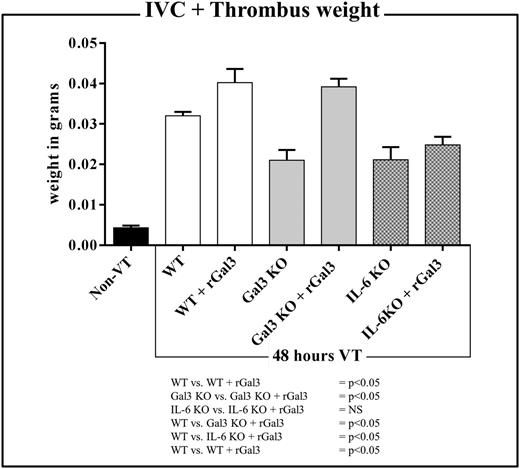
Thrombus weight was evaluated at 48 hours postligation in WT, Gal3KO, and IL-6KO mice that either received rGal3 or saline before surgery (Figure 5). Gal3KO and IL-6KO mice treated with saline had significantly smaller thrombi than WT mice that received saline (0.0210 ± 0.0025 g vs 0.0320 ± 0.0009 g and 0.0211 ± 0.0031 g vs 0.0320 ± 0.0009 g, respectively; both P < .05) (Figure 5). Statistically significant increases in thrombus weight were observed in WT and Gal3KO mice that received rGal3 compared with saline controls (0.0402 ± 0.0034 g vs 0.0320 ± 0.0009 g and 0.0391 ± 0.0020 g vs 0.0210 ± 0.0025 g, respectively; both P < .05). No increase in thrombus weight was observed in IL-6KO mice that were given rGal3 vs saline controls (0.0211 ± 0.0031 g vs 0.0248 ± 0.0019 g; NS) (Figure 5). Thrombi harvested from IL-6KO mice that received rGal3 remained significantly smaller than thrombi harvested from WT mice treated with saline (0.0248 ± 0.0019 g vs 0.0320 ± 0.0009 g; P < .05) (Figure 5).
The effect of recombinant gal3 (rGal3) on 48 hours IVC+thrombus weight in WT, Gal3KO, and IL-6KO mice. Columns from left to right: IVC or 48 hours postligation IVC+TW in non-VT (black column, n = 4), WT (white, n = 10), rGal3-treated WT (white, n = 4), Gal3KO (gray, n = 7), rGal3-treated Gal3KO (gray, n = 4), IL-6KO (gray with dots, n = 7), and rGal3-treated IL-6KO (gray with dots, n = 3) mice.
The effect of recombinant gal3 (rGal3) on 48 hours IVC+thrombus weight in WT, Gal3KO, and IL-6KO mice. Columns from left to right: IVC or 48 hours postligation IVC+TW in non-VT (black column, n = 4), WT (white, n = 10), rGal3-treated WT (white, n = 4), Gal3KO (gray, n = 7), rGal3-treated Gal3KO (gray, n = 4), IL-6KO (gray with dots, n = 7), and rGal3-treated IL-6KO (gray with dots, n = 3) mice.
Leukocyte migration during VT is dependent on gal3
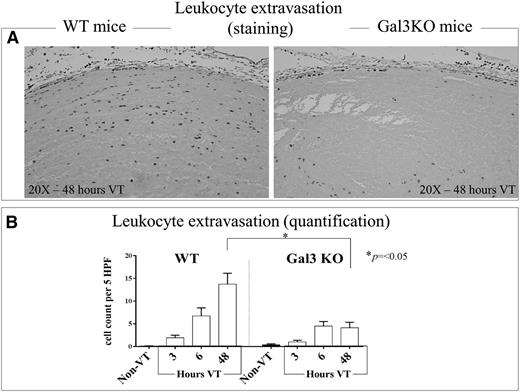
IVC and thrombus Ly6G+ cells were assessed in WT and gal3KO mice at 3 hours, 6 hours, and 48 hours postligation (Figure 6 A-B). A significant reduction in leukocyte extravasation was observed in samples collected from gal3KO mice at 48 hours postligation compared with those collected from WT mice (P < .05) (Figure 6B).
Leukocyte infiltration into the vein wall of WT and Gal3KO mice. (A) Representative pictures of 48 hours postthrombosis initiation showing leukocyte infiltration in C57Bl/6 mice and Gal3KO mice (original magnification ×20). (B) Quantification of leukocyte migration into the vein walls of WT and Gal3KO mice at 3 hours, 6 hours, and 48 hours (n = 5 per time point) post-IVC ligation, and non-VT (n = 5) were examined under high-power oil-immersion light microscopy. Note that in Gal3KO mice, leukocyte extravasation was significantly depressed compared with WT mice at 48 hours after thrombosis was initiated, the time point used for most of the experiments described in this manuscript.
Leukocyte infiltration into the vein wall of WT and Gal3KO mice. (A) Representative pictures of 48 hours postthrombosis initiation showing leukocyte infiltration in C57Bl/6 mice and Gal3KO mice (original magnification ×20). (B) Quantification of leukocyte migration into the vein walls of WT and Gal3KO mice at 3 hours, 6 hours, and 48 hours (n = 5 per time point) post-IVC ligation, and non-VT (n = 5) were examined under high-power oil-immersion light microscopy. Note that in Gal3KO mice, leukocyte extravasation was significantly depressed compared with WT mice at 48 hours after thrombosis was initiated, the time point used for most of the experiments described in this manuscript.
Gal3-gal3bp interactions at the lumen-vein wall interface
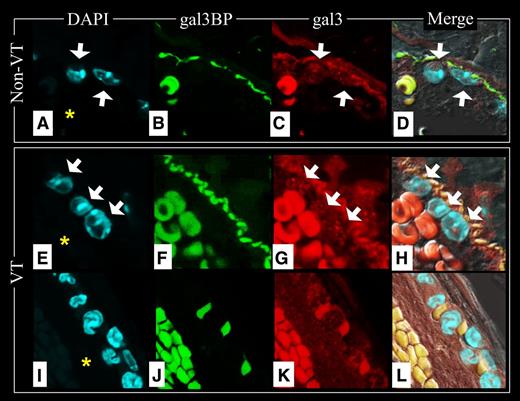
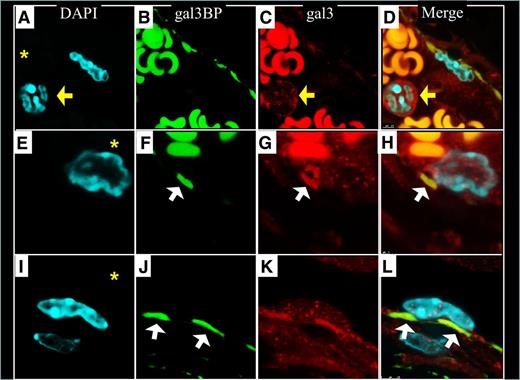
To determine whether gal3-gal3bp contribute to thrombosis, we examined the locations of gal3bp and gal3 in non-VT and VT IVC samples using IF. Endothelial cells, lining the IVC, stained positively for gal3bp (Figure 7B,F, FITC). Gal3bp endothelial cell staining was absent in areas of the IVC that were flush against a thrombus (Figure 7J). Neutrophils and endothelial cells stained positively for gal3 (Figure 7C,G,K, Texas Red). Samples in which the endothelial cell layer was well visualized showed proinflammatory leukocytes interacting with “sockets” of gal3bp in the vein wall (Figure 7D,H and Figure 8D,H,L). Neutrophils circulating (Figure 8A-D) or migrating (Figure 8E-L) into the IVC, were negative for gal3bp. Leukocytes partially attached to the vein wall (Figure 8E-H) were observed in contact with 1 socket of gal3bp at the vein wall surface. Leukocytes totally attached to the vein wall were observed in contact with at least 2 sockets of gal3bp (Figure 8I-L). Strong RBC autofluorescence at the red and green wavelengths made it impossible to identify any specific gal3bp or gal3 staining therein.
Gal3BP and gal3 at the lumen/IVC interface. Non-VT images: Top raw (A-D); VT images 48 hours after thrombosis was initiated from an area where there was not thrombus/vein wall contact, middle raw (E-H); and VT images 48 hours after thrombosis was initiated from an area where there was thrombus/vein wall fusion, bottom raw (I-L). Note that vein wall gal3 and gal3bp are abundant in areas where the thrombus is not contacting the vein wall (F-G), but disappear in areas where the thrombus contacts the vein wall (J-K). Red blood cell fluorescence is predominately nonspecific autofluorescence. The IVC lumen is indicated with an asterisk in DAPI images. White arrows indicate WBCs. (A,E,I) Nuclear DAPI staining. (B,F,J) Gal3bp localization (FITC). (C,G,K) Gal3 localization (Texas Red). (D,H,L) Merge of images.
Gal3BP and gal3 at the lumen/IVC interface. Non-VT images: Top raw (A-D); VT images 48 hours after thrombosis was initiated from an area where there was not thrombus/vein wall contact, middle raw (E-H); and VT images 48 hours after thrombosis was initiated from an area where there was thrombus/vein wall fusion, bottom raw (I-L). Note that vein wall gal3 and gal3bp are abundant in areas where the thrombus is not contacting the vein wall (F-G), but disappear in areas where the thrombus contacts the vein wall (J-K). Red blood cell fluorescence is predominately nonspecific autofluorescence. The IVC lumen is indicated with an asterisk in DAPI images. White arrows indicate WBCs. (A,E,I) Nuclear DAPI staining. (B,F,J) Gal3bp localization (FITC). (C,G,K) Gal3 localization (Texas Red). (D,H,L) Merge of images.
Gal3BP and gal3-mediated leukocyte interactions with the IVC. Sockets distribution of gal3bp appears to be interacting with gal3 rich leukocytes (H,L). Red blood cell fluorescence is predominately nonspecific autofluoresence. The IVC lumen is indicated with an asterisk in DAPI images. Yellow arrows indicate WBC that is not attached to the vein wall. White arrows indicate gal3bp sockets on the vein wall. (A,E,I) Nuclear DAPI staining. (B,F,J) Gal3bp localization (FITC). (C,G,K) Gal3 localization (Texas Red). (D,H,L) Merge of images.
Gal3BP and gal3-mediated leukocyte interactions with the IVC. Sockets distribution of gal3bp appears to be interacting with gal3 rich leukocytes (H,L). Red blood cell fluorescence is predominately nonspecific autofluoresence. The IVC lumen is indicated with an asterisk in DAPI images. Yellow arrows indicate WBC that is not attached to the vein wall. White arrows indicate gal3bp sockets on the vein wall. (A,E,I) Nuclear DAPI staining. (B,F,J) Gal3bp localization (FITC). (C,G,K) Gal3 localization (Texas Red). (D,H,L) Merge of images.
Discussion
Gal3bp and gal3 are known to play important roles in a number of pathologic conditions, such as cancer, infections, diabetes, atherosclerosis, wound healing, asthma, and rheumatoid arthritis, but their role in VT has not been defined.11,12,19-25 This study shows that gal3 and gal3bp are associated with murine thrombogenesis, that gal3 and gal3bp interact at the thrombus–vein wall interface, and that gal3 may be contributing to thrombosis through proinflammatory, IL-6–dependent mechanisms. Our findings suggest that gal3bp and gal3 may be potential therapeutic targets, and biomarkers, in human VT.
Animal model
We acknowledge that the IVC ligation model used in this study has been shown to drive thrombus formation through an endothelial cell–derived, tissue factor–dependent mechanism as opposed to a leukocyte-derived, tissue factor–dependent mechanism.26 Thus, there is evidence that venous thrombogenesis is a complex and multifactorial-driven process that involves coagulation, inflammation, and fibrinolysis. Thus, tissue factor, von Willebrand factor, neutrophil extracellular traps, the coagulation cascade, P- and E-selectin, leukocyte migration, cytokine production including IL-6 and PAI-1, and plasminogen/plasmin among others play important roles in VT and were studied using several animal models including the IVC ligation model. The result of this work shows that gal-3 contributes to the inflammation and leukocyte-driven components of VT.
Gal3bp and gal3 location
Gal3bp and gal3 were found in all tissue and blood elements pertinent to the thrombi that were examined, except leukocytes.
Gal3bp.
Consistent with observations of patients in the study by Ramacciotti et al, large quantities of gal3bp were found in mouse microparticles.2 Although gal3bp was abundant in all elements studied except leukocytes, gal3bp was not significantly increased in any elements in the VT condition.
Gal3 monomer and multimers.
In contrast, gal3 was markedly increased in the VT condition in all blood and tissue samples. As the concentration of gal3 protein increases, gal3 is known to form multimers, from dimers to pentamers.5,10,27,28 Multimerization of gal3 occurs via the N-terminal domain and does not interfere with gal3’s ability to bind carbohydrate ligands though its carbohydrate recognition domain in its C-terminal domain.11 In our study, gal3 was upregulated not only at the monomer level in IVC and thrombus, but also at the multimer (dimers and trimers, ∼67, 80 kDa) level in RBCs, WBCs, PLTs, and microparticles, indicating high levels of gal3 within these elements. Gal3 multimerization is known to have physiologic consequences, such as enhancing the ability of gal3 to facilitate cell-cell interactions.11,12 Cell-to-cell adhesion plays a major role in thrombogenesis, both at the thrombus–vein wall interface and within the thrombus itself.29,30 The adhesive properties of gal3 multimers may contribute to gal3’s apparent prothrombotic function. We suspect that the increase in gal3 protein observed during VT in PLTs may be caused by in situ translation of preexisting gal3 mRNA, because PLTs, although lacking in nuclei, have been shown to possess translational machinery.31,32 To the best of our knowledge, RBCs and microparticles do not possess translational machinery, so the increase in gal3 observed is likely a result of the transport of preexisting gal3 protein to their surface or from cytosol.33
Gal3 degradation products.
In addition to observing an abundance of gal3 monomers and multimers, we observed an increase in gal3 degradation products (<36 kDa) in circulating RBCs, PLTs, and MPs. Gal3 is a known substrate for matrix metalloproteinases 2 and 9.10 These enzymes cleave the Ala62-Try63 bond within gal3, yielding a C-terminal domain fragment (∼22 kDa) and an N-terminal domain fragment (∼10 kDa). Cleavage of gal3 significantly alters its function. Interestingly, after cleaved, gal3 can no longer multimerize, but the C-terminal domain fragment has a higher binding capacity for ligands than intact gal3.9,10 Thus, it is possible that cleavage of gal3 decreases its ability to promote cell-cell interactions while enhancing its ability to stimulate cell-signaling cascades. The relevance of gal3 degradation fragments to thrombosis has yet to be determined.
Gal3 plays a proinflammatory role in the context of VT
Evidence has mounted showing that a number of inflammatory cytokines have prothrombotic effects.34 Inflammatory cytokines implicated in thrombosis include IL-6, IL-8, P-selectin, TNF-α, CCL2, and C-reactive protein.34 Several studies have shown that gal3 upregulates IL-6 in pathologic conditions.7,8,35 We have previously shown that IL-6 plays a key role in promoting VT.15 We therefore decided to investigate the relationship between gal3 and IL-6 during VT. The strong correlation we observed between gal3 and IL-6 expression in the vein wall led us to examine whether these were mechanistically involved in venous thrombogenesis. The WT mice that were given rGal3 had significantly elevated thrombus weights and increased vein wall expression of IL-6. Conversely, IL-6KO mice had smaller VT, and recombinant gal3 did not restore the thrombogenic phenotype. These data suggest that gal3 promotes thrombosis in an IL-6–dependent manner. We also found an increase in CCL2 expression in the vein wall of VT mice treated with rGal3, further supporting a role of gal3in the inflammatory component of VT. Based on the data we gathered in this study and that of Wojcik et al,15 we believe gal3bp and gal3 are upstream elements of a pathway that upregulates IL-6, and ultimately CCL2, during VT. Understanding the pathway(s) by which gal3 and gal3bp upregulate inflammatory cytokines is imperative because points along this pathway could serve as targets for future therapies to prevent VT.
Gal3 and Gal3bp participate in leukocyte migration
Inflammation was first linked to VT in a study published by Stewart et al in 1974.3 Gal3bp and gal3 promote inflammation not only by upregulating the expression of inflammatory cytokines, but also by attracting and facilitating the migration of WBCs into tissue.20,36-38 Sato et al found that gal3 accumulation in the alveolar space of infected lungs correlated strongly with the onset of neutrophil infiltration,20 and Hsu et al found that gal3KO mice had less inflammatory cell infiltration into the peritoneal cavity upon thioglycollate broth injection than gal3+/+ mice.37 To the best of our knowledge, before this study no investigations had been performed on the role of gal3bp and gal3 in leukocyte migration during VT. Our IHC and quantification of leukocyte extravasation in WT and Gal3KO mice demonstrated that gal3 contributes to the inflammatory component of VT. In addition, in IVC samples harvested from mice without VT, we observed socketlike positive signals for gal3bp at the vein wall surface, interacting with gal3-rich leukocytes. This pattern was also observed in samples harvested from mice with VT in areas where the thrombus was not attached to the IVC, and that disappeared in areas where the thrombus was strongly adhered. It is likely that vein wall areas that were flush against the thrombus underwent hypoxia and tissue damage—even perhaps cell death—which could explain the lack of gal3bp and gal3 staining in these regions. The observation that the vein wall stained positively for both gal3bp and gal3 is consistent with our western blot data, which showed both gal3bp and gal3 bands in blots performed using homogenized vein wall samples. In all observed cases of neutrophil attachment to and migration into the vein wall, gal3-rich neutrophils were interacting with gal3bp-rich “sockets” in the endothelium. To the best of our knowledge, no previous studies have shown galectin or galectin-binding protein sockets in the vein wall. Moreover, leukocyte extravasation into the vein wall of VT+ mice was significantly reduced in gal3-deficient mice 48 hours postligation. Based on these observations, we strongly suspect that a gal3-mediated pathway contributes to the leukocyte-driven component of VT.
Gal3 and Gal3bp as biomarkers candidates
In the present work, we present 2 biomarker candidates, circulating gal3bp and gal3, both of which are elevated in humans and mice during VT (supplemental Figure 1A-B). Our gal3 values were clearly below the levels of the circulating level range in humans. Our human blood samples were collected using sodium citrate and not EDTA. In addition, we used bank samples stored for more than 6 months.39 Storage of samples for this long can cause gal3 levels to decrease in samples. None of these factors affected gal3bp assay performance, but they likely did affect gal3 assay performance. Future studies should evaluate the levels of gal3bp and gal3 in a larger cohort of VT+ and VT– individuals immediately after their blood is drawn. The ability of gal3bp and gal3 to accurately diagnose or rule out VT should then be evaluated and compared against the ability of currently used biomarkers (such as d-dimer) to do so.
Gal3 and Gal3bp as therapeutic candidates
Both blocking gal3bp and knocking out gal3 reduced thrombus weight (supplemental Figure 1C). The significant decreases observed in the thrombus weights of mice deficient in gal3 or treated with a gal3bp-depleting antibody confirm that both of these proteins are prothrombotic and suggest that both are potential therapeutic targets. Although gal3KO mice had lower thrombus weights than anti-gal3bp–treated mice, the difference between the 2 groups was not significant. Whether the therapeutic effect of eliminating gal3 or blocking gal3bp was caused by the prevention of an interaction between the 2 proteins, between the individual proteins and some of their alternative ligands, or some combination of both, remains to be evaluated. Regardless of the mechanism, our data suggest that reducing gal3 and gal3bp can have protective effects against VT.
Conclusion
This is the first study to demonstrate a role for gal3bp and gal3 in experimental VT. We have shown that gal3bp and gal3 possess prothrombotic and proinflammatory properties in the context of experimental VT, and that these proteins may be ideal targets for therapies that seek to prevent VT. Furthermore, based on our findings, we believe that gal3 and/or gal3bp should be rigorously investigated to determine their quality as potential biomarkers of VT.
Presented in part at the American Venous Forum 25th Annual Meeting, Scientific Session 2, Deep Vein Thrombosis I, Oral Presentation #2-7, Thursday, February 28, 2013.
The online version of this article contains a data supplement.
The publication costs of this article were defrayed in part by page charge payment. Therefore, and solely to indicate this fact, this article is hereby marked “advertisement” in accordance with 18 USC section 1734.
Acknowledgments
This work was supported by National Institutes of Health, National Heart, Lung, and Blood Institute grant HL080962-01A5, The Baiardi Family Foundation (Elizabeth Anne Baiardi Research Fund), and the Conrad and Caroline Jobst Foundation.
Authorship
Contribution: E.P.D. and J.A.D. conceived and designed the study; E.P.D., E.M.S., R.K.A.-K., and A.E.H. collected data; E.P.D., P.K.H., and J.A.D. analyzed and interpreted data; E.P.D. and J.A.D. performed statistical analysis; E.P.D., S.K.W., P.K.H., and J.A.D. wrote the paper; E.P.D., S.K.W., P.K.H., D.D.M., T.W.W., and J.A.D. provided critical analysis and revision of the paper; and all authors gave final approval of the paper.
Correspondence: Jose Antonio Diaz, Conrad Jobst Vascular Research Laboratories, University of Michigan, NCRC, 2800 Plymouth Rd B26, R251N, Ann Arbor, MI 48109; e-mail: josediaz@med.umich.edu.

This feature is available to Subscribers Only
Sign In or Create an Account Close Modal