Key Points
Murine stress erythroid progenitors develop through a series of progenitors that express CD34, CD133, Kit, and Sca1.
Human stress erythroid progenitors can be expanded using the same culture system and are predisposed to express γ-globin.
Abstract
Tissue hypoxia induces a systemic response designed to increase oxygen delivery to tissues. One component of this response is increased erythropoiesis. Steady-state erythropoiesis is primarily homeostatic, producing new erythrocytes to replace old erythrocytes removed from circulation by the spleen. In response to anemia, the situation is different. New erythrocytes must be rapidly made to increase hemoglobin levels. At these times, stress erythropoiesis predominates. Stress erythropoiesis is best characterized in the mouse, where it is extramedullary and utilizes progenitors and signals that are distinct from steady-state erythropoiesis. In this report, we use an in vitro culture system that recapitulates the in vivo development of stress erythroid progenitors. We identify cell-surface markers that delineate a series of stress erythroid progenitors with increasing maturity. In addition, we use this in vitro culture system to expand human stress erythroid progenitor cells that express analogous cell-surface markers. Consistent with previous suggestions that human stress erythropoiesis is similar to fetal erythropoiesis, we demonstrate that human stress erythroid progenitors express fetal hemoglobin upon differentiation. These data demonstrate that similar to murine bone marrow, human bone marrow contains cells that can generate BMP4-dependent stress erythroid burst-forming units when cultured under stress erythropoiesis conditions.
Introduction
Anemic stress leads to tissue hypoxia, which induces a systemic response designed to increase oxygen delivery to the tissues. A key component of this response is stress erythropoiesis, which rapidly generates large numbers of new erythrocytes.1 Stress erythropoiesis is best understood in mice, where it is extramedullary, occurring in the adult spleen and liver and in the fetal liver during development.2-4 Stress erythropoiesis utilizes signals and progenitor cells that are distinct from steady-state erythropoiesis.5,6 Recently, we demonstrated that BMP4-dependent stress erythropoiesis mediates erythroid short-term radioprotection following bone marrow transplant (BMT).7 Mice with defects in stress erythropoiesis exhibit difficulties in generating new erythrocytes in the immediate posttransplant period prior to hematopoietic stem cell (HSC) engraftment. Using this assay, we identified murine CD34+Kit+Sca1+Lin− (34KSL) cells, which were previously shown to be short-term reconstituting HSCs, as the population of cells that migrates from the bone marrow to the spleen and develops into stress erythroid burst-forming units (BFU-Es).7,8 Following transplant, the development of donor-derived stress erythroid progenitors proceeds in a regulated manner. Initially, donor cells proliferate in the spleen, but during the first 8 days after transplant, they are unable to differentiate. At this point, a switch in development occurs and the stress progenitors acquire the ability to develop into stress BFU-Es. Over the following 8 days, stress BFU-Es expand and differentiate. Following recovery, new cells migrate from the bone marrow into the spleen to replenish the progenitor cells. Stress erythroid progenitors are characterized by the expression of both immature cell markers like Kit and Sca1 and late erythroid markers like CD71 and TER119, which makes them distinct from steady-state erythroid progenitors.5,7 Previously, we identified 3 distinct populations of stress erythroid progenitors in the spleen. The most immature population (population I: Kit+CD71med/−Ter119lo/−) contained all the stress BFU-E activity. Purified population I cells were capable of rescuing erythropoiesis in lethally irradiated mice, maintaining their survival until endogenous HSCs that had survived radiation could repopulate the animals. In addition, population I progenitors could be serially transplanted, which demonstrated their ability to self-renew in vivo.7
In this report, we outline an in vitro culture system that recapitulates the development, expansion and differentiation of stress erythroid progenitors. Utilizing unfractionated bone marrow cells, we show that culturing cells in a combination of Sonic hedgehog (Shh), BMP4, GDF15, stem cell factor (SCF), erythropoietin (Epo), and hypoxia leads to the development of stress BFU-Es. Using CD34 and CD133 as additional markers in combination with Kit and Sca1, we are able to fractionate population I stress progenitors into 3 distinct populations that make up a developmental series of progenitors. Each of these populations has the ability to rescue erythropoiesis when transplanted into irradiated animals and is capable of self-renewal in vivo. The in vitro culture system allowed us to extend our findings to human stress erythroid progenitors. Culturing human bone marrow in media under the same conditions leads to the expansion of human stress erythroid progenitors that express a similar set of cell-surface markers. The human stress erythroid progenitors form BFU-E colonies, which require BMP4. In addition, analysis of human stress erythroid progenitors showed that they expressed γ-globin and fetal hemoglobin (HbF), which is consistent with previous findings that human stress erythropoiesis is similar to fetal erythropoiesis.9-14
Materials and methods
Mice and cell culture
C57BL/6 mice and C57BL/6-Tg(UBC-GFP)30Scha/J15 mice were purchased from The Jackson Laboratory. All the mice were 6 to 10 weeks old. All procedures are approved by the Institutional Animal Care and Use Committee of the Pennsylvania State University. For the culture of bone marrow cells in vitro, mouse bone marrow cells were isolated and cultured in stress erythropoiesis expansion media (SEEM) containing Iscove modified Dulbecco medium (IMDM) (Invitrogen) with 10% fetal bovine serum (Equiec-Bio, Kerrville, TX), 1% penicillin-streptomycin, 10 μg/mL insulin, 200 μg/mL transferrin, 2 mM l-glutamine, 0.01 g/mL bovine serum albumin, and 7 μl/L 2-mercaptoethanol supplemented with GDF15 (30 ng/mL; BioMatik, Wilmington, DE), BMP4 (15 ng/mL), SCF (50 ng/mL) (MyBiosource, San Diego, CA), and Shh (25 ng/mL) (R&D Systems, Minneapolis, MN). For stress erythropoiesis differentiation media (SEDM), SEEM was supplemented with Epo (3 U/mL) (Amgen) and cultured at 2% O2. Human bone marrow mononuclear cells were purchased from Reachbio (#033-200) and cultured in the stress erythropoiesis medium described above except that human growth factors (GDF15 and SHH from R&D Systems, BMP4 and SCF from MyBiosource, and FBS for human cultures from Stem Cell Technologies, Vancouver, BC, Canada) were used. Cells were cultured in SEEM or SEDM for the indicated days. Media were not changed during the culture time.
Stress BFU-E colony assay, bone marrow transplantation, and white blood cell isolation
qRT-PCR and gene expression assay
Total RNA was isolated using the TRIzol reagent (Invitrogen). Complementary DNA was generated from 2 μg RNA using the SuperScript-II system (Invitrogen). Quantitative reverse-transcription polymerase chain reaction (qRT-PCR) was done by using TaqMan probes and an ABI7300 real-time PCR system. A list of the primers and probes is given in supplemental Methods.
Western blotting
Western bot analysis was performed using the primary antibodies anti-BCL11A (sc-33093, Santa Cruz Biotechology) and anti-β actin (sc-130656, Santa Cruz Biotechnology). The bands were visualized with Amersham ECL prime western blotting detection reagent.
Flow cytometry and cell sorting
A list of the antibodies used in our analysis is presented in supplemental Methods. Flow cytometry analysis was done using LSR-II Fortessa flow cytometer (BD Biosciences). Dead cells were gated out using propidium iodide staining. All data were analyzed with FlowJo software. Cell populations were sorted using a Cytopia Influx V-GS Cytometry Workbench with Spigot software.
Statistical analysis
The standard deviation indicates the variation within each experiment (in vitro) and each mouse (in vivo). P values were calculated by Student t test (2 tailed). Statistical significance was taken at values of P < .05.
Results
Development of an in vitro culture system to expand stress erythroid progenitors
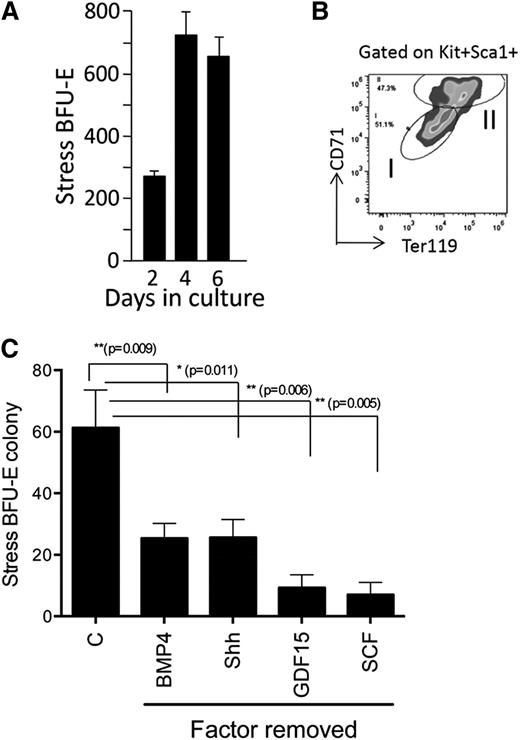
Murine stress BFU-Es require BMP4, SCF, Hedgehog, Epo, and hypoxia for expansion and differentiation.5,6 Using these factors in combination GDF15, a growth factor whose expression was shown to be upregulated in the spleens of anemic mice16-18 and is required for stress erythropoiesis (R.F.P., D.-C.W., and J.X., unpublished observations), we set out to identify conditions that allow for the in vitro expansion of stress erythroid progenitors and stress BFU-Es. Although previously we demonstrated that transplanted 34KSL cells could gave rise to donor-derived stress BFU-Es in the spleen,7 initial experiments culturing purified 34KSL cells in media containing all growth factors failed to generate stress BFU-Es (data not shown). This observation suggested that the microenvironment plays a key role in the development of stress progenitors.19,20 We next cultured unfractionated bone marrow cells for 2, 4, and 6 days in media containing BMP4, Shh, GDF15, SCF, and Epo at 2% O2 to mimic hypoxic tissue conditions. At each time point, cells were plated out to test for stress BFU-E formation in methylcellulose media containing BMP4 + SCF + Epo at 2%O2. At each time point, we observed stress BFU-Es in the cultures, demonstrating that this combination of factors promoted the expansion of stress BFU-Es (Figure 1A). Analysis of stress erythroid progenitors derived from in vitro culture on day 6 showed that population I cells were expanded (Figure 1B). Removal of any of the growth factors from the culture resulted in a significant decrease in stress BFU-Es (Figure 1C).
Culture of unfractionated bone marrow cells leads to the development of stress BFU-Es. (A) Unfractionated bone marrow cells were cultured for the indicated number of days in IMDM supplemented with BMP4 + Shh + GDF15 + SCF + Epo and cultured at 2% O2. On the indicated days, 1 × 10⁵ cells were plated in methylcellulose media containing BMP4 + SCF + Epo and cultured at 2% O2 for 5 days. Stress BFU-Es were scored after benzidine staining. (B) Flow cytometry analysis of unfractionated bone marrow cultures on day 6 of culture. Cells were gated on Kit+Sca1+ cells, and the percentages of CD71 and Ter119 are shown. (C) Unfractionated bone marrow cells were grown for 5 days in IMDM supplemented with BMP4 + Shh + GDF15 + SCF + Epo and cultured at 2% O2 (control media, C) or in control media with the indicated factor removed. A total of 5 × 10⁴ cells were then plated in methylcellulose media supplemented with Epo, and stress BFU-E colonies were scored after 5 days. Data are representative of at least 2 independent experiments.
Culture of unfractionated bone marrow cells leads to the development of stress BFU-Es. (A) Unfractionated bone marrow cells were cultured for the indicated number of days in IMDM supplemented with BMP4 + Shh + GDF15 + SCF + Epo and cultured at 2% O2. On the indicated days, 1 × 10⁵ cells were plated in methylcellulose media containing BMP4 + SCF + Epo and cultured at 2% O2 for 5 days. Stress BFU-Es were scored after benzidine staining. (B) Flow cytometry analysis of unfractionated bone marrow cultures on day 6 of culture. Cells were gated on Kit+Sca1+ cells, and the percentages of CD71 and Ter119 are shown. (C) Unfractionated bone marrow cells were grown for 5 days in IMDM supplemented with BMP4 + Shh + GDF15 + SCF + Epo and cultured at 2% O2 (control media, C) or in control media with the indicated factor removed. A total of 5 × 10⁴ cells were then plated in methylcellulose media supplemented with Epo, and stress BFU-E colonies were scored after 5 days. Data are representative of at least 2 independent experiments.
In addition, our previous work showed that population I cells could be transplanted into lethally irradiated mice, where they provided erythroid rescue until endogenous stem cells that had survived myeloablation could repopulate the mouse.7 Population I stress erythroid progenitors generated in vitro rescued lethally irradiated mice. In fact, as few as 5000 purified population I stress erythroid progenitors could provide erythroid short-term radioprotection. When GDF15 was omitted from the culture conditions, the rescue of lethally irradiated mice was compromised, and if Shh and GDF15 were omitted, then the resulting cells failed to rescue the irradiated recipients (supplemental Figure 1).
Epo and hypoxia promote the transition from expansion to differentiation
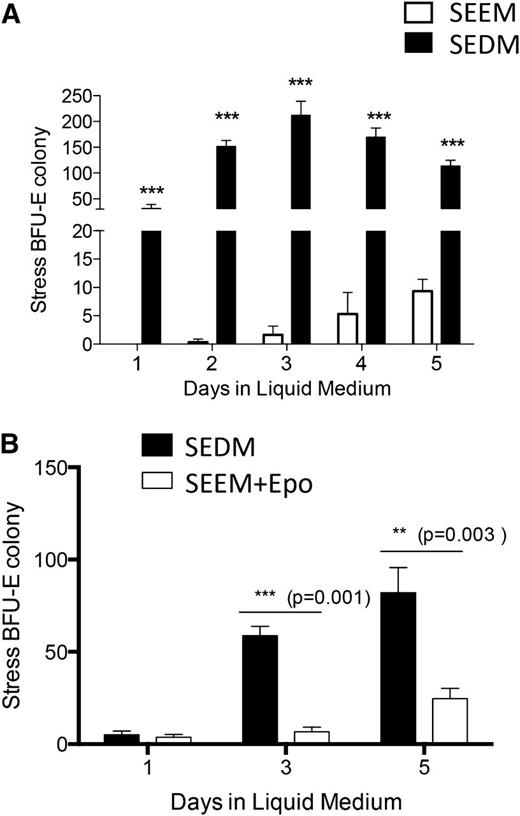
During the recovery from BMT, stress erythropoiesis occurs in 2 stages. Prior to day 8 posttransplant, expanding progenitors are unable to differentiate. However, in response to an unknown signal, progenitor cells acquire the ability to differentiate and become stress BFU-Es.7 We suggested that Epo and/or hypoxia could be that signal because the expression of Epo messenger RNA (mRNA) in the kidney, which is also a surrogate marker for tissue hypoxia, peaked at the time of the transition.7 We tested this hypothesis by culturing unfractionated bone marrow cells in media containing BMP4, Shh, GDF15, and SCF (hereafter referred to as SEEM) or SEEM supplemented with Epo and cultured at 2% O2 (hereafter referred to as SEDM). The presence of progenitors capable of forming stress BFU-Es was tested each day for 5 days of culture. When cells were cultured in SEEM, they generated significantly fewer progenitors capable of forming stress BFU-E colonies and the progenitors were delayed in their appearance. In contrast, when SEDM was used, the cells readily formed stress BFU-E colonies on each day of culture, with a peak observed at day 3 (Figure 2A). If Epo and hypoxia were required for cells to transition to stress erythroid progenitors capable of differentiation, then bone marrow cells cultured in SEEM should respond to Epo and hypoxia and generate stress BFU-Es. Bone marrow cells were cultured in SEEM for 5 days and then switched into SEDM. On days 3 and 5 after the switch in media, increasing numbers of stress BFU-Es were generated in the culture (Figure 2B). To further delineate the requirements for this transition, we tested whether Epo alone is sufficient to promote the transition to differentiation. The data show that supplementing SEEM with Epo promoted the development of stress BFU-Es, although the response was delayed. Significant numbers of stress BFU-Es were not observed until day 5 of culture, and the magnitude of the response was less than that observed when cells were cultured in SEDM (Figure 2B). This observation suggests that hypoxia potentiates the Epo-dependent signal that promotes the transition to stress BFU-Es.
Epo and hypoxia promote the transition from expanding stress erythroid to progenitors capable of differentiation. (A) Unfractionated bone marrow cells were plated in IMDM supplemented with BMP4 + Shh + GDF15 + SCF + Epo and cultured at 2%O2 (2% O2 + Epo or SEDM) or media lacking Epo cultured at 20% O2 (20% O2 − Epo or SEEM). After 5 days of culture, 5 × 10⁴ cells were plated in methylcellulose media containing BMP4 + SCF + Epo at 2% O2 for 5 days. Stress BFU-Es were scored after benzidine staining. (B) Unfractionated bone marrow cells were cultured in SEEM for 5 days and then switched into SEEM supplemented with Epo and cultured at 20% O2 or with Epo and cultured at 2% O2 for the indicated days. On the indicated days, 5 × 10⁴ cells were plated in methylcellulose media supplemented with Epo, and stress BFU-Es were scored by benzidine staining after 5 days of culture. The data represent at least 2 independent experiments.
Epo and hypoxia promote the transition from expanding stress erythroid to progenitors capable of differentiation. (A) Unfractionated bone marrow cells were plated in IMDM supplemented with BMP4 + Shh + GDF15 + SCF + Epo and cultured at 2%O2 (2% O2 + Epo or SEDM) or media lacking Epo cultured at 20% O2 (20% O2 − Epo or SEEM). After 5 days of culture, 5 × 10⁴ cells were plated in methylcellulose media containing BMP4 + SCF + Epo at 2% O2 for 5 days. Stress BFU-Es were scored after benzidine staining. (B) Unfractionated bone marrow cells were cultured in SEEM for 5 days and then switched into SEEM supplemented with Epo and cultured at 20% O2 or with Epo and cultured at 2% O2 for the indicated days. On the indicated days, 5 × 10⁴ cells were plated in methylcellulose media supplemented with Epo, and stress BFU-Es were scored by benzidine staining after 5 days of culture. The data represent at least 2 independent experiments.
CD34 and CD133 expression marks a developmental progression of stress erythroid progenitors
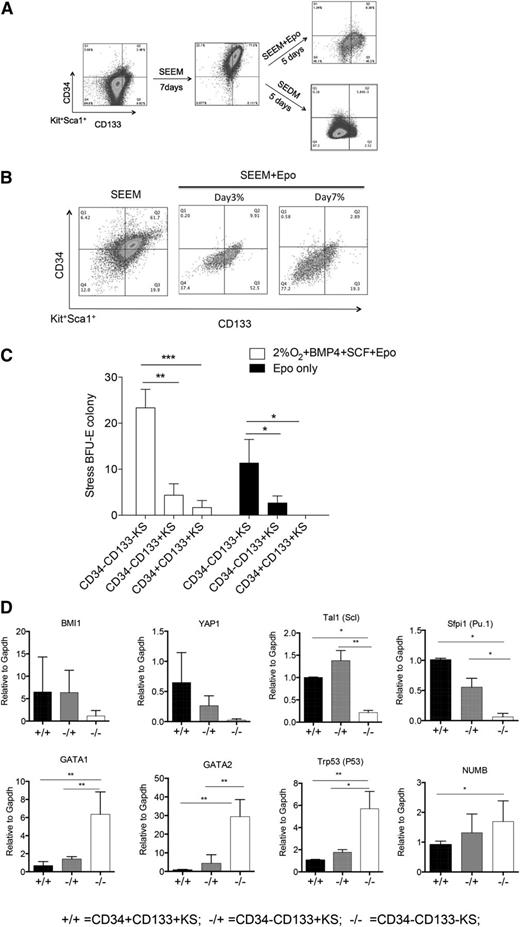
Using SEEM and SEDM as a 2-stage culture system that mimics the expansion and differentiation stages of stress erythropoiesis, we next sought to identify new markers that could further subdivide population I stress progenitors. Because this population is present during the expansion and differentiation stages, new markers were needed to further characterize the development of these cells. Friend virus infection induces the BMP4-dependent stress erythropoiesis pathway, and infection of Sca1+ population I cells leads to the development of self-renewing leukemia stem cells (LSCs).21,22 Friend virus LSCs express CD34 and CD133. The presence of CD34 would be consistent with our previous data showing that 34KSL cells are the precursor cells that give rise to stress erythroid progenitors in the spleen,7,8 whereas CD133 is a marker associated with tissue and cancer stem cells.23 Unfractionated bone marrow cells exhibited low to negative expression of CD34 and CD133. However, when cells were cultured for 7 days in SEEM, 77% of Kit+Sca1+ (KS) cells were CD34+CD133+. When we shifted the cells to SEEM + Epo for 5 days, 90% of the CD34+CD133+KS cells became either CD34−CD133+KS (45%) or CD34−CD133−KS (45%) cells, with the remaining cells maintained as CD34+CD133+KS. In contrast, if we shifted cells to SEDM, almost all (>97%) of the CD34+CD133+KS cells transitioned to CD34−CD133−KS cells (Figure 3A). This observation is similar to what we observed in the development of stress BFU-Es, where Epo and hypoxia are more efficient than Epo alone. However, if the cultures are extended, Epo is sufficient to promote the transition CD34+CD133+KS cells to CD34−CD133−KS cells. Culturing CD34+CD133+KS cells in SEEM + Epo for 3 days or 7 days demonstrates that CD34+CD133+KS cells differentiate through a CD34−CD133+ intermediate and accumulate more CD34−CD133−KS cells with longer culture time (Figure 3B).
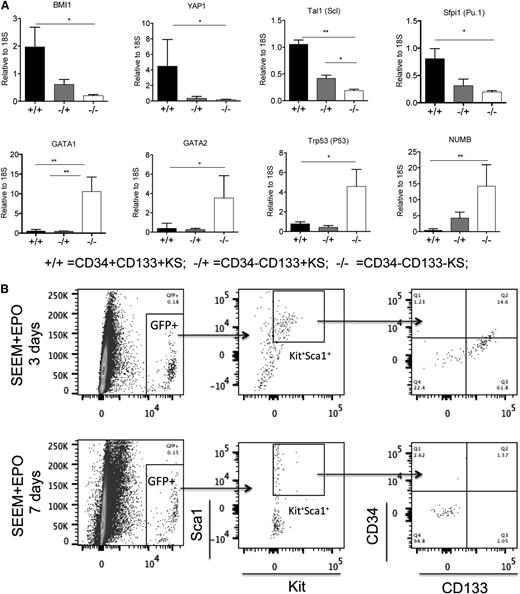
CD34 and CD133 expression defines a series of immature stress erythroid progenitors. (A) Representative flow cytometry analysis of unfractionated mouse bone marrow prior to culture (left), after 7 days in SEEM (center), and after 5 days in SEEM + Epo or SEDM (right). Cells were gated on Kit+Sca1+, and the expression of CD34 and CD133 is shown. (B) Unfractionated mouse bone marrow was grown in SEEM for 7 days and switched into SEEM + Epo media. Representative flow cytometry analysis is shown for cells grown for 3 days and 7 days. (C) CD34+CD133+KS, CD34−CD133+KS, and CD34−CD133−KS cells were sorted from cultures by flow cytometry. A total of 2 × 10⁴ cells were plated in methylcellulose media containing Epo only to assay for mature stress BFU-Es or in media containing Epo + BMP4 + SCF at 2% O2 to assay maximal stress BFU-E potential. (D) CD34+CD133+KS, CD34−CD133+KS, and CD34−CD133−KS cells were sorted from cultures by flow cytometry. mRNA expression of the indicated genes was determined by qRT-PCR and expressed relative to the housekeeping gene Gapdh (2ΔΔCt).
CD34 and CD133 expression defines a series of immature stress erythroid progenitors. (A) Representative flow cytometry analysis of unfractionated mouse bone marrow prior to culture (left), after 7 days in SEEM (center), and after 5 days in SEEM + Epo or SEDM (right). Cells were gated on Kit+Sca1+, and the expression of CD34 and CD133 is shown. (B) Unfractionated mouse bone marrow was grown in SEEM for 7 days and switched into SEEM + Epo media. Representative flow cytometry analysis is shown for cells grown for 3 days and 7 days. (C) CD34+CD133+KS, CD34−CD133+KS, and CD34−CD133−KS cells were sorted from cultures by flow cytometry. A total of 2 × 10⁴ cells were plated in methylcellulose media containing Epo only to assay for mature stress BFU-Es or in media containing Epo + BMP4 + SCF at 2% O2 to assay maximal stress BFU-E potential. (D) CD34+CD133+KS, CD34−CD133+KS, and CD34−CD133−KS cells were sorted from cultures by flow cytometry. mRNA expression of the indicated genes was determined by qRT-PCR and expressed relative to the housekeeping gene Gapdh (2ΔΔCt).
To further characterize these populations, we next sorted CD34+CD133+KS from cells cultured in SEEM and CD34−CD133+KS and CD34−CD133−KS from cells cultured in SEDM and assayed for stress BFU-E formation using media containing only Epo (mature stress BFU-Es) or Epo + BMP4 + SCF at 2% O2 (maximal number of stress BFU-Es).5 The CD34−CD133−KS cells gave rise to the majority of stress BFU-Es observed in either condition. The CD34−CD133+KS cells exhibited greater stress BFU-E–forming ability than the CD34+CD133+KS cell, but it was still significantly less than the CD34−CD133−KS cells (Figure 3C). These data show that CD34+CD133+KS cells represent the most immature stress progenitors, CD34−CD133−KS cells are the most mature population, and CD34−CD133+KS cells represent a transition stage. This characterization was further strengthened by the analysis of gene expression in the different populations. CD34+CD133+KS cells expressed higher levels of genes associated with stem cell self-renewal, Bmi124,25 and Yap1.26 In addition, Spi1/Pu.1,21,27 which is required for the self-renewal of Friend virus LSCs and fetal liver BFU-Es, and Tal1 (Scl),28 which is required for BFU-E formation, are also preferentially expressed in the CD34+CD133+KS cell. In contrast, genes associated with erythroid differentiation (Gata2, Gata1, and Trp53) are expressed at higher levels in the CD34−CD133−KS population.29,30 Similarly, Numb, whose expression is associated with progenitor cells produced by asymmetric divisions in stem cells, is also expressed at higher levels in the more mature cells.31 Similar to what we observed with the stress BFU-E formation, CD34−CD133+KS cells exhibited intermediate expression consistent with this population being a transitional stage (Figure 3D).
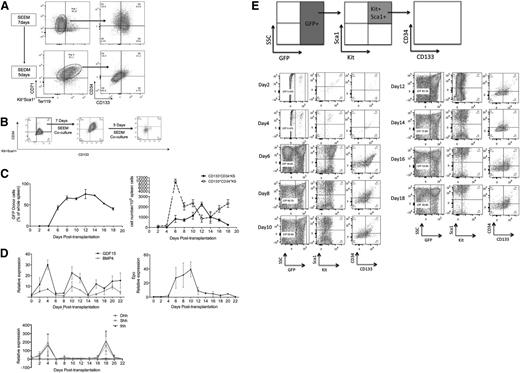
To establish the relationship between population I and the subpopulations defined by CD34 and CD133, we cultured bone marrow cells in SEEM for 7 days and analyzed the Kit+Sca1+ cells for expression CD71 and Ter119 and then for CD34 and CD133 expression. Under these conditions, population I cells are primarily CD34+CD133+ and CD34−CD133+ cells. When the cultures were shifted to SEDM for 5 days, analysis of the Kit+Sca1+ population showed that the majority of these cells had matured to population II cells (Kit+Sca1+CD71+Ter119med). Analysis of these cells showed that they were primarily CD34−CD133− (Figure 4A). These data demonstrate that the development of population I to population II cells also reflects the transition from CD34+CD133+KS through the CD34−CD133+KS intermediate to CD34−CD133−KS cells.
The developmental progression of stress erythroid progenitors in vitro and in vivo. (A) Unfractionated bone marrow cells were cultured in SEEM for 7 days (top), and the cells were switched into SEDM for 5 days (bottom). Representative flow cytometry analysis of population I and II cells using Kit+Sca1+ gated cells analyzed for CD71 and Ter119 (left) and CD34 and CD133 (right). (B) GFP+ CD34+CD133+KS cells were sorted by flow cytometry (left) and cocultured with GFP− bone marrow cells in SEEM for 7 days (center) and then switched SEDM (right) for 5 days. At each step, GFP+ cells were gated on Kit+Sca1+ and analyzed for CD34 and CD133 expression. (C) Percentage of donor-derived (GFP+) cells in the spleen on the indicated days posttransplant (left). Total numbers of donor-derived CD34+CD133+KS and CD34−CD133−KS cells on the indicated days posttransplant (right). Numbers indicate mean ± standard error of the mean. (D) Analysis of the mRNA expression of GDF15, BMP4, Ihh, Shh, and Dhh in the spleen and of Epo in the kidney on the indicated days posttransplant. mRNA expression of the indicated genes was determined by qRT-PCR and expressed relative to the housekeeping gene Gapdh (2ΔΔCt). (E) Unfractionated GFP+ bone marrow cells were transplanted in GFP− recipient mice on the indicated days posttransplant, and spleen GFP+ cells were analyzed as indicated at the top of the figure.
The developmental progression of stress erythroid progenitors in vitro and in vivo. (A) Unfractionated bone marrow cells were cultured in SEEM for 7 days (top), and the cells were switched into SEDM for 5 days (bottom). Representative flow cytometry analysis of population I and II cells using Kit+Sca1+ gated cells analyzed for CD71 and Ter119 (left) and CD34 and CD133 (right). (B) GFP+ CD34+CD133+KS cells were sorted by flow cytometry (left) and cocultured with GFP− bone marrow cells in SEEM for 7 days (center) and then switched SEDM (right) for 5 days. At each step, GFP+ cells were gated on Kit+Sca1+ and analyzed for CD34 and CD133 expression. (C) Percentage of donor-derived (GFP+) cells in the spleen on the indicated days posttransplant (left). Total numbers of donor-derived CD34+CD133+KS and CD34−CD133−KS cells on the indicated days posttransplant (right). Numbers indicate mean ± standard error of the mean. (D) Analysis of the mRNA expression of GDF15, BMP4, Ihh, Shh, and Dhh in the spleen and of Epo in the kidney on the indicated days posttransplant. mRNA expression of the indicated genes was determined by qRT-PCR and expressed relative to the housekeeping gene Gapdh (2ΔΔCt). (E) Unfractionated GFP+ bone marrow cells were transplanted in GFP− recipient mice on the indicated days posttransplant, and spleen GFP+ cells were analyzed as indicated at the top of the figure.
Based on these observations, we propose that maturation of population I to population II stress progenitors proceeds through 3 distinct stages: CD34+CD133+KS to CD34−CD133+KS to CD34−CD133−KS cells. We tested this hypothesis by growing unfractionated bone marrow cells from GFP+ mice15 in SEEM for 7 days. We isolated CD34+CD133+KS GFP+ cells and cocultured them with GFP− unfractionated bone marrow. When cultured in SEEM, the cells were maintained as CD34+CD133+KS cells, but once they were cultured in SEDM, the CD34+CD133+KS cells transitioned from CD34−CD133+KS to CD34−CD133−KS cells, demonstrating this developmental progression (Figure 4B). We next tested whether this progression occurs in vivo in the spleen during the recovery from BMT. Unfractionated bone marrow isolated from GFP+ mice (5 × 10⁵ cells per recipient) was transplanted into lethally irradiated C57BL/6 recipients. The greatest expansion of donor-derived cells occurs between days 4 and 6 posttransplant (Figure 4C). The day-6 time point corresponds to the time when the greatest percentage of donor-derived cells in the spleen is CD34+CD133+KS. This observation supports the hypothesis that this population is the amplifying population. Expression of BMP4, GDF15, Ihh, and Shh corresponds to this period of rapid expansion (Figure 4D). Interestingly, Dhh is expressed at significantly lower levels and observed later during recovery, which is consistent with its role as a negative regulator.32 Furthermore, the expression of Epo in the kidney is not induced until day 6, which correlates with the initial increase in CD34−CD133−KS cells. Flow cytometry analysis of the donor cells in the spleen shows that CD34+CD133+KS cells transition through a CD34−CD133+KS stage to CD34−CD133−KS cells over the next 10 days (days 6-16) of the recovery phase (Figure 4E). After that time, new cells enter the spleen and repopulate the CD34+CD133+KS cell population.
Analysis of gene expression of CD34+CD133+KS cells isolated on day 6, CD34−CD133+KS cells isolated on day 8, and CD34−CD133−KS cells on day 12 after transplant showed that the expression of stem cell genes and erythroid differentiation genes by cells of the 3 populations was similar to what we observed in the in vitro cultures (Figure 5A). Furthermore, if we sorted GFP+CD34+CD133+KS cells from recipient mice on days 6 and 8 after transplant and put them into culture in SEEM + Epo media with GFP− bone marrow cells, we observe that by 3 days of culture, the CD34+CD133+KS cells had transitioned to CD34−CD133+KS, and by 7 days of culture, the majority of cells were CD34−CD133−KS (Figure 5B). These data support the observation that the 3 populations of stress progenitors generated in in vitro culture recapitulate the 3 populations observed in vivo during the recovery from BMT.
In vivo–isolated stress erythroid progenitors are similar to in vitro–expanded stress erythroid progenitors. (A) CD34+CD133+KS, CD34CD133+KS, and CD34−CD133−KS cells were sorted from the spleen on days 6, 8, and 12, respectively, by flow cytometry. mRNA expression of the indicated genes was determined by qRT-PCR and expressed relative to the housekeeping gene Gapdh (2ΔΔCt). (B) CD34+CD133+KS cells were sorted from the spleen on days 6 and 8 and combined and cultured in SEEM + Epo for 3 (top) or 7 days (bottom). Representative flow cytometry analysis of resulting cells is shown.
In vivo–isolated stress erythroid progenitors are similar to in vitro–expanded stress erythroid progenitors. (A) CD34+CD133+KS, CD34CD133+KS, and CD34−CD133−KS cells were sorted from the spleen on days 6, 8, and 12, respectively, by flow cytometry. mRNA expression of the indicated genes was determined by qRT-PCR and expressed relative to the housekeeping gene Gapdh (2ΔΔCt). (B) CD34+CD133+KS cells were sorted from the spleen on days 6 and 8 and combined and cultured in SEEM + Epo for 3 (top) or 7 days (bottom). Representative flow cytometry analysis of resulting cells is shown.
Identification of human stress erythroid progenitors that express γ-globin
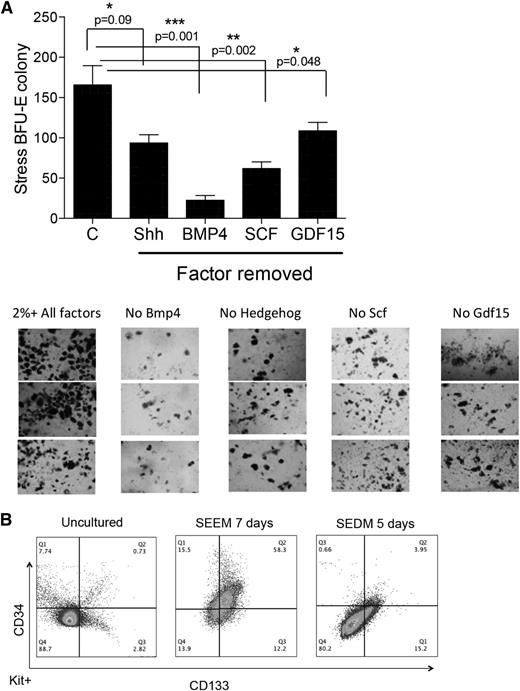
Stress erythropoiesis is best understood in the mouse because of our ability to induce anemia and analyze the recovery. The development of an in vitro culture system allows us to interrogate human stress erythropoiesis. We cultured unfractionated human bone marrow mononuclear cells in SEDM containing human factors. After 5 days in culture, we plated cells in methylcellulose containing only Epo to assay stress BFU-Es. As shown in Figure 5, these conditions rapidly generated stress BFU-Es. Removal of any one factor led to a significant decrease in the number and size of stress BFU-Es, with the strongest effects observed when BMP4 was left out of the media (Figure 6A). We next tested whether similar progenitor cells were generated in the human bone marrow cultures. Using SEEM containing human factors, we observed that CD34+CD133+KIT+ cells were preferentially expanded (Sca1 is not a marker for human progenitors). When these cells were switched into SEDM, we observed that the majority of cells became CD34−CD133−KIT+ (Figure 6B). These data show that human bone marrow contains progenitor cells that, when cultured in media that mimics stress erythropoiesis, generate stress BFU-Es that are derived from progenitors similar to those observed in murine stress erythropoiesis.
In vitro expansion of human stress erythroid progenitors. (A) Human unfractionated bone marrow cells were cultured in SEDM (indicated by C) or SEDM lacking the indicated factors for 5 days and plated in methylcellulose media containing Epo alone. Stress BFU-E colonies were scored after 12 days. Data are representative of 3 independent experiments using bone marrow from 3 different human donors. Below, representative pictures of BFU-E colonies are shown. Photos were taken with a Nikon ECLIPSE TE200 microscope at 4× magnification with the camera software DP2-BSW. (B) Flow cytometry analysis of untreated human bone marrow (left), after culture for 7 days in SEEM (middle), and after the cells were switched in SEDM (right). The cells were gated on KIT+, and the expression of CD34 and CD133 was analyzed.
In vitro expansion of human stress erythroid progenitors. (A) Human unfractionated bone marrow cells were cultured in SEDM (indicated by C) or SEDM lacking the indicated factors for 5 days and plated in methylcellulose media containing Epo alone. Stress BFU-E colonies were scored after 12 days. Data are representative of 3 independent experiments using bone marrow from 3 different human donors. Below, representative pictures of BFU-E colonies are shown. Photos were taken with a Nikon ECLIPSE TE200 microscope at 4× magnification with the camera software DP2-BSW. (B) Flow cytometry analysis of untreated human bone marrow (left), after culture for 7 days in SEEM (middle), and after the cells were switched in SEDM (right). The cells were gated on KIT+, and the expression of CD34 and CD133 was analyzed.
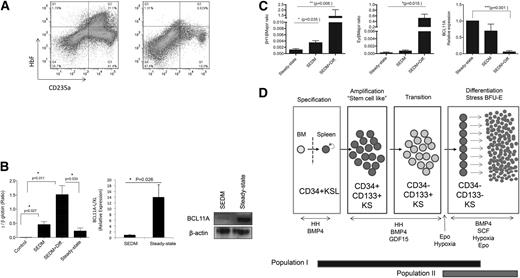
Previous work on human stress erythropoiesis suggested that it is more similar to fetal erythropoiesis and is associated with the expression of HbF.9-14 We tested whether cells grown in stress erythropoiesis culture conditions expressed HbF. In Figure 7, the data demonstrate that cells cultured in SEDM generated significant numbers of HbF+ cells when compared with bone marrow cells cultured under steady-state conditions (Epo + SCF at 20% O2) (Figure 7A). Analysis of γ-globin expression by qRT-PCR showed that the γ:β-globin ratio was significantly higher in cells grown in SEDM than in cells grown under steady-state conditions. The increase in γ-globin was further enhanced when cultures grown in SEDM for 5 days were shifted into media mimicking stress BFU-E assay conditions (Epo + SCF + BMP4 at 2% O2 for 3 additional days − SEDM + Diff), which resulted in a γ:β ratio of ∼1.5. γ-Globin expression is tightly regulated.33 BCL11A (XL/L) is a repressor that plays a key role in silencing the γ-globin gene in adults.34 When human bone marrow cells were grown under stress erythropoiesis conditions, BCL11A mRNA and protein expression is very low, which explains the high level of γ-globin and HbF observed in these cells (Figure 7B). In mice, Bcl11a represses the expression of the embryonic β-globin genes βH1 and εy. Analysis of murine stress erythroid progenitors showed that they expressed low levels of Bcl11a and had increased expression of βH1 and εy, with the ratio of βH1 to β major expression reaching ∼1.5 (Figure 7C). These data support the idea that stress erythroid progenitors are predisposed to express embryonic/fetal β-globin genes, an idea consistent with stress erythropoiesis being more similar to embryonic/fetal erythropoiesis.
Human and murine stress BFU-Es express embryonic/fetal β-globin genes. (A) Flow cytometry analysis of HbF in CD235a+ cells in human bone marrow cells cultured in SEDM (left) or cultured in steady-state erythropoiesis media (Epo + SCF at 20% O2) (right). (B) qRT-PCR analysis of β- and γ-globin expression in human bone marrow cells prior to culture (control), cultured in SEDM for 5 days (SEDM), cultured in SEDM for 5 days, then switched to stress BFU-E media Epo + BMP4 + SCF at 2% O2 for 3 days (SEDM + Diff) or cultured in steady-state conditions (Epo + SCF at 20% O2) (left). Expression is expressed as a γ-globin to β-globin ratio. The expression of BCL11a (L/XL) mRNA and protein was examined by qRT-PCR analysis (center) and by western blot (left), respectively, in human bone marrow cells cultured in SEDM for 5 days or steady-state conditions. (C) The expression of murine embryonic β-globin genes βH1 (left) and εy (center) and Bcl11a (right) was examined by qRT-PCR in murine bone marrow cells cultured in SEDM for 5 days (SEDM) and SEDM for 5 days and then switched to stress BFU-E media Epo + BMP4 + SCF at 2% O2 for 3 days (SEDM + Diff) or cultured in steady-state conditions (Epo + SCF at 20% O2). Data are mean ± standard error of the mean. (D) Schematic of stress erythroid progenitor development.
Human and murine stress BFU-Es express embryonic/fetal β-globin genes. (A) Flow cytometry analysis of HbF in CD235a+ cells in human bone marrow cells cultured in SEDM (left) or cultured in steady-state erythropoiesis media (Epo + SCF at 20% O2) (right). (B) qRT-PCR analysis of β- and γ-globin expression in human bone marrow cells prior to culture (control), cultured in SEDM for 5 days (SEDM), cultured in SEDM for 5 days, then switched to stress BFU-E media Epo + BMP4 + SCF at 2% O2 for 3 days (SEDM + Diff) or cultured in steady-state conditions (Epo + SCF at 20% O2) (left). Expression is expressed as a γ-globin to β-globin ratio. The expression of BCL11a (L/XL) mRNA and protein was examined by qRT-PCR analysis (center) and by western blot (left), respectively, in human bone marrow cells cultured in SEDM for 5 days or steady-state conditions. (C) The expression of murine embryonic β-globin genes βH1 (left) and εy (center) and Bcl11a (right) was examined by qRT-PCR in murine bone marrow cells cultured in SEDM for 5 days (SEDM) and SEDM for 5 days and then switched to stress BFU-E media Epo + BMP4 + SCF at 2% O2 for 3 days (SEDM + Diff) or cultured in steady-state conditions (Epo + SCF at 20% O2). Data are mean ± standard error of the mean. (D) Schematic of stress erythroid progenitor development.
Discussion
Our previous characterization of the signals that regulate stress erythropoiesis has allowed us to develop an in vitro culture system that recapitulates the development of stress erythroid progenitors from bone marrow cells. Several features of culture system demonstrate how it parallels the in vivo situation. Although our previous work showed that CD34+KSL cells give rise to stress erythroid progenitors in the spleen,7 we found that in vitro, these cells needed a microenvironment to develop. In particular, this microenvironment needed macrophages. In fact, if we sorted the macrophages out of the cultures, the progenitors failed to survive (data not shown). This observation supports the recent work showing that ablating macrophages chemically or genetically severely compromises stress erythropoiesis.19,20 The second important feature of the culture system is that we can mimic the expansion and differentiation stages of stress erythropoiesis that we previously showed to occur in vivo during the recovery from BMT. Using this system, we identified Epo and hypoxia as the signals that promote the transition from expanding stress erythroid progenitors to differentiating progenitors. By manipulating these signals in the cultures, we can study the mechanisms that regulate each stage of stress erythroid progenitor development. In addition, these data support a model where immature stress erythroid progenitors initially rapidly expand in the spleen but are unable to differentiate until tissue hypoxia reaches such levels that Epo expression in the kidney is induced. This mechanism ensures that a large number of progenitor cells are produced such that once they start to differentiate, sufficient erythrocytes will be made to alleviate the anemia (Figure 7D).
Our previous work identified population I stress progenitors that developed in population II progenitors during recovery from BMT.7 Using the in vitro culture system, we demonstrated that population I cells could be further subdivided into 3 distinct populations based on their expression of CD34, CD133, Kit, and Sca1. CD34+CD133+KS cells are the most immature and are preferentially expanded in SEEM, a medium that lacks Epo and hypoxia. In vivo, this population of cells rapidly expands during days 4 to 6 posttransplant to establish a large amplifying population of cells that will further differentiate in response to Epo and hypoxia. Following those signals, these cells transition through an intermediate stage of CD34−CD133+KS cells to CD34−CD133−KS cells. This latter population is the most mature of the 3 populations and contains the stress BFU-E activity. Although our in vitro and in vivo data suggest a distinct developmental pathway of CD34+CD133+KS to CD34−CD133+KS to CD34−CD133−KS, the cells are actually more plastic in their development and respond to signals in their microenvironment. Similar to the experiment in Figure 4B, we also sorted CD34−CD133+KS and CD34−CD133−KS GFP+ cells and cultured them with GFP− unfractionated bone marrow. When cells were cultured in SEEM, all the cells reverted to the CD34+CD133+KS phenotype, which then transitioned through CD34+CD133+KS to CD34+CD133+KS when the cells were switched into SEDM (supplemental Figure 2). We observed a similar effect in vivo. All 3 of these populations can provide erythroid-restricted radioprotection when transplanted into lethally irradiated mice (supplemental Figure 3). However, after recovery from transplant with any of the 3 populations, when we examined the donor cells present in the spleen, we observed that the residual population present was CD34+CD133+KS. These data support a model where stress erythroid progenitors can move along a developmental continuum based on signals in the microenvironment.
Stress erythropoiesis has been more extensively characterized in the mouse than in humans, where studies are limited to examining erythropoiesis in patients with severe anemia. One overarching theme in stress erythropoiesis is that it is more similar to fetal erythropoiesis than adult erythropoiesis.9-14 Stress erythroid progenitors expanded in our cultures express low levels of Bcl11a and, as a consequence, express higher ratios of fetal/embryonic to adult β-globins. Although recent work demonstrated that an erythroid-specific enhancer regulates the expression Bcl11a,35 additional regulatory mechanisms must come into play in stress progenitors. These observations suggest that mobilizing stress erythroid progenitors could be a means of treating sickle cell anemia and thalassemia, as it is well known that the expression of γ-globin and HbF in these patients can ameliorate the symptoms of these diseases. Indeed previous studies may have identified a similar population of stress erythroid progenitors in the peripheral blood of sickle cell anemia patients. Luck et al showed that these cells expressed KIT, CD34, CD71, and glycophorin A (CD235a) and expressed HbF when differentiated in culture.36 The relationship between these progenitors and the stress erythroid progenitors that we expanded in culture remains to be determined, but the observation that putative stress erythroid progenitors may be mobilized in sickle cell anemia suggests that this pathway may be a target for therapeutic intervention.
The online version of this article contains a data supplement.
The publication costs of this article were defrayed in part by page charge payment. Therefore, and solely to indicate this fact, this article is hereby marked “advertisement” in accordance with 18 USC section 1734.
Acknowledgments
The authors thank Jane Little for providing the sequences for the βH1 and εy qRT-PCR probes. The authors also thank the members of the Paulson laboratory for comments on both the manuscript and the work.
This work was supported by the National Institutes of Health National Institute of Diabetes and Digestive and Kidney Diseases grant R01DK080040 (R.F.P.), an American Society of Hematology Bridge grant (R.F.P.), and the USDA National Institute of Food and Agriculture Hatch Project #4736 (R.F.P.). This work was submitted as partial fulfillment of the requirements for a PhD in biochemistry, microbiology, and molecular biology (D.-C.W.) and a PhD in molecular and cellular integrative biosciences (J.X.).
Authorship
Contribution: J.X., D.-C.W., Y.C., and R.F.P. designed experiments and analyzed data; D.-C.W., J.X., and R.F.P. developed the culture assay; D.-C.W. and R.F.P. identified erythroid-specific progenitors; J.X., Y.C., and D.-C.W. performed experiments; and J.X. and R.F.P. wrote the paper.
Conflict-of-interest disclosure: R.F.P. is a founder and stockholder of OncOmega Inc. The remaining authors declare no competing financial interests
The current affiliation for D.-C.W. is Department of Stem Cell Biology and Regenerative Medicine, Howard Hughes Medical Institute, Stanford University School of Medicine, Stanford, CA.
Correspondence: Robert F. Paulson, 115 Henning Building, Department of Veterinary and Biomedical Sciences, The Pennsylvania State University, University Park, PA 16802; e-mail: rfp5@psu.edu.
References
Author notes
J.X. and D.-C.W. contributed equally to this study.

