Abstract
Introduction: AL amyloidosis is a rare and life-threatening protein-deposition disorder caused by a small B cell (mostly plasma cell) clone which produces amyloidogenic light chains. The goal of therapy is to target this clone and halt the uncontrolled release of free light chain, which might subsequently lead to improvement of organ function. In routine diagnostic some of these B cell clones are missed as they might be extremely small. However, specific treatment can only be applied if the clone is well characterized. Hardly any data on the characteristics of these cells using flow cytometry have been reported. (e.g. Paiva et al., Blood 2011).
Study design: We performed a retrospective analysis of consecutive patients who were referred to our amyloidosis center (March to July 2014) and have been thoroughly studied (immunhistology of amyloid, free light chain assay, immunofixation, bone marrow diagnostic: cytology, flow cytometry and interphase-FISH cytogenetics (iFISH)).
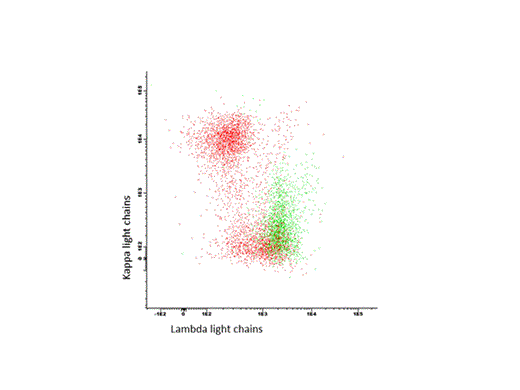
Patients and Methods: Twenty-two patients were included (all untreated, 21 AL patients, one pt with monoclonal gammopathy of renal significance (MGRS)). Plasma cells were detected by their co-expression of CD38 and CD138 antigens. Differentiation between malignant and normal plasma cells was achieved by analysis of aberrant CD45 and CD19 expressions and proof of intracellular light chain restriction (see Figure 1 ). To evaluate potential targets for an antibody-based immunotherapy, we stained CD20, CD22, CD30, CD52 and CS-1 on these plasma cells. Overall, positivity was defined as >20% expression of the antigen. iFISH was done after CD138 selection as previously described (Bochtler et al., Blood 2011).
Results: Main characteristics and results are shown in Table 1. Median dFLC was 304 mg/l, three patients had a dFLC of less than 50 mg/l. Median plasma cell count in cytology was 10%, 3 patients had less than 5%. Median plasma cell count by flow was 3.8%, three patients had less than 1%. Correlation between dFLC, plasma cell count in cytology and flow was low (FLC vs. flow: spearman=0.25, p=0.26; FLC vs. cytology: spearman=0.49, p=0.02; flow vs. cytology, spearman=0.36, p=0.1). Detection of the amyloidogenic clone by flow was possible in all but one patient (95%). In this patient we were not able to show a light chain restriction although we detected a relevant aberrant plasma cell clone (CD45low, CD19low). In one patient we found a B cell lymphoma as underlying disease for MGRS type IgG lambda (CD19+, CD20+, lambda+, CD5-, CD22+, FMC7-, CD23-, CD25+, CD103-, CD38+ typical for marginal zone lymphoma). In all 21 patients the light chain restriction demonstrated by flow was confirmed by immunofixation, FLC, and immunohistology of the amyloid. All patients analyzed for the expression of CS-1 were positive. 25% were also positive for CD20 and none was positive for CD22, CD30 and CD52. Detection of the plasma cell clone by iFISH was possible in all 21 patients (see Table 1).
Conclusion: Flow cytometric analysis of the bone marrow is a very sensitive method to detect and characterize the amyloidogenic clone in AL amyloidosis. B cell lymphomas can easily be distinguished from pure plasma cell clones. Secondly, flow provides useful information to specify immune-chemotherapy in AL amyloidosis and related disorders.
Patients (n=22) Characteristics and Results
| Age in yrs (median / range) . | 67 (41 – 77) . |
|---|---|
| Sex: female / male | 9 / 13 |
| Type of light chain: kappa / lambda | 4 / 18 |
| Median dFLC in mg/l (range) | 304 (22 - 6621) |
| Median % of plasma cells in BM cytology (range) | 10 (0 – 68) |
| Underlying disease leading to AL amyloidosis “MG” / MM III / B-NHL | 20 / 1 / 1 |
| Median % of PC by flow (range) | 3.8 (0.2 - 34) |
| Detection of the amyloidogenic clone by flow | 21 / 22 |
| Flow analysis of clonal plasma cells (% of pts) CD20+ / CD22+ / CD30+ / CD52+ / CD56+ / CS-1+ | 25 / 0 / 0 / 0 / 75 / 100 |
| Detection of a clone by iFISH | 21/21 |
| % of pts with t(11;14) / Gain of 1q21 / Hyperdiploidy / High-risk cytogenetic (del 17p13, t(4;14)) | 52 / 10 / 14 / 10 |
Representative flow analysis of one pt. with a lambda+, CD38+, CD138+ plasma cell clone (green). Polyclonal CD19+ B cells in red.
Representative flow analysis of one pt. with a lambda+, CD38+, CD138+ plasma cell clone (green). Polyclonal CD19+ B cells in red.
Schönland:Janssen: Honoraria; Celgene: Honoraria. Hegenbart:Janssen: Honoraria; Celgene: Honoraria. Hose:Novartis: Research Funding. Hundemer:Celgene: Honoraria, Research Funding.
Author notes
Asterisk with author names denotes non-ASH members.


This feature is available to Subscribers Only
Sign In or Create an Account Close Modal