

Abstract
Molecular and cytogenetic alterations are involved in virtually every facet of acute myeloid leukemia (AML), including dysregulation of major signal-transduction pathways. The present study examines 5 phosphoproteins (pErk, pAkt, pS6, pStat3, and pStat5) in response to 5 cytokine/growth factors (stem cell factor [SCF], Flt-3/Flk-2 ligand [FL], granulocyte/macrophage-colony stimulating factor [GM-CSF], interleukin-3 [IL-3], and granulocyte-CSF [G-CSF]) within 7 immunophenotypically defined populations, spanning progenitor to mature myeloid/myelomonocytic cells in normal bone marrows with further comparison to AML samples. The normal cohort showed pathway-specific responses related to lineage, maturation, and stimulus. Heterogeneous-signaling responses were seen in homogeneous immunophenotypic subsets emphasizing the additive information of signaling. These profiles provided a critical baseline for detection of dysregulated signaling in AML falling into 4 broad categories, viz lack of response, increased activation, altered constitutive expression, and dysregulated response kinetics, easily identified in 10 of 12 AMLs. These studies clearly show robust and reproducible flow cytometry phosphoprotein analyses capable of detecting abnormal signal-transduction responses in AML potentially contributing to definitive reliable identification of abnormal cells. As functional correlates of underlying genetic abnormalities, signal-transduction abnormalities may provide more stable indicators of abnormal cells than immunophenotyping which frequently changes after therapy and disease recurrence.
Introduction
Current standard of practice for hematopathologic diagnosis of acute myeloid leukemia (AML) uses flow cytometry (FCM) for immunophenotypic confirmation of myeloid/myelomonocytic lineage and identification of aberrant marker expression on abnormal cells. This role is nearly universal at diagnosis and recurrence but is variably applied after therapy to monitor minimal residual disease (MRD).1 After chemotherapy, regenerating bone marrow (BM) present a frequent diagnostic dilemma when increased blasts are present, but morphologically and immunophenotypically, it is unclear whether they are normal or abnormal and the fraction of residual disease is not quantifiable. Although immunophenotypic abnormal marker expression can be helpful,2 a significant subset of cases do not show overt aberrant antigen expression. Recent robust cell-based analyses of phosphoprotein expression within the context of immunophenotyping3-6 provide a means to ask whether measurement of aberrant cell signaling could solve this dilemma. Current thinking is that cell signaling is aberrant in virtually all AMLs, and several studies provide evidence that detection of abnormal signaling is feasible.3,7-13 However, critical to this effort is characterization of signaling in normal and regenerating BM as a means of comparison. To define the characteristics of normal cell signaling within the context of differentiation/maturation, we have measured phosphoprotein expression (pErk, pAkt, ribosomal pS6, pStat3, and pStat5) within the pathways modulated by stem cell factor (SCF), Flt-3/Flk-2 ligand (FL), interleukin-3 (IL-3), granulocyte/macrophage-colony stimulating factor (GM-CSF), and granulocyte-CSF (G-CSF) within lymphocytes and 6 immunophenotypically defined populations from progenitor to mature myeloid/myelomonocytic cells in normal adult BM. Further comparison of these results to a small cohort of AMLs showed that signaling is universally aberrant (within the cohort), easily quantified, and robust, suggesting that a study of MRD is warranted.
In designing such a study, the variables are (1) whether to stimulate or measure constitutive signaling, (2) if stimulation is involved, which cytokines/growth factors (GFs) to use and when to measure, (3) whether to use “whole blood” methods4 or subject samples to some level of complexity reduction, and (4) which source of normal cells to use. As earlier studies3,8,10 have shown that both constitutive signaling and cytokine stimulation studies have utility in determining dysregulations, both of these were incorporated in the present study.
The major receptor tyrosine kinases (RTK) on normal blast cells include Flt3R and c-Kit/(CD117), genes of both are found to be frequently mutated in AML. FLT3 is mutated in ∼ 30%-40% of AML and mutant forms carry important prognostic implications14,15 in addition to altered signaling.15-17 c-KIT mutations occur in ∼ 5%-10% of AML.18 In addition, both c-Kit and Flt3 inhibitors are either used clinically or are in various stages of clinical trials.19 Therefore, these ligand/receptor systems were included as a primary focus. IL-3, G-CSF, and GM-CSF are key regulators of myeloid differentiation, acting primarily through the Janus kinase (JAK)/signal transducer and activator of transcription (STAT) regulatory network.20 Because mutation or altered expression of these receptors are rare, and AML blasts express IL-3R,21 these 3 cytokine/GFs were included in part that normal signaling might predominate in this group (although an abnormal response to IL-3 stimulation has been reported9 ). In addition, this subset of cytokine/GFs signal through the JAK/STAT network in contrast to c-Kit/Flt3 which primarily act through mitogen-activated protein kinase (MAPK) and PI3/AKT networks.
Preliminary work provided a time range during which robust signals could be detected. “Whole blood” stimulation for AML-signaling experiments4 was chosen as it is less manipulative than standard methods of purification or red blood cell lysis. Finally, discarded bone fragments from orthopedic hip replacement surgery were used as an abundant source of normal BM. The large amount of cells available in these samples provided the ability to explore many of the technical variables involved in a complete manner.
Methods
Normal/AML BM
Eleven discarded BM from patients undergoing hip replacement surgery were received within 1 hour of extraction. Under the approved collection protocol, no demographic data were available; however, Wright-Giemsa–stained smears were examined by a hematopathologist (A.C.) to confirm that no underlying hematologic disorders were present. This normal BM suspension collected in 7.5 mL of Iscove modified Dulbecco medium (IMDM) was filtered (100 μm-nylon cell strainer; BD Falcon), washed in IMDM, resuspended at 3 × 10⁷ cells/mL and processed within 3 hours of extraction. BM samples from 12 AML patients sent for routine FCM analyses (Northwestern Memorial Hospital [NMH] Clinical Flow Cytometry Laboratory) were processed within 4 hours of BM procedure as discarded pathology material under Northwestern University institutional review board–approved protocol.
Reagents/antibodies
Orthopedic BM samples were suspended and washed in 37°C sterile 1× IMDM (Invitrogen) containing 100 U/mL penicillin, 0.01 ng/mL streptomycin (Sigma-Aldrich), and 70 μg/mL heparin sodium-salt (Sigma-Aldrich). Formaldehyde (10%), Triton-X 100 (0.1%), methanol (80%), phosphate-buffered saline (PBS) pH 7.2, 2% bovine serum albumin (BSA), and ammonium chloride (NH4Cl) red blood cell (RBC) lysing solutions were prepared as previously described.3 A 25% solution of heat-inactivated normal mouse serum (Abcam) and normal rabbit serum (Abcam) in PBS was used to block nonspecific antibody binding. Wright-Giemsa stain (Sigma-Aldrich) was used according to manufacturer's recommendations to stain BM smears.
Cytokine/GFs were prepared fresh from stock by diluting in PBS just before use. The cytokine/GFs and inhibitors were used at final concentrations as follows: 10 ng/100 μL recombinant human (rh)–SCF (R&D Systems); 50 ng/100 μL rh-FL (R&D Systems); 10 ng/100 μL rh-GM-CSF (R&D Systems); 10 ng/100 μL rh-IL-3 (R&D Systems); 10 ng/100 μL rh-G-CSF (ORF Genetics); 100μM UO126 (EMD Chemicals); 1μM LY294002 (EMD Chemicals); and 1μM rapamycin (EMD Chemicals). The following fluorescent-conjugated monoclonal antibodies were used: CD11b–Pacific Blue (PB), CD16–Alexa Fluor 700 (A700), and CD114–phycoerythrin (PE) from BD Biosciences. CD15–Pacific Orange (PO) from Invitrogen. CD34-PE–Texas Red (ECD), CD64-PE, CD116-PE, and CD135-PE from Beckman Coulter. CD13-PE–cyanin-7 (PC7), CD64-allophycocyanin (APC), CD117-PE–Cyanin-5.5 (PC5.5), CD45-APC–Alexa Fluor 750 (APC-A750), pS6(Ser235/236)-PB, and pStat5(Tyr694)-PE custom conjugates from Beckman Coulter. pErk(phospho-p44/42 MAPK[Erk1/2][Thr202/Tyr204])–Alexa Fluor 488 (A488), pAkt(Ser473) Alexa Fluor 647 (A647), and pStat3(Tyr705)-A488 from Cell Signaling Technology.
Immunophenotypic and growth factor receptor analysis of normal BM and AML BM
Four tubes at 3 × 10⁶ cells/tube were incubated with 2 mL of NH4Cl for 5 minutes at room temperature (RT), centrifuged (200g) at RT for 5 minutes, washed twice with PBS, and resuspended in 75 μL of blocking serum solution. The following antibodies were added at optimized titer to all tubes: CD11b-PB, CD15-PO, CD34-ECD, CD117-PC5.5, CD13-PC7, CD64-APC, CD16-A700, CD45-APC-A750. One tube served as a control without PE-conjugated antibody and the remaining tubes were incubated with either CD114-PE, CD116-PE, or CD135-PE. Additional samples stained with single antibodies were used for fluorescence compensation. Suspensions were incubated 30 minutes at 4°C, washed twice with PBS before analysis.
Cytokine/growth factor stimulation and intracellular phosphoprotein analysis
Aliquots of normal, unprocessed BM, and AML BM samples were used for cytokine/GF stimulation or kinase inhibitor treatment at 3 × 10⁶ cells/100 μL. Samples were incubated at 37°C for 30 minutes before cytokine/GFs or inhibitor addition. Inhibition was carried out with a cocktail of U0126 + LY294002 + rapamycin for 30 minutes at 37°C. Individual tubes were stimulated with either SCF, FL, GM-CSF, IL-3, or G-CSF and collected at 5 time points (2 minutes, 3.5 minutes, 7 minutes, 15 minutes, and 30 minutes) by immediate fixation with formaldehyde. One tube receiving no stimulant or inhibitor was also processed. After stimulation/inhibition, samples were fixed, permeabilized, and washed according to previously described protocol3 with the following modifications. Two sets were processed, 1 for permeabilization without methanol for pAkt, pErk, and pS6 staining and the other with 80% methanol permeabilization for pStat3 and pStat5 staining. Previous work clearly showed the necessity of methanol permeabilization for unmasking of pStat epitopes.22 However, Triton-X 100 permeabilization was sufficient for detection of pErk/pAkt/pS6 epitopes studied, and, in fact, methanol was detrimental for pAkt/pS6 staining. In addition, because CD13, CD16, and CD64 surface labeling is negatively affected by Triton-X 100/methanol, these antibodies were added to each tube 20 minutes before formaldehyde fixation. Experiments comparing this to postfixation staining demonstrated that signaling was unaffected (data not shown).
Intracellular phosphoprotein staining
After fixation/permeabilization, suspensions were washed, resuspended in blocking serum solution, and stained with either CD15-PO, CD34-ECD, CD117-PC5.5, CD45-APC-A750 (or CD45-PO, in which case CD15-PO was omitted) pS6-PB, pErk-A488, pAkt-A647 or CD15-PO, CD34-ECD, CD117-PC5.5, CD45-APC-A750 (or CD45-PB), pStat3-A488, pStat5-PE. Suspensions were incubated 45′ on ice, washed twice with ice-cold PBS/BSA, centrifuged (800g) 6′ at 4°C, and resuspended in 250 μL of ice-cold PBS for data acquisition.
Data acquisition
Data were acquired on either Gallios (Beckman Coulter) or CyAn ADP (Beckman Coulter) flow cytometers equipped with 488 nm, 405 nm, and 635 nm lasers and standard filters. For each sample, a minimum of 1500 CD45dim/CD34+ events were collected.
Data analyses
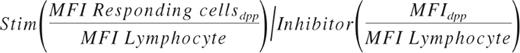
Data were analyzed using FCS Express Version 3 (De Novo Software). The fraction of responding cells for each population was determined from single parameter phosphoprotein histograms based on a fixed region set on the inhibitor treated control at ∼ 3%. A large amount of preliminary data demonstrated that lymphocytes do not shift in response to the 5 cytokine/GFs or inhibitor cocktail. For normal BM samples, the lymphocyte mean fluorescent intensity (MFI) ranges for pErk, pS6, pAkt, pStat3, and pStat5 were 2.3-4.1 (coefficient of variation [CV] = 22.5%), 3.4-8.5 (CV = 33.6%), 7.1-10.2 (CV = 12.7%), 2.7-4.6 [CV] = 18.9%), and 2.6-4.9 (CV = 22.5%), respectively. Therefore, MFIs of the lymphocyte populations served as a means to control for antibody staining and instrumental run-to-run variation. The magnitude of response was calculated comparing the stimulated tube to inhibitor control tube and ratioing MFI of the responding cells within each discrete phenotypic population (dpp) using the following formula:
Results
Cytokine/growth factor response (normal BM)
BM aliquots were stimulated with SCF, FL, GM-CSF, IL-3, or G-CSF as described in “Cytokine/growth factor stimulation and intracellular phosphoprotein analysis.” Based on analysis of 5 time points after stimulation, MFI and fraction responding were recorded at peak response for each protein, viz, 2 minutes for pAkt, 3.5 minutes for pErk, 15 minutes for pS6, and 15 minutes for both pStat3 and pStat5. To obtain signaling information for myeloid lineage subpopulations, we used the immunophenotypic gating scheme shown in Figure 1. The phosphoprotein responses following stimulation in the 6 nonlymphoid populations for the normal BM studied is summarized in Table 1. In the following text, the fraction or percent response of a defined population is taken as the highest fractional value across all phosphoprotein readouts based on the rationale that the true fraction cytokine responsive cells is no lower than that but is likely even higher because cells do not respond as a completely synchronous wave.

Gating strategy used to select cell subpopulations for signal-transduction pathway analysis. (A) The CD45-APC-A750/side scatter (SS) pattern was used to isolate lymphocytes from nonlymphocytes, define a generous “blast” region, and exclude nucleated erythrocytes from the analysis. (B) Blasts were further enriched for CD34 and CD117 as shown using CD64-PE and SS characteristics to exclude potential contaminating monocytes and maturing granulocytic cells. (C) CD34 and CD117 profiles from this enriched region were used for defining the CD34-ECD+CD117-PC5.5+ and CD34-ECD−CD117-PC5.5+ populations as shown. (D) Mature monocyte and granulocyte enriched regions were defined based on combining the nonlymphocyte gate and CD64-PE and SS light characteristics as shown. (E) The defined granulocyte-enriched region was then further subdivided into immature granulocytes, intermediate granulocytes, and mature granulocytes based on CD13-PC7 and CD16-A700 characteristics as shown. This scheme defines 6 regions (CD34+/CD117+; CD34−/CD117+, immature, intermediate and mature granulocytes, and monocytes) from which signaling data were derived. Acquired on Gallios flow cytometer and analyzed with FCS Express Version 3.
Gating strategy used to select cell subpopulations for signal-transduction pathway analysis. (A) The CD45-APC-A750/side scatter (SS) pattern was used to isolate lymphocytes from nonlymphocytes, define a generous “blast” region, and exclude nucleated erythrocytes from the analysis. (B) Blasts were further enriched for CD34 and CD117 as shown using CD64-PE and SS characteristics to exclude potential contaminating monocytes and maturing granulocytic cells. (C) CD34 and CD117 profiles from this enriched region were used for defining the CD34-ECD+CD117-PC5.5+ and CD34-ECD−CD117-PC5.5+ populations as shown. (D) Mature monocyte and granulocyte enriched regions were defined based on combining the nonlymphocyte gate and CD64-PE and SS light characteristics as shown. (E) The defined granulocyte-enriched region was then further subdivided into immature granulocytes, intermediate granulocytes, and mature granulocytes based on CD13-PC7 and CD16-A700 characteristics as shown. This scheme defines 6 regions (CD34+/CD117+; CD34−/CD117+, immature, intermediate and mature granulocytes, and monocytes) from which signaling data were derived. Acquired on Gallios flow cytometer and analyzed with FCS Express Version 3.
Summary of mean and SD for phosphoprotein responses (rows) to cytokine/GF stimulation for each of the indicated immunophenotypically defined discrete populations (columns)
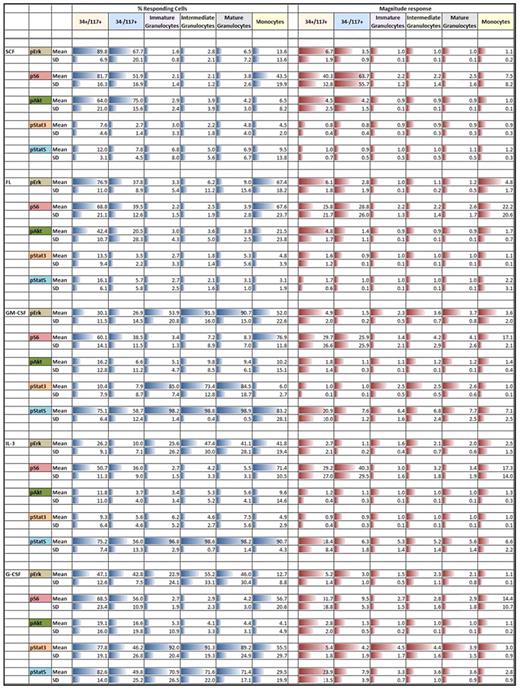
All percent responding mean values are scaled 0%-100%. All magnitude response values are scaled within a given phosphoprotein. Column and row headings are colored for easier visualization. Blue bars denote percent responding cells and red bars denote the magnitude of response. Length of bars is proportional to the numeric values.
SCF induced robust responses in CD34+CD117+ and CD34−CD117+ (CD11b−/CD13intermediate/CD15dim/CD16−/CD64intermediate) cells exclusively. Approximately 90% ± 7% of CD34+CD117+ cells showed up-regulation of pErk, pAkt, and pS6 reflected by fraction responding of 89.8%, 64.0%, and 81.7%, respectively, and 6.7, 4.5, and 40.3 MFI fold stimulation, respectively (Table 1 right column). Similar activation of pErk, pAkt, and pS6 (percent responding 60.6%, 75.0%, 51.9%, respectively) was seen in the CD34−CD117+ population with minimally 75% ± 16% of the cells responding. No activation of pErk, pAkt, or pS6 was seen in other more mature populations and no pStat3 or pStat5 activation was seen in any populations. Although similar published measurements have not been reported, the general SCF responses were as expected. However, although virtually all distributions were unimodal, unexpectedly, pS6 was bimodal in the CD34−CD117+ population. From unimodal distributions, we infer essentially 100% response with the fraction of cells in the unstimulated regions being reflective of the dim tail of the positive distribution overlapping with the negative region. This situation exists only where dim phosphoprotein expression exists and is a result of normal Gaussian distributions within populations. Bimodality implies that there is true population heterogeneity underlying the response, in this case at peak response, the bimodal pS6 response was 52% implying significant heterogeneity (of at least 2) in this population.
FL stimulated CD34+CD117+, CD34−CD117+, and monocyte cells. Similar to SCF, FL stimulation showed homogeneous activation of pErk and pS6, but no activation of pStat3 or pStat5 in CD34+CD117+ cells. In contrast to SCF, pAkt peak response demonstrated bimodality with discrete responding fraction of 42% suggesting population heterogeneity. Compared with SCF stimulation, the fraction of responsive CD34−CD117+ cells was significantly lower but signals showed the same relationship (lower pErk and pAkt but increased pS6 relative to CD34+CD117+ cells). No activation was seen in other granulocytic populations but FL up-regulated pErk and pS6 in minimally 68% of monocytes (fold induction of 5 and 22, respectively). The pAkt response was weak and variable and like SCF, FL did not activate pStat3 or pStat5 in any cell population.
GM-CSF significantly activated signaling in all populations with 59%-99% of the cells responding depending on population. CD34+CD117+ cells responded to GM-CSF by activating pErk, pS6, and pStat5 but not pAkt or pStat3 with minimally 75% of the cells responding. pStat5 response within these cells was homogeneous while all other responses exhibited bimodality. In contrast, lower percent of CD34−CD117+ cells responded with marginal pErk stimulation, weak if any pAkt response, and pStat5 induction of ∼ 8-fold which although significant is ∼ 3-fold lower than the CD34+CD117+ signal. pErk up-regulation was seen in granulocytes and in monocytes, and in contrast to CD34+CD117+ or CD34−CD117+ cells, pStat3 was up-regulated in immature (CD11bvariable/CD13dim/CD15+/CD16−/CD64intermediate) to mature (CD11b+/CD13+/CD15+/CD16+/CD64dim) granulocytes with high responding fractions, but not in monocytes. Although pAkt showed little up-regulation in monocytes, pS6 was activated. pStat5 was robustly activated in all populations with a noticeable increase in pStat5 magnitude of response within maturing granulocytes rising from 6.4 to 7.7.
IL-3 did not signal through pAkt or pStat3 in any population, but like GM-CSF, universally activated pStat5. At least 75% of CD34+CD117+ cells responded. In this population, activation of pErk (12.2-fold) was similar to SCF, FL, and GM-CSF. The pAkt signal was weak and pS6 was equivalent to FL or GM-CSF. All signals and responding fractions were lower in CD34−CD117+ cells. Although showing similar signaling patterns, the fraction responding monocytes was higher than in CD34+CD117+ cells but magnitude of pErk, pS6, and pStat5 was lower at 2.5, 17.3, and 6.6, respectively. The granulocytic populations showed some pErk up-regulation but no activation of pS6. As with GM-CSF, pStat5 showed increasing response magnitude with granulocytic maturation. The IL-3 response magnitude was lower in comparison to GM-CSF stimulation in immature (5.3 vs 6.4) and mature (5.6 vs 7.7) granulocytes.
Like GM-CSF and IL-3, G-CSF activated signaling in all populations with 50%-92% of cells responding depending on population, with significant pStat3 up-regulation. G-CSF showed activation of pErk, pS6, pAkt, pStat3, and pStat5 at varying levels across all cell populations studied. Responses in CD34+CD117+ population for pErk and pAkt were bimodal with 47.1% and 19.1% responding cells, respectively. The pErk response in CD34+CD117+ cells was more robust (5.2-fold) than in other G-CSF responding populations (1.1- to 3.0-fold). Monocytes showed limited to no response. However, maturing granulocytic populations showed homogeneous pErk activation. Robust, homogeneous pStat3 response in these populations was seen (4- to 5-fold), higher than with any other cytokine/GFs studied. In contrast, pStat5 was lower in granulocytic subsets studied compared with either GM-CSF or IL-3. G-CSF–stimulated pStat5 magnitude in CD34+CD117+ cells (24-fold stimulation) was higher than other populations and, as with other stimuli, showed decreasing response with granulocytic maturation. No pS6 or pAkt was seen within the maturing granulocytes. However, CD34+CD117+ cells and monocytes showed low levels of pS6 activation.
In summary, these data confirm several expected cytokine/GF responses in BM cell subsets while highlighting newly identified maturation associated signal-response differences. Further, heterogeneity in cytokine/GF responses were clearly identified in otherwise relatively homogeneous immunophenotypically defined populations; for example, the bimodal pErk responses seen in the CD34+CD117+ cells in response to G-CSF. This clear heterogeneity demonstrates that signaling responses will likely not correlate with immunophenotype in many instances and strongly points to the potential additional information that signal-transduction responses to cytokine/GFs may add to the diagnostic follow-up of AML.
Cytokine/growth factor receptor levels
Some populations showed clear bimodal responses indicative of population heterogeneity underlying the response to a stimulus. Therefore, we asked whether this reflected cytokine/GF receptor expression in these subsets. Human BM was processed in a standard immunophenotyping manner to measure the level of G-CSFR, GM-CSFR, Flt3R (CD114, CD116 and CD135, respectively). Figure 2 shows representative overlays of the G-CSFR, GM-CSFR, and Flt3R staining in each of the 6 nonlymphoid populations. As described in “Cytokine/growth factor responses (normal BM),” G-CSF and FL showed clear bimodal signaling in CD34+CD117+ cells. This is paralleled by bimodal G-CSFR and Flt3R expression in this population (Figure 2). A bimodal response to G-CSF was also seen in the CD34−CD117+ subset and bimodal G-CSFR expression was also observed (Figure 2). If bimodal receptor distributions underlie bimodal responses, then a rough correlation between signaling fractions and receptor-positive fractions should exist. This comparison between signaling and receptor was done with pErk in response to G-CSF and G-CSFR levels. Figure 3 shows the percentage of CD34+CD117+ cells that are G-CSFR+ versus the percentage CD34+CD117+ showing pErk response to G-CSF stimulation, demonstrating correlation. Also of note, homogeneous G-CSFR and GM-CSFR staining was seen in the monocytic and granulocytic populations correlating with homogenous responses to these cytokine/GFs.

Growth factor expression profiles. Single parameter histograms of G-CSFR-PE, GM-CSFR-PE, and Flt3R-PE levels in addition to the negative control are shown for the 6 nonlymphoid populations. Acquired on Gallios flow cytometer and analyzed with FCS Express Version 3.
Growth factor expression profiles. Single parameter histograms of G-CSFR-PE, GM-CSFR-PE, and Flt3R-PE levels in addition to the negative control are shown for the 6 nonlymphoid populations. Acquired on Gallios flow cytometer and analyzed with FCS Express Version 3.

Comparison of signaling to growth factor receptor levels. XY-Scatter plot depicting the correlation between percent G-CSFR+ cells and percent cells responding to G-CSF stimulation through up-regulation of pErk within the CD34+CD117+ (green) and lymphocyte (blue) populations from normal orthopedic surgery BM samples.
Comparison of signaling to growth factor receptor levels. XY-Scatter plot depicting the correlation between percent G-CSFR+ cells and percent cells responding to G-CSF stimulation through up-regulation of pErk within the CD34+CD117+ (green) and lymphocyte (blue) populations from normal orthopedic surgery BM samples.
Cytokine/growth factors response in representative AMLs
To get an idea of the magnitude and extent of signaling dysregulations in AML, 12 AML samples were analyzed in the same manner as the normal BM samples. AML patients included newly diagnosed AML, AMLs arising from an MDS background, therapy-related AMLs, and previously diagnosed AML after therapy. Median age of patients at diagnosis was 50 years (29-75 years). Median WBCs and BM morphologic blast count was 6.35 × 10³/μL (0.9-106 × 103/μL) and 45% (0%-90%), respectively. The abnormal cell immunophenotype and gene mutation status are summarized in Table 2.
AML cohort characteristics
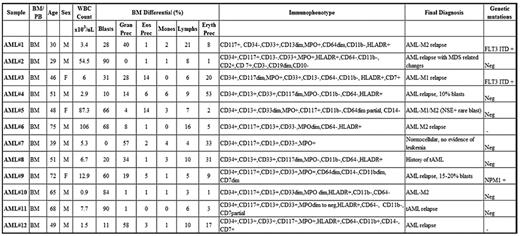
MPO indicates myeloperoxidase; MPN, myeloproliferative neoplasm; MDS, myelodysplastic syndrome; FLT3ITD, FLT3 internal tandem duplication; NPM1, nucleophosmin 1; BM, bone marrow; PB, peripheral blood; M, male; F, female; Prec, precursor; Gran, granulocyte; Eos, eosinophil; Eryth, erythrocyte; Monos, monocytes; Lymphs, lymphocytes; and Neg, negative.
In 10 of 12 AML samples, downstream signaling response abnormalities to cytokines/GFs were easily identified (Table 3). For example, Figure 4 shows an absence of pErk response following SCF stimulation but presence of signaling through pAkt. In normal BM blasts, SCF up-regulates pErk and pAkt in an ordered, biologically uniform manner. However in AML no. 5, pErk response was absent despite typical pAkt up-regulation. The pAkt+ response serves as an internal control documenting presence of a functional receptor. Two additional examples of abnormal signaling are shown in Figure 5. An example of abnormal basal, or a constitutive level of pStat5 is shown in Figure 5A. AML no. 1 showed constitutive pStat5 (magnitude = 6.2) in CD34−CD117+ blasts, in distinct contrast to normal CD34−CD117+ cells that do not display any significant basal pStat5. Increased pS6 and pAkt basal levels (data not shown) were also observed in some samples. Figure 5B illustrates abnormal activation of a target (pAkt) in response to GM-CSF. Typically, GM-CSF does not up-regulate pAkt in normal CD34+CD117+ cells, but AML no. 9 showed measurable GM-CSF induced pAkt in matched phenotypic cells. Another important abnormality, altered kinetics of protein phosphorylation, is illustrated in Figure 5C, which compares pAkt activation kinetics in normal and AML no. 7 CD34+CD117+ blasts in response to SCF. Significantly delayed activation, and prolonged expression, of pAkt was measured in the abnormal blasts.
Summary of representative dysregulated response abnormalities in AML cohort compared to closest normal immunophenotypic counterpart
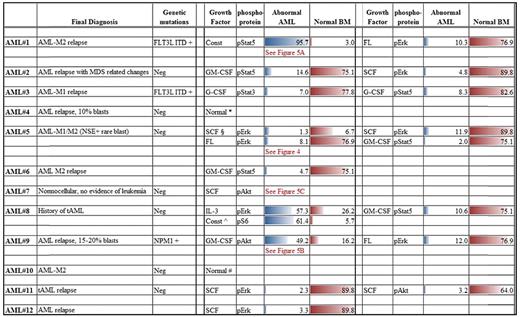
Unless otherwise indicated, all numerical entries are percent responding values.
Const indicates constitutive.
∧pS6 constitutive levels compared within AML cohort.
§Magnitude difference, comparison of signal/noise ratios.
*Insuffiecient cell number, only 1 growth factor tested.
#Insuffiecient cell number, 3 growth factors, and pErk, pS6, pAkt tested.

Signal dysregulation in AML. Shown is an example of signaling dysregulation highlighting loss of response to SCF stimulation in the abnormal CD34+CD117+ cell population. The top 5 bivariate density plots show the representative kinetics of up-regulation of pAkt-A647 and pErk-A488 in the CD34+CD117+ cells from a normal BM in response to SCF stimulation. The bottom panel shows SCF stimulation of AML#5 demonstrating typical pAkt-A647 response but lack of pErk-A488 response. Acquired on Gallios flow cytometer and analyzed with FCS Express Version 3.
Signal dysregulation in AML. Shown is an example of signaling dysregulation highlighting loss of response to SCF stimulation in the abnormal CD34+CD117+ cell population. The top 5 bivariate density plots show the representative kinetics of up-regulation of pAkt-A647 and pErk-A488 in the CD34+CD117+ cells from a normal BM in response to SCF stimulation. The bottom panel shows SCF stimulation of AML#5 demonstrating typical pAkt-A647 response but lack of pErk-A488 response. Acquired on Gallios flow cytometer and analyzed with FCS Express Version 3.

Three representative common abnormalities seen in AML compared with normal BM. (A) Constitutive activation difference: single parameter histogram overlays of pStat5-PE intensity for untreated normal BM lymphocytes (black) and CD34+CD117+ cells (red) compared with a similar overlay for untreated AML#1. (B) Dysregulation showing increased activation. pAkt-A647 overlay of unstimulated (black) and GM-CSF–stimulated (red) CD34+CD117+ cells comparing results for a representative normal BM and AML#9. (C) XY-Scatter plot of pAkt percentage responding CD34+CD117+ cells versus time poststimulation showing kinetic differences between the representative normal and abnormal AML#7 CD34+CD117+ cells. Acquired on Gallios flow cytometer and analyzed with FCS Express Version 3.
Three representative common abnormalities seen in AML compared with normal BM. (A) Constitutive activation difference: single parameter histogram overlays of pStat5-PE intensity for untreated normal BM lymphocytes (black) and CD34+CD117+ cells (red) compared with a similar overlay for untreated AML#1. (B) Dysregulation showing increased activation. pAkt-A647 overlay of unstimulated (black) and GM-CSF–stimulated (red) CD34+CD117+ cells comparing results for a representative normal BM and AML#9. (C) XY-Scatter plot of pAkt percentage responding CD34+CD117+ cells versus time poststimulation showing kinetic differences between the representative normal and abnormal AML#7 CD34+CD117+ cells. Acquired on Gallios flow cytometer and analyzed with FCS Express Version 3.
In aggregate, differences in responses between normal and abnormal were seen across all cytokine/GF pathways and phosphoproteins studied with alterations varying from patient to patient and population to population. Furthermore, although many responses were normal, when sufficient sample allowed assessing adequate numbers of cytokine/GFs and phosphoproteins, multiple abnormalities were identified per patient. Representative clear, overt alterations seen in 10 of 12 AMLs studied are summarized in Table 3 with differences spanning a wide spectrum including altered kinetics of activation, increased constitutive levels of phosphoproteins, and abnormal responses to cytokine/GFs with either reduced or enhanced activation.
Discussion
In this work, signal-transduction responses to 5 cytokine/GFs (SCF, FL, GM-CSF, IL-3, and G-CSF) that play important roles in myeloid/myelomonocytic differentiation were studied. After cytokine/GF stimulation, 5 phosphoproteins (pErk, pAkt, pS6, pStat3, and pStat5) spanning 3 major regulatory pathways (MAPK, PI3K/AKT, and JAK/STAT) were measured in normal BM and AML cohorts. In the normal cohort, results are reported for lymphocytes and 6 immunophenotypically defined populations spanning CD34+CD117+ cells to mature granulocytes and monocytes. Such extensive cell-based studies examining signal-transduction responses in a wide range of normal BM subsets has not previously been done. These data provide key demonstrations of specific pathway responses to individual cytokine/GFs in normal intact human BM cells. In addition, differential pathway responses relating to lineage and/or maturation were noticeable. Furthermore, these studies show response magnitude variations correlating with granulocyte maturation and population heterogeneity which would otherwise be difficult to appreciate in non–cell-based studies.
The preferential use of specific signal-transduction pathways by individual cytokine/GFs is well accepted20 ; however, in large part, these studies have been primarily based on cell line and in vitro culture systems9,23-25 with contrasting results depending on model system and experimental conditions used.26 Thus, importantly, the current study confirms cytokine/GF response pathways within the heterogeneous cellular environment of normal BM and the intact regulatory network of the cell. The SCF-induced and FL-induced (both class III RTK mediated) signaling profiles show similar up-regulation of pErk, pS6, and pAkt with no, or little pStat3 or pStat5 activation seen in CD117+ (CD34+ or CD34−) cell populations thus showing anticipated18 preferential PI3K/AKT and MAPK pathway use. This contrasts with earlier reports of JAK2 activation leading to pStat3 up-regulation with SCF treatment.27-29 It should be noted that these early studies evaluated cell line model systems often times cultured in presence of GM-CSF and IL-3.28 This difference highlights the potential impact of experimental conditions and the importance of comparisons of normal and abnormal signaling profiles under similar defined conditions. Whereas SCF led primarily to PI3K/AKT and/or MAPK up-regulation, GM-CSF, which is known to signal primarily through a JAK/STAT pathway,9,20,25 up-regulated pStat5 in CD34+CD117+ cells. Importantly, similar pathway-specific responses in the CD34+CD117+ cells were seen in an independent cohort of primarily young, normal volunteer BM donors in response to SCF, FL, GM-CSF, and IL-3.30
Few studies have focused on the potentially important magnitude of the signaling response with exception of limited recent studies demonstrating magnitude differences in disease versus normal.10,31 Two technical aspects of the current studies facilitate assessment of response magnitude. First, FCM-based detection of phosphoprotein expression coupled with immunophenotyping of lineage- and differentiation-associated antigens yields both the cell-subset distribution and relative response magnitude as inherent components of the data. Second, many FCM studies have been limited by low phosphoprotein signal intensity with maximum 2- to 3-fold being common.22,32 This compares to up to 63-fold for some phosphoproteins in the optimized protocols used in the current study, significantly enhancing the robustness and reproducibility of magnitude measurements. These points are worth noting as phosphoprotein expression as a therapeutic monitoring tool has significant promise.5,8,33,34 Evaluating phosphoprotein levels downstream of a kinase inhibitor target either in a surrogate population8,35 or specifically in abnormal, malignant cells5,33 may provide useful data in determining appropriate drug dosage and gauging therapeutic response. In addition, in preliminary clinical trials with imatinib treatment of a small AML cohort, a one to one correspondence of therapeutic response was seen with the FCM readout of pAkt levels.36 Lastly, the potential impact of these assays on intelligent, patient-specific, therapeutic selection may be key.33,37
Many of the normal preferential pathway responses noted above are well known, but the magnitude and kinetic responses, along with subtle changes during maturation seen in the present study adds detail not previously reported. For example, GM-CSF stimulation has universally been reported as activating pErk.20 However, in the present study, maturation-associated differences in response to GM-CSF are noted. Robust pErk response was seen as granulocytes matured with weak, or little, response in the CD34+CD117+ and CD34−CD117+ cells. Several additional maturation-related changes not previously reported were also noted. With GM-CSF stimulation, both pStat5 and pStat3 are activated in the more mature granulocytic populations, but in the CD34+CD117+ or CD34−CD117+ immature cells, primary signaling was only through activation of pStat5 and not pStat3. This is interesting in light of previous reports of differential regulation of proliferation and differentiation by GM-CSFR in which the membrane proximal domain of GM-CSFR through binding of JAK kinases and induction of pStat5 was shown to be required, and sufficient, for proliferation38 contrasting with the membrane distal domain induction of differentiation through MAPK and PI3K pathways among other roles.20,39 These data along with others noted in “Cytokine/growth factor responses (normal BM)” clearly show the complexity of signal-transduction responses during myeloid maturation which would be difficult to appreciate in studies not using multiparameter, cell-based analyses. These approaches provide an exciting new strategy for enhanced characterization of key cytokine/GF signal-transduction responses during maturation. Furthermore, currently a majority of maturation studies have used colony-forming assays under highly specific selective pressures. The ability to overlay intracellular signaling networks with already well-known maturation-related surface marker expression in experiments without exogenous added selective pressure and in the context of a more complete representation of cellular subset environment of the marrow may lead to a clearer understanding of myeloid maturation. Extensive further study is obviously needed to understand the significance of these subtle changes during maturation and current studies are under way to complete more detailed “maps” of signaling responses coupled with immunophenotype.
The normal BM data presented in this study provides a critical baseline necessary for maximizing detection of dysregulated signaling in AML. Demonstration of this potential use is shown in comparison of responses seen in a cohort of 12 AML patient samples. In all but 2 of the AMLs, overt, robust differences in cytokine/GF-signaling responses were identifiable. Of note, the 2 AMLs that did not show differences had limited sample and low WBCs which precluded analysis of the full set of cytokine/GF stimulations and phosphoproteins. The number of signaling abnormalities/dysregulations seen in these AMLs ranged from 1 to more than 5 per case and fell into 1 of 4 broad categories.
For some target/stimuli combinations, a lack of response, or activation, was observed. In some, this was complete with no response in any of the phosphoproteins assessed (Table 3). In this case, dysregulation is occurring upstream of the measured targets. This could be the result of an abnormal receptor or possibly receptor-associated proteins necessary for function.40,41 It could also be because of common proteins in the cascade between receptor and measured targets or inhibition of receptor signaling by other proteins/pathways.41,42 In other cases, a partial lack of response was seen in which receptor binding lead to normal up-regulation of some phosphoproteins but not others (Figure 4). Unlike the first scenario this most likely implies dysregulation downstream of the receptor, although this could be more complex and involve varying affinity of potentially altered receptor-associated proteins or multiple receptor domains phosphorylating/regulating different pathways.41,43,44
Increased activation of phosphoprotein targets was also seen. In some, this manifested as increased constitutive, or basal, levels of phosphoprotein without stimulation. This is most notably seen in AML no. 1 where pStat5 was up-regulated in this case of FLT3-ITD–mutated AML (Figure 5A) as was pErk, both reported previously as a frequent occurrence in FLT3-ITD cases.11,16,45 In other cases, enhanced phosphorylation of a target protein was seen compared with normal or manifested as activation through additional pathways not seen in normal (Figure 5B).
The last group of abnormalities represented dysregulation, or alteration, of the activation kinetics in response to stimulation (Figure 5C). This is exemplified in AML no. 6 showing dramatically prolonged pAkt levels in the abnormal cells in response to SCF. Interestingly, altered pAkt activation in response to SCF in AML46 was noted soon after identification of the SCF receptor. Proteins involved in regulatory feedback loops or in de-phosphorylation of pAkt such as PHLP or PP2a, respectively,47 could be involved in this dysregulation. Another possibility could be decreased PTEN expression and phosphorylation (reported in ∼ 75% of AML) frequently resulting in inactivation of PTEN.41,48 Also worth emphasizing in this example, use of only the normal peak response time-point of 3.5′ would have missed this easily identifiable abnormality and stresses the need for analysis of multiple time points in these analyses as also seen by Woost et al. 30
Interestingly, several AMLs demonstrated abnormal SCF- or FL-signaling responses in absence of identified corresponding receptor mutations. Two of 12 AMLs exhibited loss of response to FL stimulation (affecting the PI3K/AKT pathway in one and MAPK in the other), both of which were FLT3-ITD and FLT3-TKD mutation negative. Most common possibility could be presence of mutations not picked up by standard mutational analysis. However, other explanations such as aberrant activation of other pathways or mutation/loss of downstream intermediates between receptor and target phosphoprotein might also be responsible.41 In one case, AML no. 5, a dysregulated signaling response was seen both with SCF and FL stimulation. This is interesting in that c-KIT/CD117 and FLT3 mutations are generally mutually exclusive.49 In this case, FLT3 mutation analysis was negative. Thus, in all these cases, functionally c-KIT/CD117 and Flt3 receptors are dysregulated regardless of the mutational status. This has obvious important therapeutic implications.
Summarizing these and others' data,3,7,9-13 it is evident that finding signal-transduction response abnormalities in AML is relatively easy and robust using the techniques described in this study. Furthermore, extrapolating from these data, if sufficient stimulants, phosphoprotein targets, and time points are analyzed, it is likely that all AMLs will exhibit abnormalities compared with defined normal patterns. The caveat to the latter is that in the present cohort, majority of the samples represented M0-M2 AMLs with no M4 or M5 cases included. However, in studies by Woost et al, abnormalities were also easily identified in the M4 AML using virtually identical techniques and it is anticipated that these important subtypes will also show easily identifiable abnormalities.30
Finally, the signaling assays described in this study may prove useful diagnostically in more definitively identifying abnormal cells particularly after therapy in a setting of regenerating BM when it is frequently difficult to identify residual disease. Furthermore, as functional counterparts of underlying genetic abnormalities, signal-transduction abnormalities may provide more stable indicators of abnormal cells than immunophenotyping which frequently changes after therapy and with disease recurrence.50 However, determining which of the signaling differences seen in AMLs relate to biologic behavior remains to be elucidated. In residual disease detection, how, and whether observed abnormalities relate to recurrence and clinical outcome is a challenging task. To address these questions, a 5-year prospective study correlating signal-transduction patterns, WHO subtype, mutations, cytogenetics, immunophenotype, and clinical parameters is under way in a large cohort of AML patients at overt disease and multiple points after therapy. These pending studies should clarify the potential future role/use in diagnostics, prognostics, therapeutics, and disease monitoring of AML and in turn confirm whether signal-transduction responses to key cytokines/GFs are indeed better “patient-specific indicators” of AML biologic behavior.
The publication costs of this article were defrayed in part by page charge payment. Therefore, and solely to indicate this fact, this article is hereby marked “advertisement” in accordance with 18 USC section 1734.
Acknowledgments
We thank Dr Vincent Shankey, Dr David Hedley, Dr Phillip Woost, and Ms Sue Chow, members of the Advanced Cytometry Concepts group (ACCG), for invaluable contributions to the genesis and progression of these studies; Dr Richard Wixson for supplying normal bone marrow specimens from hip replacement surgery patients; Dr Kanjaksha Ghosh, Director, National Institute of Immunohaematology (NIIH-ICMR, India) for positively facilitating Suchitra Swaminathan's Visiting Predoctoral Fellowship at Northwestern University during her tenure as a graduate student under his mentorship at NIIH-ICMR.
This study was supported in part by research funding from Beckman Coulter.
Authorship
Contribution: J.M. was responsible for experimental design, sample preparation, data collection, data analysis/interpretation, and primary manuscript preparation; S.S. was responsible for experimental design, sample preparation, data collection, data analysis/interpretation, and primary manuscript preparation; G.K. was responsible for sample preparation, data collection, and data analysis; A.C. reviewed bone marrow smears; J.J. was responsible for experimental design, data analysis/interpretation, and manuscript preparation; and C.G. served as project leader, responsible for experimental design, data analysis/interpretation, and manuscript preparation.
Conflict-of-interest disclosure: The authors declare no competing financial interests.
Correspondence: Charles L. Goolsby, Department of Pathology, Feinberg School of Medicine, Northwestern University, Ward 3-140, 303 East Chicago Ave, Chicago, IL 60611; e-mail: c-goolsby@northwestern.edu.
