Abstract
Cytokine genes are targets of multiple epigenetic mechanisms in T lymphocytes. 5-azacytidine (5-azaC) is a nucleoside-based DNA methyltransferase inhibitor that induces demethylation and gene reactivation. In the current study, we analyzed the effect of 5-azaC in T-cell function and observed that 5-azaC inhibits T-cell proliferation and activation, blocking cell cycle in the G0 to G1 phase and decreasing the production of proinflammatory cytokines such as tumor necrosis factor-α and interferon-γ. This effect was not attributable to a proapoptotic effect of the drug but to the down-regulation of genes involved in T-cell cycle progression and activation such as CCNG2, MTCP1, CD58, and ADK and up-regulation of genes that induce cell-growth arrest, such as DCUN1D2, U2AF2, GADD45B, or p53. A longer exposure to the drug leads to demethylation of FOXP3 promoter, overexpression of FOXP3, and expansion of regulatory T cells. Finally, the administration of 5-azaC after transplantation prevented the development of graft-versus-host disease, leading to a significant increase in survival in a fully mismatched bone marrow transplantation mouse model. In conclusion, the current study shows the effect of 5-azaC in T lymphocytes and illustrates its role in the allogeneic transplantation setting as an immunomodulatory drug, describing new pathways that must be explored to prevent graft-versus-host disease.
Introduction
The importance of epigenetic mechanisms in the fields of developmental and cancer biology is well established, and awareness in immunology is growing. Recent studies have been reported in which the authors identified gene methylation processes in immune phenomena such as T-lymphocyte lineage commitment, T-cell effector function, and memory. Cytokine genes in T lymphocytes are targets of multiple epigenetic mechanisms. Interleukin-2 (IL-2) was one of the first cytokine genes for which expression was shown to be enhanced by agents that inhibit DNA methylation.1 In resting naive T cells, the IL-2 promoter DNA is methylated, and the locus is contained in inactive chromatin.2,3 Early after T-cell receptor stimulation and CD28 costimulation,4,5 one or both alleles become activated.4 Similar studies6,7 have been reported regarding interferon-γ (IFN-γ) gene methylation. Interestingly, epigenetic mechanisms such as DNA methylation also can play a role in the regulation of T-cell effector function. Accordingly, rapid demethylation of the IFN-γ promoter occurs only in memory cells which, in turn, can rapidly mount effector functions.8 Unlike IL-2, IL-4 expression occurs at a low frequency until reinforced by autocrine or paracrine signals through the IL-4 receptor and signal transducer and activator of transcription 6.9,10 When this occurs, activated expression of transcription factors such as GATA3 has a profound influence on the epigenetic state of the IL-4 locus.11 These data indicate that DNA methylation may be one mechanism through which T-cell cytokine gene expression is regulated and suggest a role of epigenetic mechanisms during Th1/Th2 differentiation or polarization.12-18
Regulatory T cells play a pivotal role in the maintenance of self-tolerance.19,20 Increasing evidence exists for a critical role of epigenetic modifications in the locus coding for the forkhead transcription factor FOXP3,21 which acts as a master switch controlling regulatory T-cell development and function22 : an evolutionarily conserved region within the noncoding part of the gene contains CpG motifs, which are completely demethylated in naturally occurring regulatory T cells but methylated in naive and effector T cells.
The currently available nucleoside-based DNA methyltransferase (DNMT) inhibitor 5-azacytidine (5-azaC) is an analog of cytosine that is metabolically activated in vivo and readily incorporated into DNA during replication.23-25 As a result of the chemistry of the methyltransferase reaction, the DNMT becomes covalently linked to DNA, creating genome-wide protein–DNA cross-links.24,26 This action results in depletion of soluble DNMT protein levels, leading to replication-dependent global demethylation and gene reactivation.27,28 Therefore, 5-azaC has been approved by Food and Drug Administration for the treatment of myelodysplastic syndrome and other leukemias.29
Despite the importance of epigenetic regulation of the immune response, scant information is available concerning the effect of 5-azaC in this field, and only the effect of the drug on natural killer cells has been reported. In this regard, in vitro treatment of natural killer cells with 5-aza-2-deoxycytidine restores the IL-2 signaling pathway, leading to FOXP3 expression.30 In addition, 5-aza-2-deoxycytidine induces KIR DNA hypomethylation and heterogeneous expression of multiple KIR genes.31 In the current study we analyzed the effect of 5-azaC on T cells and its implications in the transplantation setting.
Methods
Animals
All animal protocols were approved by the University of Salamanca Animal Care and Use Committee. Female BALB/c (H2d) and male C57BL/6 (H2b) mice were purchased from Charles River Laboratory. Animals were kept in specific pathogen–free conditions. Mice were between 8 and 12 weeks of age at the start of the experiments.
Donor mice were killed by cervical dislocation, and bone marrow (BM) and spleen from C57BL/6 mice were harvested by the use of standard techniques. Spleen-cell preparations were prepared by gently crushing the tissues to release the cells. Preparations were filtered to remove debris and washed twice in phosphate-buffered saline for injection.
BALB/c (H2d) mice were used as recipients in the graft-versus-host disease (GVHD) model systems. Recipient mice received total body irradiation (850 cGy divided in 2 fractions) from a Cs source. Irradiation was followed by the infusion of 5 × 10⁶ C57BL/6 allogeneic donor BM cells intravenously with or without splenocytes (5-10 × 106 cells intravenously) as a source of allogeneic T cells. Recipient mice then received RPMI or 5-azaC in RPMI at different doses and time intervals from day 0 to day 6 and from day 15 to 25. Finally, the best results were observed at a dose of 1 mg/kg administered intravenously at 60 and 84 hours after infusion, and experiments were repeated 4 times with 5 mice per group by the use of this specific approach. In addition, 3 groups of 5 mice also received 5-azaC on days 19, 21, and 23 after infusion. Mice were monitored and weighed twice a week. All moribund mice were humanely killed.
The degree of systemic GVHD was assessed by a standard scoring system that incorporates 5 clinical parameters: weight loss, posture (hunching), activity, fur texture, and skin integrity. Each parameter received a score of 0 (minimum) to 2 (maximum). Transplanted mice were ear punched, and individual weights were obtained and recorded on day 0 and twice a week thereafter. At the time of analysis, mice from coded cages were evaluated and graded for each criterion. Acute GVHD also was assessed by detailed histopathologic analysis of skin, liver, and intestine.
Chimerims assays were performed in peripheral blood, spleen, and BM at 14 days after transplantation. For this purpose, 5 × 10⁵ cells were stained by direct immunofluorescence by the use of monoclonal antibodies (MoAbs) conjugated with the following fluorochromes: fluorescein isothiocyanate (FITC), phycoerithrin (PE), peridin clorophil protein-Cyanin 5.5 (PerCP-Cy5.5), and Alexa Fluor. Specific antibodies were purchased from BD Biosciences. The following combination was used: anti–H2Db-FITC/anti–H2Dd-PE/anti–CD45-PerCP-Cy5.5/anti–CD34-AlexaFluor or anti–H2Db-FITC/anti–H2Dd-PE/anti–CD45-PerCP-Cy5.5/anti–CD3-Alexa Fluor. Data acquisition was performed immediately after completion of sample preparation by the use of a FACSCalibur flow cytometer (BD Biosciences) equipped with CellQuest software (BD Biosciences).
Cell cultures
Peripheral-blood mononuclear cells from volunteer donors' buffy coats were isolated by density gradient centrifugation by the use of Ficoll-Paque solution and allowed to adhere to the tissue culture dish (BD Biosciences). After 2 hours at 37°C, nonadherent cells were collected, washed, and resuspended in culture medium that consisted of RPMI 1640 l-glutamine (2mM), penicillin (100 UI/mL), and streptomycin (10 mg/mL) plus 10% human AB serum (Sigma-Aldrich). More than 90% of monocytes/macrophages were eliminated as monitored by flow cytometry (data not shown), and T cells were further purified by the use of anti-CD3 magnetic beads (Miltenyi Biotec) if required. Approval was obtained from the institutional review board for these studies, and informed consent for volunteer donors was provided in accordance with the Declaration of Helsinki.
Immunophenotypic analysis
A total of 5 × 10⁵ nonadherent lymphocytes/well were seeded in 48-well plates and were cultured in medium alone or stimulated with plate-bound anti-CD3 (5 μg/mL) plus soluble anti-CD28 (2.5 μg/mL). Different concentrations of 5-azaC (1nM, 10nM, 100nM, and 1μM) were added at day 0 and then every 24 hours during the 4 days of culture. Activation assays were performed on the second day of culture and viability and proliferation assays on the fourth day of culture. Cells were stained by use of the following 4-color combination of MoAbs: anti–CD25-FITC/anti–cytoplasmic IFNγ-PE/anti–CD4-PerCP-Cy5.5/anti–CD40L-allophycocyanin, all purchased from BD Biosciences except anti–CD25-PE, which was provided by Immunotech. For intracellular cytokine staining, brefeldin A (10 μg/mL) was added during the last 4 hours before acquisition. Simultaneous staining for intracytoplasmatic IFN-γ and CD40L and surface antigens was performed by use of the IntraStain Fixation and Permeabilization kit (Dako Cytomation). Isopytic controls were used to analyze intracytoplasmic staining of IFN-γ and CD40L. Data acquisition was performed on a FACSCalibur flow cytometer (BD Biosciences) by use of the CellQuest software program (BD Biosciences) and analyzed with software Paint-A-Gate Pro (BD Biosciences) except for the analysis of intracellular IFN-γ, in which the CellQuest software was used.
To analyze the development of regulatory T cells after 4 days of in vitro culture, the following combination of MoAbs was used: CD25-FITC/CD127-PE/CD4-PerCP-Cy5.5/FOXP3-APC antibodies (all from BD Biosciences, except FOXP3, which was from eBiosciences). In brief, for surface staining, 100 μL of sample per tube was incubated with the corresponding MoAbs for 15 minutes at room temperature in the dark. Cells were washed in phosphate-buffered saline and then fixed and permeabilized with FoxP3 Staining Buffer Set (eBioscience) for FOXP3 staining. In addition, in vitro expansion of T regulatory cells (Tregs) also was evaluated after 14 days of culture with plate-bound anti-CD3 (10 μg/mL) and soluble anti-CD28 (1 μg/mL) mAbs (BD Biosciences) plus IL-2 (R&D Systems) at 50 U/mL in the absence or presence of 5-azaC at 100nM with the same combination of MoAbs. Treg assessment also was performed in mice 3 to 4 weeks after transplantation by use of the Mouse Regulatory T-cell staining Kit (with APC FoxP3; eBioscience).
Cytokine assays
To measure the release of cytokines (IL-2, IL-4, IL-6, IL-10, tumor necrosis factor-α, and IFN-γ), by stimulated T cells, we used the BD Human Th1/Th2 Cytokine CBA kit (BD Biosciences). The assays were performed according to the manufacturer's instruction on supernatant collected 4 days after stimulation with anti-CD3 (5 μg/mL) and anti-CD28 (2.5 μg/mL). For the Th1/Th2 cytokine CBA kit, 50 μL of supernatant was stained with the mixture of human cytokine capture bead suspension and the PE detection reagent. After 3 hours of incubation, samples were washed and then analyzed in a FACSCalibur (BD Biosciences) flow cytometer by use of BD CBA software. Human Th1/Th2 cytokine standards provided with the kit were appropriately diluted and used in parallel to samples for preparation of the standard curves.
Proliferation and apoptosis assessment
For the proliferation assays, 5 × 10⁵ nonadherent lymphocytes, stained with PKH-67, were seeded in 48-well plates and cultured in medium alone or stimulated with either phytohemagglutinin A (5 μg/mL) or plate-bound anti-CD3 (5 μg/mL) plus soluble anti-CD28 (2.5 μg/mL) MoAbs. 5-azaC at increasing doses from 1 to 1000nM was added to the culture as previously specified. After 4 days, cells were collected, stained with CD25-PE, 7-amino-actinomycin (7-AAD), and anti–CD3-APC MoAbs and analyzed by flow cytometry. ModFit software was used to calculate the percentage of resting (PKHhighCD25−) and proliferating cells.
Cell-cycle analysis also was performed after 4 days of culture. For this purpose 5 × 10⁵ lymphocytes were stained with FITC-conjugated mAbs CD2, CD3, CD5, and CD7 (all purchased from BD Biosciences) and incubated for 15 minutes. Afterward, 500 μL of solution B containing 0.5 g/L RNAse (Sigma-Aldrich) was added and incubated for 10 minutes in the dark. Finally, 500 μL of solution C containing 0.42 g/L propidium iodide (Sigma-Aldrich) was added to each tube, and cells were incubated in the dark for 15 minutes. After this period, measurements of the cell's DNA contents were performed in a FACSCalibur flow cytometer (BD Biosciences). A minimum of 20 000 events were acquired. The distribution of cells along the cell-cycle phases was analyzed by use of the model included in the ModFit LT (Verity Software House) software program, after excluding cell debris and cell doublets.
For the detection of apoptosis, cell cultures were performed as previously described and the annexin V–PE/7-AAD apoptosis detection kit from BD PharMingen was used. In brief, a minimum of 5 × 10⁵ T lymphocytes were washed and resuspended in Binding Buffer (1:10 diluted in H2O) while a cell concentration of 106/mL was maintained. Annexin V–PE and 7-AAD, 5 μL each, were added and incubated for 15 minutes. To identify activated T lymphocytes, anti–CD25-FITC and anti–CD3-APC also were added. For every condition, 50 000 events were collected and analyzed. The percentage of annexin V–PE plus 7-AAD negative lymphocytes was calculated by the software Paint-A-Gate Pro (BD Biosciences).
DNA extraction, analysis of the gene promoter, bisulfite sequencing, and pyrosequencing
Genomic DNA was isolated by use of the DNA/RNA Micro Kit (Qiagen) following the protocol for animal and human cells. Bisulfite treatment of genomic DNA was performed with the Applied Biosystems methylSEQr Bisulfite Conversion Kit (Applied Biosystems). Four regions from FOXP3 promoter (Amp3, Amp5 [Treg-specific demethylated region], Amp 9, and Amp10) were amplified and sequenced according to Baron et al.32 Methylation status in the Treg-specific demethylated region was confirmed by quantitative polymerase chain reaction (PCR) following the protocol described by Wieczorek et al.33 The CpG island DNA methylation status was determined by sequencing bisulfite-modified genomic DNA. For each gene, primers were designed by use of the Methyl Primer Express Version 1.0 program (Applied Biosystems) corresponding to the region containing the oligonucleotide probe represented in the DNA methylation bead array. The following primers were used corresponding to 4 different amplicons of the Foxp3 gene as described in Baron et al,32 including the promoter CpG island (Amp10, forward: GTAAAGGGTAGTTGGAAGGTAAA; reverse: AATTTTACCTAATCCCCACATT), a conserved region after the transcription start site (Amp9, forward: GAGTTAATGGAGGTGGAGGTT; reverse: AAAAAAAATAACCCCATCCCTA) and 2 sections of the coding region (Amp5, forward: GTGGGGTATTTGTTTTTTTTTT; reverse: AAACTAAAAATTCTCCCCAAAC and Amp3, forward: TTTGGAAGGTGAGTTTTTTTG; reverse: CTCTACCTCCCACCAATTTAAC). For quantitative purposes, cloning of each amplicon was performed, and sequencing of at least 15 clones was done.
RNA extraction, retrotranscription, and quantitative PCR
Total RNA was isolated by use of the DNA/RNA Micro Kit (Qiagen) following the protocol for animal and human cells. A total of 1 μg of RNA was retrotranscribed by use of the High Capacity cDNA Reverse Transcription Kits (Applied Biosystems). The quantification of the different genes was performed with the Step One Plus Real-Time PCR System and TaqMan Gene Expression Assays (Applied Biosystems) according to the manufacturer's instructions. The assay IDs are included in supplemental Table 1 (available on the Blood website; see the Supplemental Materials link at the top of the online article). Relative quantification was calculated by use of the equation 2−ΔΔCt, where ΔCt = Ctgen − CtABL1 and ΔΔCt = ΔCt Sample − ΔCt Control at 0 hours of incubation.34 The Mann-Whitney nonparametric U test (SPSS 15.0 software) was used to compare different gene expressions between samples with or without 5-azaC at different time points.
Gene expression profile assays
Total RNA was extracted from cultures of sorted cells by use of TRIzol (Invitrogen) making a total of 12 samples (coming from time-series studies of 3 healthy individuals). The RNA integrity was confirmed with Bioanalyzer 2100 by use of the RNA 6000 Nano kit (Agilent Technologies Inc). Three molecular biology kits (catalog nos. 3300, 2000, and 4200 from NuGEN Technologies Inc) were used to label the samples following the manufacturer protocol. Labeled samples were hybridized to Affymetrix Human Gene 1.0 ST arrays according to the manufacturer protocol (Affymetrix Inc).
A total of 7149 probesets of 33 297 in the Human Gene 1.0 ST array were filtered by the use of a customized method, built-upon SPOTFIRE 9.1 (TIBCO Software Inc) meeting 3 conditions. The selected probe sets have the following: (1) a ratio up to 0.25 between the standard deviation and the normalized signal average of 3 replicates at the end point of the study; (2) a fold change of 1.3 or more at the middle of the study versus initial time; and (3) a fold change of 1.1 or more at the end versus initial time. Differentially expressed genes were identified within these 7149 probes by use of SAM analysis. Data listing all genes that satisfied these criteria were analyzed by use of the Agile Protein Interaction DataAnalyzer (APID).35 Those genes known to be involved in immune response at least 2 times (or 4 times for genes not related to T-cell activation) on treated versus nontreated samples were identified with APID2NET36 on Cytoscape.37 The whole signature of treated versus nontreated cells was calculated and represented through a hierarchical clustering analysis with SPOTFIRE 9.1 (TIBCO Software Inc) by the use of complete linkage as clustering method, Euclidean distance as similarity measure, and input rank as ordering function.
To analyze the DNA methylation prolife in vivo in the mouse model, genomic DNA from mice was isolated and methylated DNA immunoprecipitation was performed as previously described.38 In brief, denatured DNA fragments were immunoprecipitated by the use of a MoAb against 5-methylcytidine (Eurogentec). Subsequently the mixture was incubated with 30 μL of Dynabeads coated with M-280 sheep anti–mouse IgG antibody (Dynal Biotech) and washed 3 times. After recovering the pull-down methylated DNA by proteinase K digestion for 3 hours at 50°C, we purified the methylated DNA by phenol-chloroform extraction followed by ethanol precipitation. The pellet was dissolved in nuclease-free water (Ambion). Afterward genomic profiling was performed by the use of NimbleGen Arrays Hibridization Systems. Initial data preparation was performed with NimbleScan and SignalMAp software.
Statistical analysis
Mean values and SD as well as the range and median were calculated for each variable by the use of the SPSS software program (SPSS 11.0). Comparison between groups was made by analysis of variance (post-hoc Scheffé and Tukey tests were performed to confirm differences between groups). A 2-way measurement of repeated multiple analysis was performed to compare the effect of the different doses of the drug within the different types of culture and to evaluate the effect of the drug in the signs of GVHD at different time points. Kaplan-Meier product-limit estimates were used to evaluate the effect of the drug on survival. P values less than .05 were considered significant.
Results
5-azaC inhibits T-cell activation and proliferation
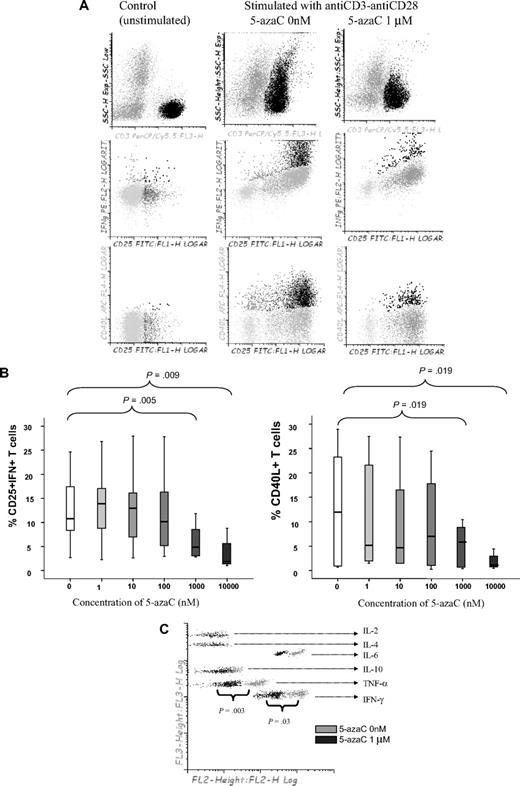
First, we analyzed the effect of 5-azaC on the activation and proliferation of T cells. As shown in Figure 1A-B, the addition of 5-azaC to the cell culture significantly inhibited the activation of stimulated T cells in a dose-dependent manner. Moreover, supernatant cytokine assays confirmed that 5-azaC–treated T cells produced significantly lower amounts of the proinflammatory cytokines tumor necrosis factor-α and IFN-γ compared with stimulated untreated T cells (Figure 1C).
Effect of 5-azaC on the activation pattern of T cells. (A) Dot plot showing the forward scatter (FSC) and side scatter (SSC) of resting versus anti-CD3 plus anti-CD28 stimulated T cells. The addition of 5-azaC significantly inhibited the activation of T cells as shown by a lower FSC/SSC among stimulated 5-azaC–treated T cells as well as a lower number of T cells expressing CD25 and intracellular IFN-γ and CD40L. A representative case of 9 experiments is shown. (B) Box-plot showing the dose-dependent effect of 5-azaC on the different activation parameters analyzed. (C) Supernatants CBA cytokine assays after 4 days of culture. A representative case of 5 cases analyzed is shown.
Effect of 5-azaC on the activation pattern of T cells. (A) Dot plot showing the forward scatter (FSC) and side scatter (SSC) of resting versus anti-CD3 plus anti-CD28 stimulated T cells. The addition of 5-azaC significantly inhibited the activation of T cells as shown by a lower FSC/SSC among stimulated 5-azaC–treated T cells as well as a lower number of T cells expressing CD25 and intracellular IFN-γ and CD40L. A representative case of 9 experiments is shown. (B) Box-plot showing the dose-dependent effect of 5-azaC on the different activation parameters analyzed. (C) Supernatants CBA cytokine assays after 4 days of culture. A representative case of 5 cases analyzed is shown.
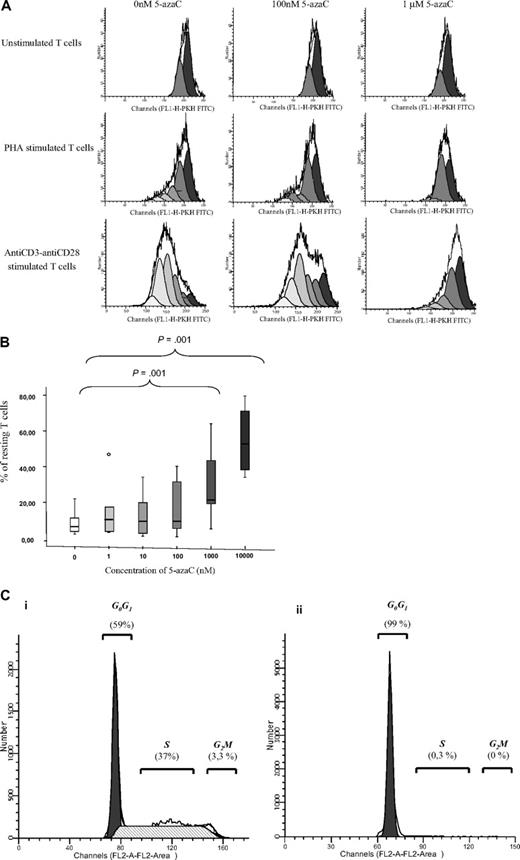
We next evaluated the effect of the drug on T-cell proliferation. For this purpose, PKH staining was performed. As shown in Figure 2A-B, 5-azaC significantly inhibited the proliferation and, again, this effect was a dose-dependent one. For all these assays, a significant inhibition in both T-cell activation and proliferation was observed for doses 1μM or greater of the drug. To further assure the effect of the drug among activated T cells, cell-cycle analysis were performed in the absence or presence of 1μM of the drug by the use of propidium iodide assays, and, again, an inhibition of cell cycle was observed in the presence of the drug (Figure 2C).
T-cell proliferation and cell-cycle analyses. (A) PKH staining showing the number of duplications of T cells under stimulation with either phytohemagglutinin A or anti-CD3 plus anti-CD28. A representative case of 8 cases is shown. (B) Box plot showing the dose response effect of 5-azaC on T-cell proliferation. (C) Cell-cycle analysis in stimulated T cells in the absence (i) or presence (ii) of 5-azaC at 1μM (P = .01). A representative case of 8 cases is shown.
T-cell proliferation and cell-cycle analyses. (A) PKH staining showing the number of duplications of T cells under stimulation with either phytohemagglutinin A or anti-CD3 plus anti-CD28. A representative case of 8 cases is shown. (B) Box plot showing the dose response effect of 5-azaC on T-cell proliferation. (C) Cell-cycle analysis in stimulated T cells in the absence (i) or presence (ii) of 5-azaC at 1μM (P = .01). A representative case of 8 cases is shown.
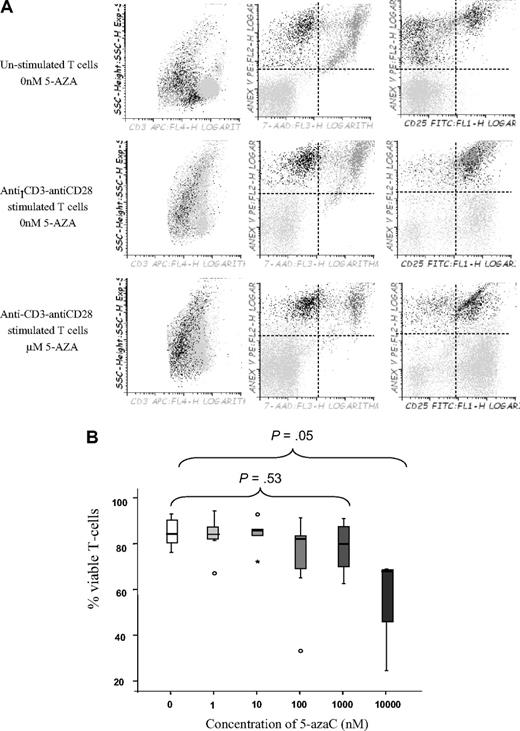
This inhibitory effect of the drug could be attributable to an immunomodulatory effect or to a proapoptotic effect among activated T cells. To address this question we decided to perform viability assays in unstimulated versus stimulated treated or untreated T cells. As shown in Figure 3A and B, the drug affected the viability of activated T cells at a dose of 10μM, whereas no significant effect on viability was observed at lower doses, thus indicating that at lower doses the drug induced an immunomodulatory effect.
T-cell viability assays. (A) Dot plot showing T-cell viability as assessed by Annexin V and 7-AAD staining among unstimulated or stimulated T cells in the absence or the presence of 1μM of the drug. A representative experiment of 8 is shown. (B) Box plot representation showing the effect of 5-azaC on T-cell viability. Significant differences were only observed at a dose of 10μM of the drug.
T-cell viability assays. (A) Dot plot showing T-cell viability as assessed by Annexin V and 7-AAD staining among unstimulated or stimulated T cells in the absence or the presence of 1μM of the drug. A representative experiment of 8 is shown. (B) Box plot representation showing the effect of 5-azaC on T-cell viability. Significant differences were only observed at a dose of 10μM of the drug.
Mechanisms involved on the effect of 5-AZA on T cells
To confirm the hypomethylating effect of 5-azaC on T cells we analyzed the DNMT1 (DNA methyltransferase) RNA levels and confirmed that, among 5-azaC–treated lymphocytes, DNMT1 expression decreased along the culture in the presence of the drug so that, after 4 days of exposure to 5-azaC, DNMT1 mRNA levels were 2.8 times (range, 1.8-3.5) lower compared with untreated T cells (supplemental Figure 1).
To elucidate the mechanisms involved in the effect of 5-azaC on T cells we performed gene expression assays in T cells untreated versus treated with 5-azaC at 1μM after 2 and 4 days of culture. The whole signature of 7149-filtered genes dysregulated in treated versus nontreated cells after 2 and 4 days of culture is represented in supplemental Figure 2A through hierarchical clustering analysis. SAM analysis of these 7149 probes revealed 2189 differentially expressed genes with a fold discovery rate of 0.63%. Among these, genes related to immune response were selected when a fold change greater than 2 times between treated versus untreated cells was observed after 4 days of culture. A fold change greater than 4 times was used to select genes not related to immune response. The array data discussed in this publication have been deposited in the Gene Expression Omnibus (National Center for Biotechnology Information) and are accessible through GEO Series accession number GSE17922 (http://www.ncbi.nlm.nih.gov/geo/query/acc.cgi?acc=GSE17922).
As shown in Tables 1 and 2, DNA damage–inducible genes such as p53 or GADD45B, genes involved in the regulation of cell cycle such as DCUN1D3, and genes related to the regulation of the immune response such as FOXP3 were up-regulated, whereas, on the contrary, genes related to progression of cell cycle such as MAP3K5, MAPK14, or to the synthesis of cytokines such as IFNAR2 were down-regulated, explaining the effect previously described of the drug on T-cell proliferation and activation. In supplemental Figure 2B the partial gene regulatory network comprising those described on Tables 1 and 2 is shown.
Expression profile of genes related to immune response and T-cell proliferation among untreated versus treated T cells
| Probe set ID . | Gene symbol . | Fold change . | Gene description . | |
|---|---|---|---|---|
| Untreated versus treated at 4 days . | Untreated versus treated at 2 days . | |||
| 8172631 | FOXP3 | 3.41 | 1.89 | Forkhead box P3 |
| 8038487 | IL4I1 | 2.52 | 1.66 | Interleukin 4–induced 1 |
| 8012257 | TP53 | 2.19 | 2.15 | Tumor protein p53 |
| 7931899 | IL15RA | 2.15 | 1.71 | Interleukin 15 receptor, alpha |
| 8035380 | IL12RB1 | 2.01 | 1.49 | Interleukin 12 receptor, beta 1 |
| 8129804 | MAP3K5 | −2.02 | −1.50 | Mitogen-activated protein kinase kinase kinase 5 |
| 8119000 | MAPK14 | −2.74 | −2.67 | Mitogen-activated protein kinase 14 |
| 8068238 | IFNAR2 | −2.92 | −3.11 | Interferon (alpha, beta and omega) receptor 2 |
| 7918902 | CD58 | −4.12 | −5.56 | Lymphocyte function-associated antigen 3 |
| 8176219 | MTCP1 | −4.38 | −7.69 | Mature T-cell proliferation 1 |
Expression profile of genes not related to immune response with a fold change greater than 4 among untreated versus treated T cells after 4 days of culture
| Probe set ID . | Gene symbol . | Fold change . | Gene description . | |
|---|---|---|---|---|
| Untreated versus treated at 4 days . | Untreated versus treated at 2 days . | |||
| 8000028 | DCUN1D3 | 6.11 | 2.07 | DCN1, defective in cullin neddylation 1 |
| 8031536 | U2AF2 | 6.04 | 1.74 | U2 small nuclear RNA auxiliary factor 2 |
| 8024485 | GADD45B | 5.95 | 3.30 | Growth arrest and DNA-damage–inducible, beta |
| 8087739 | CISH | 5.77 | 2.48 | Cytokine inducible SH2-containing protein |
| 8033392 | XAB2 | 4.19 | 2.69 | XPA binding protein 2 |
| 8024900 | UHRF1 | 4.08 | 1.70 | Ubiquitin-like with PHD and ring finger domains 1 |
| 7928471 | ADK | −4.03 | −2.92 | Adenosine kinase |
| 8095870 | CCNG2 | −4.72 | −2.56 | Cyclin G2 |
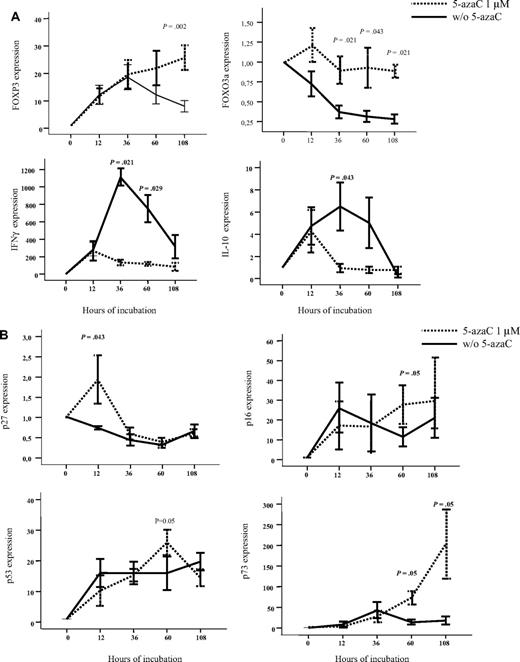
To further confirm the effect of 5-azaC, RNA expression also was analyzed by the use of quantitative PCR. For this purpose, we focused on the analysis of genes related to immune response and T-cell proliferation. As shown in Figure 4A-B, we confirmed that T cells exposed to the drug up-regulated FOXP3 and FOXO3a as well as genes involved in cell-cycle inhibition such as p27, p16, p53, and p73 whereas they down-regulated IFN and IL-10 genes. Moreover, we evaluated by the use of flow cytometry the expression of FOXP3 among resting or stimulated T cells either untreated or treated with 1μM of the drug, and although a trend toward a greater percentage of CD4+CD25+FoxP3+CD127− T cells was observed among stimulated T cells treated with 5-azaC, differences were not statistically significant after 4 days of culture.
Effect of 5-azaC on the expression of genes involved in regulation of immune response and cell cycle. (A) RNA expression of FOXP3, FOXO3a, IFN-γ, and IL-10 as evaluated by quantitative PCR. Exposure to 5-azaC significantly increased the expression of FOXP3 and FOXO3a and decreased the expression of IFN-γ and IL-10 at different time-points during the T-cell culture. (B) RNA expression of p16, p27, p53, and p73; a significant increase in the expression of all these genes was observed at different time points after exposure to the drug (n = 4 cases analyzed).
Effect of 5-azaC on the expression of genes involved in regulation of immune response and cell cycle. (A) RNA expression of FOXP3, FOXO3a, IFN-γ, and IL-10 as evaluated by quantitative PCR. Exposure to 5-azaC significantly increased the expression of FOXP3 and FOXO3a and decreased the expression of IFN-γ and IL-10 at different time-points during the T-cell culture. (B) RNA expression of p16, p27, p53, and p73; a significant increase in the expression of all these genes was observed at different time points after exposure to the drug (n = 4 cases analyzed).
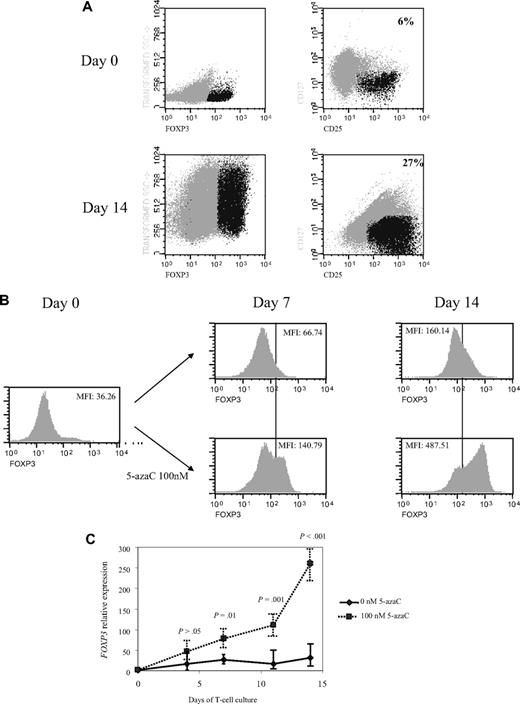
Next, we decided to increase the time of exposure to lower concentrations of the drug so that further assays were performed on days 4, 7, 11, and 14 of T-cell culture in the presence or absence of 100nM of the drug. Interestingly, a significant increase in CD4+CD25+FoxP3+CD127− cells was observed along the 14 days of culture in the presence of 5-azaC compared with control (mean, 6% on day 0 vs 27% CD4+CD25+FoxP3+CD127− cells at day 14 of culture in presence of 100nM 5-azaC; Figure 5A). Thus, as shown in Figure 5B the expression of FoxP3 significantly increased along the culture in the presence of 5-azaC. Furthermore, FOXP3 expression also was assessed by quantitative PCR and again a significant increase was observed along the culture in the presence of 5-azaC at 100nM compared with controls (Figure 5C).
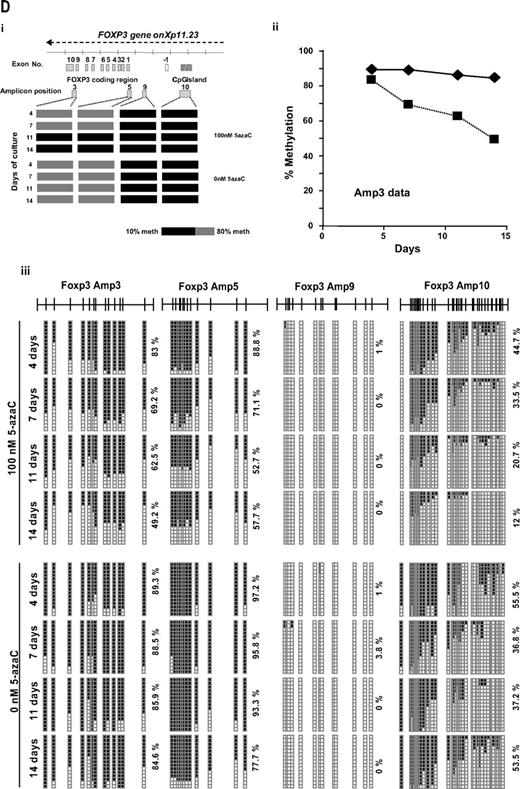
Effect of 5-azaC on the expression of FOXP3 and on the methylation pattern of FOXP3 promoter. (A) Regulatory T cells were identified as CD4+CD25+FoxP3+CD127− cells. A representative dot plot of 6 cases analyzed is shown. (B) Mean fluorescence intensity for FoxP3 at 0 and after 7 and 14 days of culture; a significant increase in the mean fluorescence intensity for FoxP3 was observed along the 14 days of culture in the presence of 5-azaC compared with controls; (C) quantitative PCR showed a significant increase in FOXP3 expression in treated versus untreated T cells from day 7 to 14 of culture. (D) Effect of 5-azaC in the methylation status of the FOXP3 gene. (i) Schematic overview of the FOXP3 gene, including exons and position of its promoter CpG island. It is shown the position of the amplicons designed for methylation analysis. The bottom panel depicts a summary of the methylation levels measured by bisulfite sequencing of different samples indicated below. Each box represents 1 of the 4 amplicons studied with the average methylation rate according to the color code (scale is shown at the bottom: black indicates no methylation; gray, methylation). (ii) Graph corresponding to the change of methylation for one of the amplicons of the Foxp3 gene at different time points (4, 7, 11, and 14 days) and presence or absence of 5-azaC (100 and 0nM). (iii) Individual bisulfite sequencing of the 4 selected regions of the Foxp3 gene according to Baron et al.32 Fifteen clones are shown. Methylated and nonmethylated CpG sites are represented as black and white squares, respectively. Percentage of methylation is shown at the right hand side of each section. Eight samples are represented corresponding to 4 time points (4, 7, 11, and 14 days) in the presence or absence of 5-azaC (100 and 0nM).
Effect of 5-azaC on the expression of FOXP3 and on the methylation pattern of FOXP3 promoter. (A) Regulatory T cells were identified as CD4+CD25+FoxP3+CD127− cells. A representative dot plot of 6 cases analyzed is shown. (B) Mean fluorescence intensity for FoxP3 at 0 and after 7 and 14 days of culture; a significant increase in the mean fluorescence intensity for FoxP3 was observed along the 14 days of culture in the presence of 5-azaC compared with controls; (C) quantitative PCR showed a significant increase in FOXP3 expression in treated versus untreated T cells from day 7 to 14 of culture. (D) Effect of 5-azaC in the methylation status of the FOXP3 gene. (i) Schematic overview of the FOXP3 gene, including exons and position of its promoter CpG island. It is shown the position of the amplicons designed for methylation analysis. The bottom panel depicts a summary of the methylation levels measured by bisulfite sequencing of different samples indicated below. Each box represents 1 of the 4 amplicons studied with the average methylation rate according to the color code (scale is shown at the bottom: black indicates no methylation; gray, methylation). (ii) Graph corresponding to the change of methylation for one of the amplicons of the Foxp3 gene at different time points (4, 7, 11, and 14 days) and presence or absence of 5-azaC (100 and 0nM). (iii) Individual bisulfite sequencing of the 4 selected regions of the Foxp3 gene according to Baron et al.32 Fifteen clones are shown. Methylated and nonmethylated CpG sites are represented as black and white squares, respectively. Percentage of methylation is shown at the right hand side of each section. Eight samples are represented corresponding to 4 time points (4, 7, 11, and 14 days) in the presence or absence of 5-azaC (100 and 0nM).
Finally, the methylation status of the FOXP3 promoter was analyzed. As shown in Figure 5D the effect of 5-azaC on the methylation pattern among the CpG regions analyzed within the promoter32 increased along the culture period, being scant after 4 days of exposure to the drug and highly significant afterward (Figure 5D).
In vivo studies
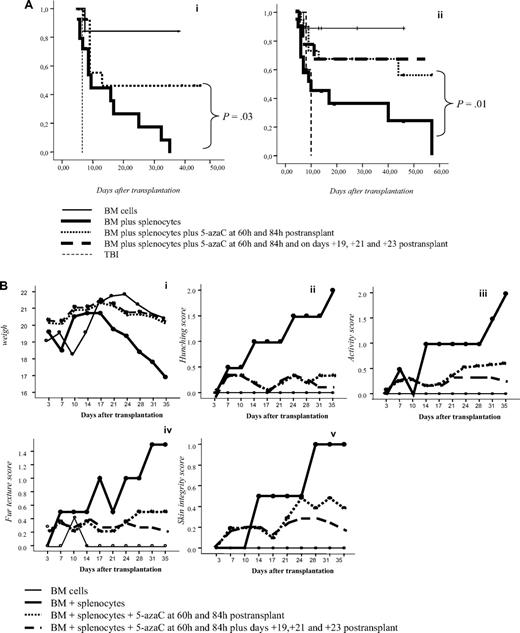
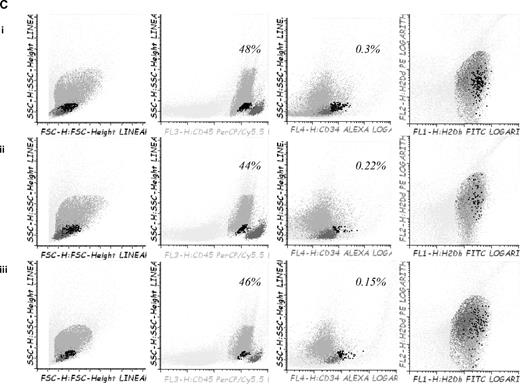
To confirm in vitro findings we developed a GVHD mouse model. For this purpose, 5-azaC was administered at different doses and time points after transplantation. A dose of 1 mg/kg, which correspond to a concentration of 5-azaC in the range of 100 to 500nM, displayed the best results in terms of survival and GVHD prophylaxis. Similarly, different days of administration were tested, and finally, the best results were obtained when the drug was administered at 60 and 84 hours after cells infusion. Two different doses of splenocytes were infused to evaluate the effect of the drug in a more or less severe GVHD model, and, as shown in Figure 6A, in both models the administration of 5-azaC improved the survival of the mice. Also in both models the administration of the drug significantly decreased GVHD-related signs, as shown in Figure 6B. To evaluate the effect of the drug on engraftment, chimerism studies were performed in treated versus untreated mice 14 to 21 days after transplantation, and as shown in Figure 6C, no significant differences were observed regarding donor hematopoietic engraftment, except for a lower percentage of T cells in mice receiving 5-azaC. Similar results were found in peripheral blood and spleen (data not shown). To evaluate the effect of a prolonged exposure to the drug, as previously mentioned by the use of in vitro studies, further doses of 5-azaC were administered to the mice. Although administration later than 84 hours and before 19 days after transplantation had a deleterious effect on outcome (data not shown), the administration of additional doses of 5-azaC on days 19, 21, and 23 did not modify survival but decreased the GVHD scores (Figure 6A-B).
Survival and GVHD incidence among Balb-c mice receiving transplantation with or without 5-azaC. (A) Kaplan-Meier curves representing overall survival of mice after a dose of 10 × 106 splenocytes (i) or 5 × 10⁶ splenocytes (ii). In both models the addition of the drug significantly improved survival. (B) Evolution of weight loss (i), hunching (ii), activity (iii), fur texture (iv), and skin integrity (v), along the period of observation. Statistically significant differences were observed for all parameters analyzed between the groups receiving splenocytes versus splenocytes plus 5-azaC (P < .05). (C) Dot plots demonstrating chimerism studies in transplanted mice; the percentage of CD45+ cells within the BM was similar among mice receiving (i) BM (mean percentage: 48%), (ii) BM plus splenocytes (44%), and (iii) BM plus splenocytes and 5-azaC (46%). In addition, the percentage of CD34+ cells within hematopoietic cells was not significantly different in BM upon comparing mice receiving BM (0.3%), BM plus splenocytes (0.22%), or BM plus splenocytes and 5-azaC (0.13%). Finally, the percentage of T cells (identified on the basis of their high expression of CD45, see supplemental Figure 3) among hematopoietic cells in BM was lower among mice receiving 5-azaC (0.8%) compared with those mice receiving BM plus splenocytes (1.68%) or BM cells (0.97%; P = .05 for the comparison between mice receiving splenocytes with or without 5-azaC); A representative case of 5 cases analyzed is shown.
Survival and GVHD incidence among Balb-c mice receiving transplantation with or without 5-azaC. (A) Kaplan-Meier curves representing overall survival of mice after a dose of 10 × 106 splenocytes (i) or 5 × 10⁶ splenocytes (ii). In both models the addition of the drug significantly improved survival. (B) Evolution of weight loss (i), hunching (ii), activity (iii), fur texture (iv), and skin integrity (v), along the period of observation. Statistically significant differences were observed for all parameters analyzed between the groups receiving splenocytes versus splenocytes plus 5-azaC (P < .05). (C) Dot plots demonstrating chimerism studies in transplanted mice; the percentage of CD45+ cells within the BM was similar among mice receiving (i) BM (mean percentage: 48%), (ii) BM plus splenocytes (44%), and (iii) BM plus splenocytes and 5-azaC (46%). In addition, the percentage of CD34+ cells within hematopoietic cells was not significantly different in BM upon comparing mice receiving BM (0.3%), BM plus splenocytes (0.22%), or BM plus splenocytes and 5-azaC (0.13%). Finally, the percentage of T cells (identified on the basis of their high expression of CD45, see supplemental Figure 3) among hematopoietic cells in BM was lower among mice receiving 5-azaC (0.8%) compared with those mice receiving BM plus splenocytes (1.68%) or BM cells (0.97%; P = .05 for the comparison between mice receiving splenocytes with or without 5-azaC); A representative case of 5 cases analyzed is shown.
By using the methylated DNA immunoprecipitation technique, we compared the methylation profiles of splenocytes from mice treated or not with 5-azaC on day 25 after transplantation. A significantly different profile was observed with 2398 versus 4180 genes methylated in treated versus untreated mice, thus confirming the effect of the drug on the methylation pattern also in vivo.
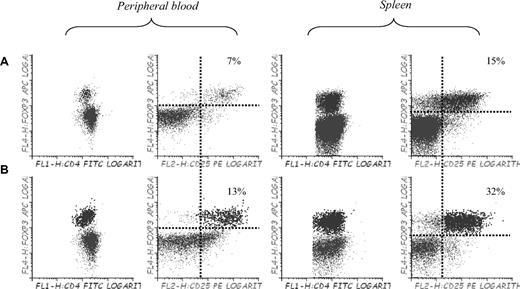
Finally, to confirm whether or not the use of 5-azaC allowed to expand Tregs in vivo, we performed immunophenotypic assays in peripheral blood, spleen, and BM of mice 3 to 4 weeks after transplantation. Compared with control mice, mice treated with 5-azaC 60 and 84 hours after transplantation did not show a significant increase in the percentage of regulatory T cells (data not shown), whereas mice receiving additional doses of 5-azaC on days 19, 21, and 23 experienced a significant increase in the percentage of Tregs in BM (not shown), spleen, and peripheral blood (Figure 7).
Effect of 5-azaC on the number of regulatory T cells in peripheral blood and spleen of mice after transplantation. Regulatory T cells in peripheral blood and spleen of (A) C57BL/6 mice and (B) Balb/c mice transplanted with C57BL/6 BM plus splenocytes and 5-azaC 60 and 84 hours after transplantation and on days 19, 21, and 23 after transplantation. Dot plot shows 1 representative case of 4 analyzed.
Effect of 5-azaC on the number of regulatory T cells in peripheral blood and spleen of mice after transplantation. Regulatory T cells in peripheral blood and spleen of (A) C57BL/6 mice and (B) Balb/c mice transplanted with C57BL/6 BM plus splenocytes and 5-azaC 60 and 84 hours after transplantation and on days 19, 21, and 23 after transplantation. Dot plot shows 1 representative case of 4 analyzed.
Discussion
5-azaC is a DNA-hypomethylating agent with significant activity in myelodysplasic syndromes and acute myeloid leukemias.39-41 It induces leukemic differentiation and increases the expression of several tumor-associated antigens that could favor the graft-versus-leukemia effect,42,43 as recently reported in a series of patients receiving 5-azaC after allogeneic transplantation.44
Epigenetic regulation of the cytokine genes, such as IFN-γ, IL-2, or IL-4, is a key event in the initiation of immune response,6-14 and accordingly, 5-azaC may influence on gene expression in T lymphocytes. Recently, several groups have observed that epigenetic regulation is crucial for controlling the expression of the FOXP3 locus. This locus contains CpG motifs, which are completely demethylated in regulatory T cells but methylated in naive and effector T cells.22,45-49 On the basis of this concept, we evaluated the effect of 5-azaC on T cells. We found that 5-azaC inhibited T-cell activation, proliferation, and secretion of proinflammatory cytokines at 2 to 4 days of culture. These effects are not caused by a proapoptotic effect of the drug because they were observed at concentrations that did not induce a significant increase in T-cell death but to a direct effect on immune response. Among the potential target genes for the drug, we observed an increased expression of FOXP3 by both RNA arrays as well as quantitative PCR. Nevertheless, we did not observe a significant increase in regulatory T cells as assessed by flow cytometry both in vitro and in vivo at 4 days of culture. Moreover, when we analyzed those regions of the promoter of FOXP3 that have been previously identified as being involved in the regulation of the transcription of the gene,32,49 the methylation pattern was not altered by the exposure to the drug during 4 days, suggesting that other mechanisms are involved in this early immunomodulatory effect of 5-azaC, whereas, in contrast, a longer exposure to the drug induced epigenetic modifications driving T-cell differentiation toward a regulatory phenotype.
Other drugs targeting epigenetic mechanisms have recently been used in the transplantation setting, such as the histone deacetylase inhibitor trichostatin-A,50,51 showing that histone deacetylase inhibitor promotes the generation and function of regulatory T cells. As for 5-azaC is concerned, in addition to FOXP3, which is induced after more than 4 days of exposure to the drug, other genes are most likely to explain the effect of 5-azaC on immune response in our model at the short term, such as p16, p27, p53, and p73, which are up-regulated early in T cells after exposure to the drug. More specifically, p53 was identified by both RNA arrays and quantitative PCR. This gene has already been reported to be activated by 5-azaC in response to the DNA damage induced by the drug.52,53
Interestingly, Schmelz et al54 have reported that 5-azaC could induce p21 expression by demethylation of p73, leading to p53-independent apoptosis in myeloid leukemia. Nevertheless, as previously mentioned, the effect of 5-azaC on immune response is observed at concentrations of the drug that do not induce apoptosis and, according to this data, other mechanisms not leading to apoptosis must also be involved. In this regard, as shown in Tables 1 and 2, several genes involved in T-cell proliferation and activation are down-regulated, such as MAP3K5,55 MAPK14,56 IFNAR2,57 CD58,58 MTCP1,59 and CCNG2,60 whereas other genes that may either induce cell-growth arrest, such as DCUN1D2,61 U2AF2, GADD45B,62 CISH,63 and XAB2,64 or inhibit cell activation via nuclear factor-kB inhibition, such as FOXO3a65,66 are up-regulated.
Interestingly, 5-azaC exerts its effect by sequestering the DNMT proteins. In the current study we observed a down-regulation of DNMT1 mRNA, which could be related to the activation of p53 induced by the drug, as previously reported.67
The early blockade of proliferation and activation, intimately linked in T cells, leads to the inhibition of GVHD in our mouse model. Not surprisingly, in this fully mismatched model, the most effective time for the administration of the drug was in the range of 2 to 4 days after transplantation, which is the time where alloreactive T-cell expansion is maximal. By inhibiting this early expansion, the drug avoids the development of GVHD, which is of great interest in the allogeneic transplantation setting, especially considering the preliminary clinical data suggesting an antileukemic effect of the drug under this situation.44 Most importantly, after a more delayed and prolonged exposure to the drug, the risk of GVHD was minimized, and this effect was associated to a Treg expansion that was demonstrated both in vitro and in vivo.
In conclusion, the current study shows the effect of 5-azaC in T lymphocytes, which is caused by both an early effect on the expression of genes related to T-cell proliferation and activation and a delayed effect on the methylation pattern of genes such as FOXP3. According to the present study 5-azaC may play a role in the allogeneic transplantation setting as an immunomodulatory drug.
The online version of this article contains a data supplement.
The publication costs of this article were defrayed in part by page charge payment. Therefore, and solely to indicate this fact, this article is hereby marked “advertisement” in accordance with 18 USC section 1734.
Acknowledgments
We thank Enrique de Sena from the Department of Radiotherapy, and José María Martín from Discovery Information Systems at OncoStem Pharma for their technical support.
This work has been supported by a grant from the Junta de Castilla y León (ref GRS 196/A/08) and from the Fondo de Investigación Sanitaria, Instituto de Salud Carlos III (PI080047).
Authorship
Contribution: L.I.S.-A. performed cell cultures; S.G.-C. performed in vitro functional assays; C.S. performed molecular assays; T.C.-V. and S.C. performed BMT in mouse models; B.B. performed cell-cycle studies; C.H.-S. performed molecular assays; J.L.G. performed genomic DNA methylation assays in mice; P.H.-C. performed BCA assays; F.J.G. performed arrays assays; E.B. performed methylation studies; L.C. performed methylation assays; T.F. performed pathologic examination of mice samples; C.d.C. critically reviewed the manuscript and in vitro studies; J.F.S.-M. critically reviewed the research project; and J.A.P.-S. developed experimental designs and the research project.
Conflict-of-interest disclosure: The authors declare no competing financial interests.
Correspondence: Jose A. Pérez-Simón, MD, PhD, Servicio de Hematología, Hospital Universitario de Salamanca, Paseo de San Vicente s/n, 37007, Salamanca, Spain; e-mail: pesimo@usal.es.

