Abstract
Hematopoietic stem cell gene transfer of the drug-resistance gene cytidine deaminase (CDD) protecting cells from the cytotoxic cytidine analogs cytarabine and gemcitabine was investigated in a murine transplant model. Following transplantation of CDD-transduced cells and cytarabine application (500 mg/kg; days 1-4; intraperitoneally) significant myeloprotection was demonstrated with nadir counts of peripheral blood granulocytes and thrombocytes of 2.9 ± 0.6/nL versus 0.7 ± 0.1/nL (P < .001) and 509 ± 147/nL versus 80 ± 9/nL (P = .008), respectively (CDD versus control). Protection also was observed from otherwise lethal gemcitabine treatment (250 mg/kg; days 1-3). Stable levels of gene-marked cells in primary and secondary recipients were demonstrated for up to 9 months, and whereas CDD overexpression clearly reduced B- and T-lymphocyte numbers, no major toxicity was observed in the myeloid compartment. Despite the profound myeloprotective properties, however, CDD overexpression did not allow for pharmacologic enrichment of transduced hematopoiesis in our model. Thus, in summary, our data establish CDD as a drug-resistance gene highly suitable for myeloprotective purposes, which, given the lack of selection observed in our hands, might best be used in combination with selectable drugresistance genes such as MGMT (P140K) or MDR1.
Introduction
Overexpression of genes conferring resistance to anticancer chemotherapeutic agents in hematopoietic stem/progenitor cells has been advocated as a promising approach to reduce the hematotoxicity of these agents and thus to allow the repetitive application of dose-intensive or high-dose chemotherapy with acceptable side effects. To this end, several drug-resistance genes, such as the multidrug resistance-1 (MDR1) gene, mutant forms of the dihydrofolate reductase (DHFR) gene, and the human O(6)-methylguanine-DNA-methyltransferase (MGMT) gene have successfully been investigated.1,2 More recently, the cytidine deaminase (CDD) gene, which protects cells from cytotoxic deoxycytidine analogs, including cytarabine (1-β-d-arabinofuranosylcytosine) and gemcitabine (2′,2′-difluorodeoxycytidine), has been introduced as a drug-resistance gene with considerable clinical potential. For both drugs, myelosuppression represents a major and often dose-limiting side effect. CDD deaminates cytosine nucleosides and their analogs, thus preventing the accumulation of their toxic intracellular triphosphate derivatives that act as the active metabolites.3,4 After cloning and sequencing of the human CDD cDNA,5 the protective potential of CDD against cytarabine was demonstrated in fibroblasts and hematopoietic cell lines,6-9 and several groups including our own have shown increased cytarabine resistance after retrovirally mediated transduction of primary murine hematopoietic cells.6,10,11 In addition, increased gemcitabine and 5-aza-2′-deoxycytidine resistance after CDD gene transfer into murine cells12,13 and transfer of the CDD gene into primary murine bone marrow stromal cells followed by in vitro enrichment of these cells by cytarabine application have been described.13 More recently, our group has investigated CDD gene transfer into primary human hematopoietic cells demonstrating significant resistance to cytarabine and gemcitabine as well as successful in vitro selection of transduced progenitor cells following retrovirally mediated gene transfer and cytarabine application.14
Studies investigating CDD gene transfer in relevant murine in vivo models, however, are scarce and so far have failed to define the exact myeloprotective potential of this approach. Although one study demonstrated long-term expression of the CDD transgene in the hematopoietic system but did not address in vivo hematoprotection,15 successful treatment of a lymphoma cell line with a combination of methotrexate and cytarabine in NOD/SCID mice given transplants with drug-resistant murine bone marrow was demonstrated in another model.16 In this second study, however, the individual contribution of the 2 drug-resistance genes mutDHFR and CDD to the overall protective effect remains unclear. Therefore, we have now investigated the myeloprotective potential of CDD gene transfer in a well-defined murine bone marrow transplant model.
Materials and methods
Retroviral vectors, producer cell lines, and virus production
Vectors SFβ1-EGFP and SF91-CDD-IRES-EGFP as well as the generation of stable PG13-based producer cell clones packaging these vectors have been described.14 To generate high-titer ecotropic producer cell lines, supernatant from these PG13 producer clones was used for transduction of FNX-eco cells.17 FNX-eco cells (3 × 10⁴) were cultured in 6-well plates in DMEM supplemented with 10% FCS, 2 mM l-glutamine, 100 U/mL penicillin and 100 U/mL streptomycin (P/S), and 20 mM HEPES (all from Sigma-Aldrich, Taufkirchen, Germany), and were incubated with 1 mL supernatant for 4 hours in the presence of 8 μg/mL Polybrene (1,5-dimethyl-1,5-diazaundecamethylene polymethobromide, hexadimethrine bromide; Sigma-Aldrich) for 3 times on 3 consecutive days. Thereafter, cells showing the highest EGFP expression levels (around 30% of EGFP-expressing cells) were sorted by flow cytometry (FACSVantage; Becton Dickinson, Franklin Lakes, NJ) and for these cells stable FNX-eco producer clones were established by limiting dilution. High EGFP-expressing clones were identified by flow cytometry with an EPICS XL instrument (Beckman Coulter, Fullerton, CA) and titrated on NIH3T3 cells. For each vector a high-titer producer clone generating at least 2 × 10⁶ infectious particles/mL was identified and used for further experiments. For generation of high-titer ecotropic virus preparations from these clones, 5 × 10⁶ cells were seeded in a 10-cm Petri dish in IMDM, 20% FCS, 2 mM l-glutamine, and P/S, and supernatant was harvested 48 hours and 72 hours after culture at 37°C and 5% CO2, filtered (PharmAssure 0.45-μm pore size; PALL, Ann Arbor, MI), and stored at –80°C.
Titer analysis of retroviral supernatants
Titration of ecotropic virus on NIH3T3 cells has been described earlier.18 In brief, 3 × 10⁴ cells of the murine fibroblast cell line NIH3T3 were seeded in 6-well plates and cultivated overnight (37°C, 5% CO2). Cells were transduced for 4 hours with 1 mL virus-containing supernatant at different dilutions in the presence of 8 μg/mL Polybrene. On day 4 transduced cells were analyzed for EGFP expression by flow cytometry. The titer is given as infectious particles per milliliter supernatant and was calculated by multiplying the cell number present at the time of transduction in 1 mL retroviral supernatant with the percentage of EGFP+ cells and the dilution factor.
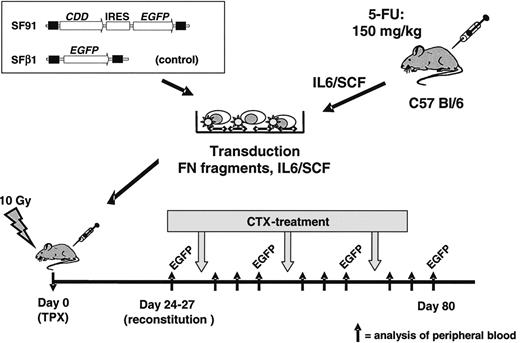
In vivo bone marrow transplant/cytidine deaminase (CDD) gene transfer model. Bone marrow cells were harvested from C57 Bl/6 mice, prestimulated with IL-6/SCF, transduced in the presence of fibronectin (FN) fragments and IL-6/SCF, and transplanted by tail vein injection into lethally irradiated recipients. A spleen focus-forming virus-based vector containing the CDD cDNA in combination with the enhanced green fluorescent protein (EGFP) marker gene was used. A vector expressing EGFP only served as control. After hematopoietic reconstitution, animals were treated with repetitive cycles of cytarabine (500-1000 mg/kg administered intraperitoneally on 4 consecutive days). Peripheral blood counts as well as the percentage of EGFP+ granulocytes and lymphocytes were analyzed 3 days before and 1, 4, and 8 days after treatment cycle. IRES indicates internal ribosomal entry site.
In vivo bone marrow transplant/cytidine deaminase (CDD) gene transfer model. Bone marrow cells were harvested from C57 Bl/6 mice, prestimulated with IL-6/SCF, transduced in the presence of fibronectin (FN) fragments and IL-6/SCF, and transplanted by tail vein injection into lethally irradiated recipients. A spleen focus-forming virus-based vector containing the CDD cDNA in combination with the enhanced green fluorescent protein (EGFP) marker gene was used. A vector expressing EGFP only served as control. After hematopoietic reconstitution, animals were treated with repetitive cycles of cytarabine (500-1000 mg/kg administered intraperitoneally on 4 consecutive days). Peripheral blood counts as well as the percentage of EGFP+ granulocytes and lymphocytes were analyzed 3 days before and 1, 4, and 8 days after treatment cycle. IRES indicates internal ribosomal entry site.
Bone marrow preparation, transduction, and transplantation
Bone marrow was harvested from femur, tibia, and coxa of 8- to 10-week-old female C57 Bl/6 mice (Harlan, Borchen, Germany) 72 hours after treatment with 150 mg/kg 5-fluorouracil (Medac, Wedel, Germany). After red blood cell depletion with PharM Lyse (BD Biosciences PharMingen, San Jose, CA) according to the manufacturer's instructions, cells were prestimulated for 48 hours in IMDM containing 20% FCS, 2 mM l-glutamine, P/S, 20 ng/mL recombinant human (rh) IL-6 (tebu-bio, Offenbach, Germany) and 20 ng/mL recombinant murine (rm) stem cell factor (SCF) (ImmunoTools, Friesoythe, Germany). Transduction of prestimulated bone marrow was carried out in 10-cm nontissue culture Petri dishes coated with 4 μg/cm2 RetroNectin (Takara, Otsu, Japan), as described previously.19 In brief, dishes were preloaded with 4 mL viral supernatant for 30 minutes at 37°C. Thereafter, 3 to 5 × 10⁷ prestimulated bone marrow cells were resuspended in 8 mL retroviral supernatant supplemented with 20 ng/mL rhIL-6 and 20 ng/mL rmSCF. The next day transduction was repeated for another 4 hours with fresh viral supernatant. Twenty-four hours later cells were harvested using trypsin/EDTA (Sigma-Aldrich) and cell-dissociation buffer (Gibco Life Technologies, Grand Island, NY) and 1 to 2 × 10⁶ cells dispersed in a volume of 200 μL IMDM were transplanted by tail vein injection into lethally irradiated (10 Gy, split dose of 7 and 3 Gy, 4 hours between doses; Stabilipan x-ray instrument; Siemens, Erlangen, Germany) female 8- to 10-week-old C57 Bl/6 recipient mice. From some animals secondary transplants were performed, and 1.7 to 3 × 10⁶ bone marrow cells collected from primary recipients at the end of the experiment were injected via the tail vein into lethally irradiated secondary recipients (Figure 1).
Drug treatment and sample collection
To confirm hematologic reconstitution, peripheral blood samples were taken by tail vein bleeding 24 to 27 days after transplantation, and peripheral blood counts were assessed by flow cytometric analysis on a veterinary blood cell counter (VetABC; Scil Animal Care, Viernheim, Germany). After successful hematologic reconstitution, chemotherapy was initiated with intraperitoneal injections of 4 × 500 mg/kg (1st cycle of each experiment [C1-C5] and additionally cycles 2-4 of experiment C1, cycle 2 of experiment C4, and cycles 2 and 3 of experiment C5), 4 × 600 mg/kg (2nd cycle of experiment C2), 4 × 750 mg/kg (3rd cycle of experiment C2), or 4 × 1000 mg/kg (2nd cycle of experiment C3) cytarabine (AraCell, Cell Pharm, Hannover, Germany) given at days 1 to 4. In experiments evaluating gemcitabine, either 2 × 250 mg/kg (cycle 1 of experiment G1) or 3 × 250 mg/kg (cycle 2 of experiment G1; cycle 1 experiment G2) gemcitabine (Gemzar, Lilly, Giessen, Germany) were administered intraperitoneally on consecutive days. Both drugs were dissolved in 0.9% NaCl and for both drugs therapy was repeated on hematologic recovery every 2 to 3 weeks. Peripheral blood counts of granulocytes, lymphocytes, and thrombocytes were determined 3 days before, and 1, 3, and 8 days after treatment cycles. The percentage of EGFP+ granulocytes and lymphocytes in the peripheral blood was analyzed by flow cytometry before and after each treatment cycle. In some experiments, peripheral blood counts as well as EGFP expression were observed in experimental animals as well as nontreated control animals for up to 9 months. In addition, at the end of these experiments EGFP expression was monitored in peripheral blood, bone marrow, and spleen cells. Prior to this analysis spleen and bone marrow samples were filtered through a 70-μm cell strainer (BD Biosciences, Bedford, MA) to remove detritus, and for all samples red blood cell depletion was performed using PharM Lyse. Thereafter, cells were incubated with monoclonal antibodies for 30 minutes at 4°C in PBS/0.2% (wt/vol) bovine serum albumin (BSA; Fluka, Buchs, Switzerland), washed once in PBS/BSA and fixed for 30 minutes in 3.8% formaldehyde/PBS (wt/vol) for flow cytometric analysis. Antibodies used were PE-conjugated lineage-specific antibodies (all BD PharMingen) rat anti–Gr-1 (RB6-8C5) for granulocytes, rat anti-B220 (RA3-6B2) for B cells, and Syrian hamster anti-CD3e (500A2) for T cells. All antibodies were used as recommended by the manufacturer (Figure 1).
CDD enzyme activity
A total of 1 × 10⁷ bone marrow– or spleen-derived mononuclear cells were suspended in 5 mM Tris/HCl pH 7.4 and lysed in 4 freeze-thaw cycles. Cellular debris and nonsolved proteins were pelleted by centrifugation at 12 000g for 15 minutes. Protein concentration in the supernatant was determined by Advanced Protein Assay Reagent (Cytoskeleton, Denver, CO) as described by the manufacturer. For measurement of CDD enzyme activity, lysates containing 0.02 to 0.2 mg protein were incubated in 100 μL 50 mM Tris/acetate, pH 7.4, with 2 mM gemcitabine (Eli Lilly, Indianapolis, IN) for 60 minutes at 37°C. The reaction was terminated by adding 300 μL methanol. The mixtures were centrifuged for 5 minutes (10 000g, 4°C), and aliquots of 20 μL were diluted to 500 μL with NaCl (0.9%, wt/vol) and analyzed by reversed-phase high-performance liquid chromatography (RP-HPLC) with UV detection (Symmetry C18 5 μm, Waters, Milford, MA) for the content of remaining gemcitabine. CDD enzyme activity was calculated as nmol gemcitabine × minute– × mg protein–1.
Clonogenic progenitor assay
Clonogenic progenitor cells (culture colony-forming units [CFU-Cs]) were propagated using a standard methylcellulose assay as previously described10 with minor modifications. Mononuclear cells (5 × 10⁴) from bone marrow were incubated in 1 mL IMDM/0.9% methylcellulose (Fluka) supplemented with 35% FCS, 10 ng/mL rmIL-3 (tebu-bio), 103 U/mL rhG-CSF (Neupogen 30, Amgen, Thousand Oaks, CA), 20 ng rmSCF, and 6 U/mL rhEPO (Boehringer, Mannheim, Germany). To assess drug resistance, cytarabine to 0, 30, 60, 100, 500, or 1000 nM was added to the cultures on day 0. Colonies of more than 50 cells were counted after 7 days as CFU-Cs. Survival of CFU-Cs was calculated relative to the number of colonies in cultures without the drug.
Statistic analysis
Unless otherwise specified, all data are expressed as mean ± SEM. To test for significant differences, the Student t test for unpaired samples was applied for data following Gaussian distribution, and the Mann-Whitney rank sum test was used for not normally distributed values. For both tests P less than .05 was considered significant. For correlation analysis the Pearson correlation coefficient (r) was calculated with values greater than 0.67 indicating a strong correlation.
Results
CDD gene transfer protects myeloid-cell lineages from cytarabine and gemcitabine-induced toxicity
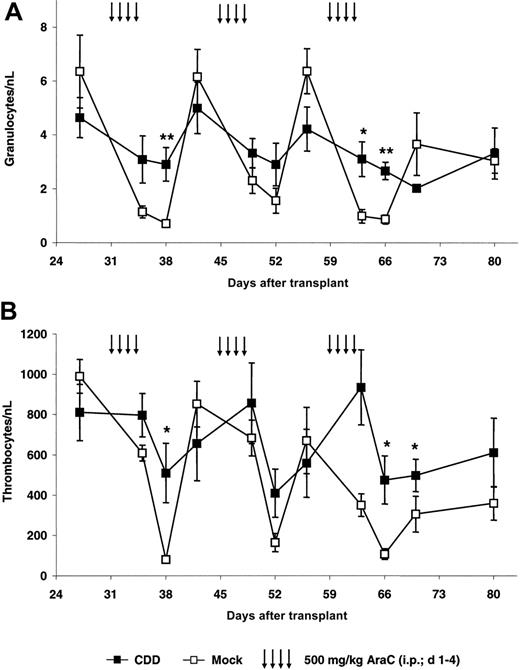
As a first step, protection from cytarabine-induced toxicity was investigated in our bone marrow transplant/gene transfer model. Following hematopoietic reconstitution animals were treated with repetitive cycles of cytarabine (500 mg/kg, intraperitoneally, days 1-4) repeated every 2 weeks on complete hematologic recovery. This dose schedule was based on preliminary experiments with animals given transplants with nontransduced cells in which significant granulopenia as well as thrombocytopenia followed by complete hematopoietic recovery was observed. Data for the first experiment (C1) are depicted in Figure 2. In this experiment an initial gene transfer rate for the myeloid compartment of 42% ± 4% as defined by the percentage of EGFP-expressing peripheral blood granulocytes following hematopoietic reconstitution on day 27 after transplantation was observed. Following chemotherapy, nadir counts for granulocytes (Figure 2A) as well as thrombocytes (Figure 2B) in control and CDD animals usually were observed 4 days after treatment. However, animals given transplants with CDD-expressing bone marrow cells demonstrated significantly less myelosuppression. After the first treatment period, granulocyte nadirs were 2.9 ± 0.6/nL for the CDD but 0.7 ± 0.1/nL for the control group (P = .008). Similarly, thrombocyte nadirs of 509 ± 147/nL for the CDD group but 80 ± 9/nL for the control group were observed (P = .02). As evident from Figure 2, this myeloprotective effect was highly reproducible with multiple treatment cycles.
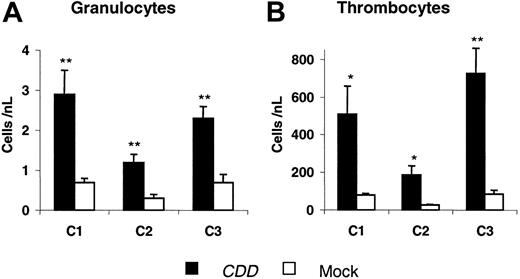
To confirm theses data, 2 additional experiments were performed. In these experiments initial gene transfer rates for the myeloid compartment of 31% ± 1% (C2) and 69 ± 2% (C3) were observed 24 days after transplantation. Granulocyte and thrombocyte nadir counts from all 3 experiments are summarized in Figure 3. Again, after the first cytarabine treatment cycle, which in all experiments was given at 4 × 500 mg/kg, significant differences between CDD and control animals were demonstrated. Also in experiments C2 and C3 the differences were reproducible with additional treatment cycles administered at doses ranging from 4 × 600 to 4 × 1000 mg/kg cytarabine (for details, see “Materials and methods”). Somewhat surprisingly, even following treatment with a dosage as high as 4 × 1000 mg/kg cytarabine no lethality was observed in the CDD as well as in the control group receiving EGFP-only transduced bone marrow.
CDD gene transfer protects granulopoiesis and thrombopoiesis from cytarabine toxicity. Peripheral blood granulocyte (A) and thrombocyte (B) counts (mean ± SEM; n = 5) in animals given transplants with CDD- or control-transduced bone marrow during 3 cycles of cytarabine treatment are given for a representative experiment (C1). */** denotes significant differences (P < .05/.01) in nadir levels by Student t test.
CDD gene transfer protects granulopoiesis and thrombopoiesis from cytarabine toxicity. Peripheral blood granulocyte (A) and thrombocyte (B) counts (mean ± SEM; n = 5) in animals given transplants with CDD- or control-transduced bone marrow during 3 cycles of cytarabine treatment are given for a representative experiment (C1). */** denotes significant differences (P < .05/.01) in nadir levels by Student t test.
CDD gene transfer increases granulocyte and thrombocyte nadir counts following cytarabine application. Nadir levels of peripheral blood granulocyte (A) and thrombocyte (B) counts (mean ± SEM; n = 5, 6, 5 animals for C1, C2, C3, respectively) following the first cytarabine treatment cycle (500 mg/kg, intraperitoneally, days 1-4) for 3 independent experiments are given. */** denotes significant differences (P < .05/.01) by Student t test.
CDD gene transfer increases granulocyte and thrombocyte nadir counts following cytarabine application. Nadir levels of peripheral blood granulocyte (A) and thrombocyte (B) counts (mean ± SEM; n = 5, 6, 5 animals for C1, C2, C3, respectively) following the first cytarabine treatment cycle (500 mg/kg, intraperitoneally, days 1-4) for 3 independent experiments are given. */** denotes significant differences (P < .05/.01) by Student t test.
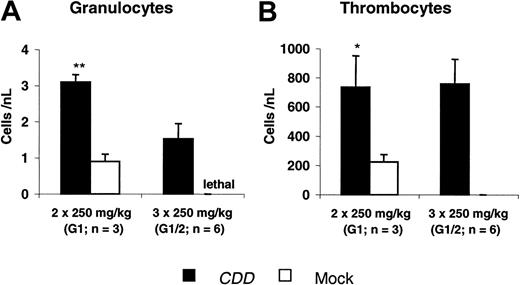
Using the same model, protection from gemcitabine-induced toxicity was demonstrated in 2 experiments. Two different dose levels (2 × 250 mg/kg and 3 × 250 mg/kg gemcitabine) were evaluated in experiment G1, whereas in the second experiment only the higher dose was given. At both dose levels significant myeloprotection was observed. At 2 × 250 mg/kg gemcitabine peripheral blood nadir counts of 3.1 ± 0.2/nL versus 0.9 ± 0.2/nL (P < .001) for granulocytes and 737 ± 223/nL versus 214 ± 53/nL (P = .03) for thrombocytes were demonstrated when the CDD and the control group were compared. A dose of 3 × 250 mg/kg gemcitabine was lethal to all control animals, whereas all animals in the CDD group survived with nadirs of 1.5 ± 0.4/nL for granulocytes and 758 ± 169/nL for thrombocytes (Figure 4).
Drug-resistance of clonogenic progenitor cells and intracellular CDD activity
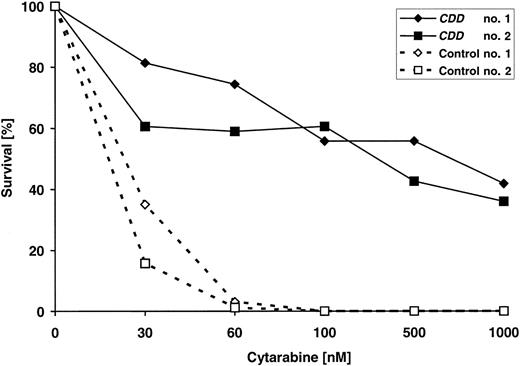
CDD gene transfer–mediated drug resistance also was reflected at the level of bone marrow–derived clonogenic progenitor cells, as assessed at the end of experiment C3, that is, 6 months after transplantation of transduced cells (Figure 5). CDD gene transfer rendered clonogenic progenitor-derived colonies resistant to cytarabine doses of up to 1000 nM, whereas clonogenic growth from control animals reproducibly was suppressed at 30 to 60 nM cytarabine. To correlate drug resistance and CDD transgene expression more directly, intracellular CDD levels were measured at the end of the same experiment, and total bone marrow and spleen cells were analyzed using HPLC methodology to quantitate breakdown of gemcitabine used as a CDD substrate. As is evident from Table 1, hematoprotection mediated by CDD gene transfer was associated with profoundly increased intracellular CDD activity. CDD activity in bone marrow and spleen cells of untreated animals was 26- and 24-fold higher in animals receiving CDD-transduced transplants compared with control animals, and in cytarabine-treated animals the corresponding increases were 149-fold for bone marrow and 64-fold for spleen cells.
CDD enzyme activity in bone marrow and spleen cells
. | Bone marrow . | . | Spleen . | . | ||
|---|---|---|---|---|---|---|
. | CDD . | Control . | CDD . | Control . | ||
| Untreated controls | 116 (2) | 4.5 ± 0.4 (3) | 39.1 (2) | 1.6 ± 0.7 (3) | ||
| Animals treated with cytarabine | 401 ± 38 (4) | 2.7 ± 1.2 (3) | 172 ± 33 (4) | 2.7 ± 1.1 (3) | ||
. | Bone marrow . | . | Spleen . | . | ||
|---|---|---|---|---|---|---|
. | CDD . | Control . | CDD . | Control . | ||
| Untreated controls | 116 (2) | 4.5 ± 0.4 (3) | 39.1 (2) | 1.6 ± 0.7 (3) | ||
| Animals treated with cytarabine | 401 ± 38 (4) | 2.7 ± 1.2 (3) | 172 ± 33 (4) | 2.7 ± 1.1 (3) | ||
Mean values ± SEM (when applicable) are given; numbers in parentheses indicate numbers of animals analyzed. CDD indicates CDD vector—transduced cells; control, control vector-transduced cells. CDD enzyme activity (nmol gemcitabine × min-1 × mg protein-1).
CDD gene transfer increases granulocyte and thrombocyte nadir counts following gemcitabine application. Nadir levels of peripheral blood granulocyte (A) and thrombocyte (B) counts (mean ± SEM; n = 3-6 animals) following gemcitabine treatment administered at 2 × 250 mg/kg (G1, G2: n = 3 each) or 3 × 250 mg/kg (G1; G2: n = 3 each; administered intraperitoneally on consecutive days) are given. Data summarize 2 independent experiments. */** denotes significant differences (P < .05/.01) by Student t test.
CDD gene transfer increases granulocyte and thrombocyte nadir counts following gemcitabine application. Nadir levels of peripheral blood granulocyte (A) and thrombocyte (B) counts (mean ± SEM; n = 3-6 animals) following gemcitabine treatment administered at 2 × 250 mg/kg (G1, G2: n = 3 each) or 3 × 250 mg/kg (G1; G2: n = 3 each; administered intraperitoneally on consecutive days) are given. Data summarize 2 independent experiments. */** denotes significant differences (P < .05/.01) by Student t test.
CDD gene transfer does not allow for selection of transduced cells by cytidine analogs in our model
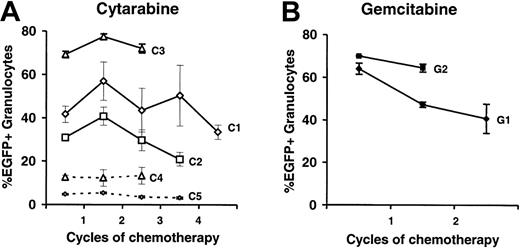
To analyze a potential enrichment of CDD-transduced cells by the chemotherapy treatment, the portion of EGFP-expressing granulocytes was analyzed. As depicted in Figure 6A no consistent increase in the percentage of EGFP-expressing cells by cytarabine treatment was observed in experiments C1-3. To analyze this aspect even more stringently, 2 additional experiments, C4 and C5, with initially much lower gene transfer rates were performed, and again, no enrichment of transduced cells was observed. Similarly, no enrichment of transduced cells was observed following gemcitabine application (Figure 6B).
Effect of CDD gene transfer on the lymphoid compartment
When the effect of CDD overexpression on the lymphoid compartment was analyzed, results were less clear cut. Throughout experiments C1, C2, and C3 cytarabine-induced lymphocytopenia was mild to moderate and no significant effect of CDD gene transfer on lymphocyte nadir levels was detected. A similar observation was made in experiment G1 with the low dose (2 × 250 mg/kg) of gemcitabine (data not shown).
On the other hand, in the CDD group the percentage of transduced lymphocytes was rather low when compared with the percentage of transduced granulocytes (Table 2). This was in contrast to the control group in which similar transduction rates were observed for peripheral blood lymphocytes and granulocytes. A similar pattern was detected when in one of the experiments (C1) transgene expression was additionally analyzed in bone marrow and spleen cells. Again, high percentage values of EGFP+ cells (85% ± 10%, 62% ± 12%, and 57% ± 11% in bone marrow granulocytes, splenic B cells, and splenic T cells, respectively) were observed in the control group, whereas CDD animals in contrast to the 41% ± 11% transgene expression in bone marrow granulocytes only showed 2.9% ± 0.2% or 4.4% ± 0.4% EGFP+ spleen-derived B or T cells. This notion of CDD toxicity to the lymphoid compartment is further supported by peripheral blood as well as splenic lymphocyte analysis. Following transplantation of CDD-transduced or control cells on hematopoietic reconstitution, peripheral blood lymphocyte counts were significantly reduced in the CDD group in all 4 experiments (C1-3, G1), characterized by high gene transfer rates (as deduced from the percentage of EGFP+ granulocytes; Table 3). A strong reverse correlation (r =–0.96) of transduction rates and peripheral blood lymphocyte counts was observed in the CDD group when experiments C1-5 and G1 were analyzed. In addition, when the number of transduced B and T lymphocytes recovered from the spleen were analyzed in 2 experiments a significant reduction of B lymphocytes (experiment C2: 2.1 ± 1.6 versus 14.4 ± 4.1 × 10⁶; P = .03; experiment C3: 0.43 versus 6.7 ± 1.7 × 10⁶; P = .03) as well as T cells (experiment C2: 1.6 ± 1.0 versus 4.8 ± 1.5 × 10⁶; P = .08; experiment C3: 0.58 verus 6.8 ± 2.1 × 10⁶) were observed in the CDD group.
Transgene expression rates in peripheral blood cells following CDD gene transfer
. | Granulocytes . | . | Lymphocytes . | . | ||
|---|---|---|---|---|---|---|
| Experiment . | CDD . | Control . | CDD . | Control . | ||
| C1 | 41.7 ± 3.7 | 57.0 ± 1.7 | 8.7 ± 1.2 | 57.5 ± 1.5 | ||
| C2 | 30.9 ± 0.7 | 41.7 ± 0.7 | 10.6 ± 0.8 | 35.2 ± 0.7 | ||
| C3 | 69.2 ± 1.6 | 23.3 ± 1.0 | 35.6 ± 2.9 | 21.9 ± 2.0 | ||
All values in the table are % EGFP+ cells.
Mean values ± SEM are given. For C1, n = 5; for C2, n = 8; and for C3, n = 12.
Peripheral blood analysis following hematopoietic reconstitution from transplantation
. | EGFP+ granulocytes, % . | Lymphocyte counts/nL . | . | Granulocyte counts/nL . | . | ||
|---|---|---|---|---|---|---|---|
| Experiment . | . | CDD . | Control . | CDD . | Control . | ||
| C1 | 41.7 ± 3.7 | 5.7 ± 1.1† | 12.9 ± 0.5 | 4.6 ± 0.7 | 6.4 ± 1.4 | ||
| C2 | 30.9 ± 0.7 | 7.4 ± 0.8* | 9.5 ± 0.6 | 3.9 ± 0.3 | 3.8 ± 0.4 | ||
| C3 | 69.2 ± 1.6 | 4.1 ± 0.3† | 10.8 ± 0.9 | 3.1 ± 0.2* | 5.8 ± 0.5 | ||
| G1 | 64.0 ± 2.3 | 4.4 ± 0.7† | 16.7 ± 1.4 | 4.0 ± 0.3 | 6.2 ± 1.6 | ||
| C4 | 4.8 ± 0.8 | 13.3 ± 1.1 | 12.1 ± 1.2 | 4.4 ± 0.4 | 3.4 ± 0.4 | ||
| C5 | 12.6 ± 1.0 | 10.6 ± 1.04 | 11.7 ± 0.5 | 3.8 ± 0.4 | 3.7 ± 0.4 | ||
Mean values ± SEM are given.
Significant difference (P < .05) by Student t test.
Significant difference (P < .01) by Student t test.
Increased cytarabine resistance of clonogenic progenitors (CFU-Cs) following CDD gene transfer. Bone marrow harvested at the end of experiment C3 from 4 animals (2 each given transplants with CDD or control-transduced grafts) were exposed to increasing concentrations of cytarabine in clonogenic cultures. Drug resistance was assessed in triplicate cultures per animal and drug concentration.
Increased cytarabine resistance of clonogenic progenitors (CFU-Cs) following CDD gene transfer. Bone marrow harvested at the end of experiment C3 from 4 animals (2 each given transplants with CDD or control-transduced grafts) were exposed to increasing concentrations of cytarabine in clonogenic cultures. Drug resistance was assessed in triplicate cultures per animal and drug concentration.
Long-term maintenance of CDD-transduced cells
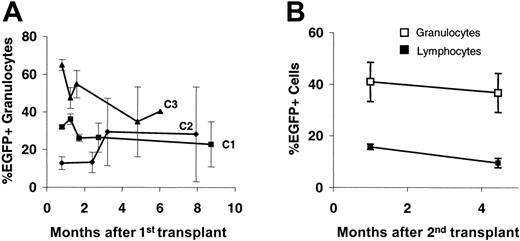
As deduced from peripheral blood counts, CDD transduction did not appear to exert negative effects on the stem-cell compartment. As shown in Figure 7A, in untreated animals peripheral blood EGFP+ expression rates in granulocytes showed some fluctuations during the first 4 to 8 weeks, representing the short-term engraftment period, but remained fairly stable thereafter for up to 9 months. A similar pattern was observed for lymphocytes although here clearly lower percentages of transduced cells were observed (data not shown). In addition, in one of the experiments (C1) long-term maintenance of CDD-transduced stem cells was proven by secondary transplantation experiments (Figure 7B).
No enrichment of CDD-transduced myelopoiesis over time by application of cytidine analogs. Percentages of EGFP-expressing peripheral blood granulocytes (mean ± SEM) are given for a total of 5 experiments (n = 5, 6, 5, 4, 3 for C1-5) using cytarabine (A) and 2 experiments (n = 3 for G1 and G2) using gemcitabine (B) application. Lines represent individual experiments and dashed lines indicate experiments performed at initially low gene transduction rates.
No enrichment of CDD-transduced myelopoiesis over time by application of cytidine analogs. Percentages of EGFP-expressing peripheral blood granulocytes (mean ± SEM) are given for a total of 5 experiments (n = 5, 6, 5, 4, 3 for C1-5) using cytarabine (A) and 2 experiments (n = 3 for G1 and G2) using gemcitabine (B) application. Lines represent individual experiments and dashed lines indicate experiments performed at initially low gene transduction rates.
Discussion
Although protection from cytidine analog-induced hematotoxicity by CDD gene transfer has been shown in various in vitro settings,6,8,10,12,14 our study now transfers these data to an in vivo model. From a clinical perspective, these data appear highly interesting because cytarabine is the most effective single agent in the treatment of acute myeloid leukemia (AML), and, in addition, shows considerable activity in acute lymphocytic leukemia and non-Hodgkin lymphoma. Clinical application of cytarabine clearly is compromised by its profound hematotoxicity and, following high-dose cytarabine treatment, severe pancytopenia lasting for 2 to 3 weeks contributes to the substantial side effects and even lethality of this treatment option.20 Gemcitabine is effective in lung, pancreatic, breast, ovarian, and other carcinomas, as well as lymphomas, and has gained widespread therapeutic acceptance in these disease entities due to its favorable toxicity profile. Again, however, hematotoxicity including granulocytopenia and thrombocytopenia usually constitutes the dose-limiting toxicity.21 Thus, the potential of CDD gene transfer for hematoprotective approaches is considerable.
Hematotoxic side effects of cytarabine and gemcitabine are well reflected in our in vivo bone marrow transplant model, because application of cytarabine as well as gemcitabine resulted in a profound, though at most doses, reversible granulocytopenia and thrombocytopenia. This is fairly expected because both human and murine progenitor cells have low CDD enzyme activity9 and in the in vitro situation comparable toxicities of cytidine analogs on murine as well as human hematopoiesis have been demonstrated.10,14 Moreover, the murine hematopoietic system has been shown to represent a critical target organ for cytarabine- as well as gemcitabine-induced toxicity in vivo.22
In our experiments, stable long-term maintenance of transduced cells in the peripheral blood of transplant recipients was demonstrated by relatively constant levels of EGFP-expressing cells. Furthermore, stable long-term expression of the CDD transgene was demonstrated by protection of the hematopoietic system from repetitive application of cytidine analogs for periods of up to 2 months. Also, vastly increased intracellular CDD activity in bone marrow and spleen cells going hand in hand with profound cytarabine resistance of clonogenic bone marrow–derived progenitor cells was demonstrated even 6 months after the initial transplantation. In addition, long-term maintenance of cells transduced with the SF91-CDD-IRES-EGFP vector was demonstrated in secondary transplant recipients. Thus, our data demonstrate a stable long-term expression of the CDD transgene in the stem-cell compartment and strongly argue against a major toxic effect of CDD expression on these primitive hematopoietic cells.
On the other hand, substantially reduced transgene expression rates were observed in lymphoid cells obtained from the peripheral blood, spleen, or bone marrow when compared with the myeloid compartment. Although preferential gene silencing of the CDD transgene in lymphoid cells is one way to explain these results, in the past stable and high transgene expression from SFFV/MESV-based vectors regularly has been observed in lymphoid cells.23-27 Thus, a lymphotoxic effect of the highly overexpressed CDD protein appears as a much more likely explanation for our data particularly in the context of significantly reduced peripheral blood lymphocyte counts in animals given transplants of high-efficiency SF91-CDD-IRES-EGFP–transduced bone marrow cells. One factor probably contributing to this toxicity is the very high CDD expression level observed in our model. Here a 24- to 149-fold increase of cytoplasmic CDD activity levels, which was observed in bone marrow and spleen cells, clearly reflects the excellent expression levels achieved with SFFV/MESV-based promoters in hematopoietic cells.18,19,23,28-32
In the past, a myelotoxic effect of CDD has also been described at least in the in vitro situation. Mature human blood granulocytes have been reported to produce and release high levels of CDD capable of inhibiting the formation of granulocyte-macrophage colony-forming cells and thereby constituting a negative feedback loop regulating late steps of myelopoietic differentiation.33,34 Although in these experiments growth inhibition of human and murine CFU-GMs by exogenously supplied CDD exposure was dependent on supraphysiologic concentrations of thymidine in the media,34 our group more recently described moderate inhibition of human CFU-GM formation by transgenic CDD overexpression in the context of normal thymidine levels.14 Thus, the mild reduction in granulocyte counts observed particularly in experiments with high percentages of transgene-expressing cells comes as no surprise. It appears, however, that the inhibitory effect of CDD expression on myeloid progenitor and precursor cells in the in vivo situation becomes ameliorated by the feedback mechanisms regulating granulocyte count homeostasis. This hypothesis also is supported by preliminary data from NOD/SCID xenotransplants, which have failed to show clear cut effects of transgenic CDD expression on human granulopoiesis (I.R., M.F., T.M., unpublished data collected throughout 2005 and 2006).
Long-term transgene expression following CDD gene transfer. Percentages (mean ± SEM) of EGFP-expressing peripheral blood granulocytes (and lymphocytes) are given for untreated primary (n = 3, each) recipients from experiments C1-3 (A) and secondary recipients (n = 8) given transplants with bone marrow from animals of experiment C1 (B). Donors were animals from the CDD group following application of 3 cytarabine treatment cycles at 500 mg/kg (intraperitoneally; days 1-4).
Long-term transgene expression following CDD gene transfer. Percentages (mean ± SEM) of EGFP-expressing peripheral blood granulocytes (and lymphocytes) are given for untreated primary (n = 3, each) recipients from experiments C1-3 (A) and secondary recipients (n = 8) given transplants with bone marrow from animals of experiment C1 (B). Donors were animals from the CDD group following application of 3 cytarabine treatment cycles at 500 mg/kg (intraperitoneally; days 1-4).
Probably the most surprising observation in our in vivo CDD gene transfer model was the lack of enrichment of CDD-transduced cells by cytarabine or gemcitabine application despite a significant protection from chemotherapy-induced myelotoxicity. This finding suggests that the protective effect exerted by CDD expression is primarily due to protection of progenitor or more mature cells rather than protection of the hematopoietic stem cell compartment. Indeed, a relatively moderate stem-cell toxicity of cytarabine compared with other hematotoxic agents such as bischloroethylnitrosourea (BCNU) or busulfan has been reported,35 and the relative quiescence of repopulating stem cells in combination with the S phase–specific activity of at least cytarabine36 offers one possible explanation. A somewhat stem-cell–sparing activity of cytarabine also is supported by its clinical toxicity profile. Here, especially following repeated cycles of high-dose (3 g/m2 × 6-8 doses) cytarabine application, a profound and long-lasting myelosuppression is nearly inevitably followed by complete or close to complete hematopoietic reconstitution. Nevertheless, some degree of stem-cell toxicity including a 4-fold decrease in long-term repopulating ability35 and a 10-fold reduction in pre-spleen CFU activity37 was demonstrated, but at least in our experimental system this did not translate in any significant in vivo selection.
Given this lack of in vivo enrichment of CDD-transduced cells in our model, a promising approach to use CDD gene transfer clinically may be the combination with other drug-resistance genes such as MDR1 or MGMT, which do allow in vivo selection, while at the same time protecting against additional drugs.1 Retroviral constructs allowing the simultaneous expression of CDD and another drug-resistance gene mutant DHFR, in hematopoietic cells have been described.11 And along this line successful treatment of B-cell lymphoma has been reported in a mouse model using CDD and mutant DHFR-transduced bone marrow to protect the hematopoietic system from the combined application of methotrexate and cytarabine.16 Given the high therapeutic efficacy of cytarabine in lymphoma and AML, the MDR1 gene, which protects cells against anthracyclines, another highly effective class of drugs in these diseases, represents a logical combination partner. Combinations with MGMT may be applicable to the treatment of lymphomas in the context of chemotherapy regimens containing the MGMT-associated BCNU, such as dexamethasone BCNU, etoposide, ara-C, melphalan (Dexa-BEAM).
In summary, our data for the first time unequivocally link protection of hematopoietic cells from cytidine analog-type drugs to transgenic overexpression of CDD in an in vivo model and define CDD as a drug-resistance gene suitable for myeloprotection. This represents an important step toward clinical use of CDD gene transfer in the context of dose-intensive chemotherapy with cytidine analog–type drugs. Before clinical application, certainly a number of issues such as a more detailed analysis of possible toxicities, confirmation of our results in other relevant in vivo models, and a more accurate evaluation of the relationship between CDD transgene expression and myeloprotection have to be addressed. In addition, for application of this strategy in the context of autologous transplantation for leukemias or lymphomas, inadvertent transduction of tumor cells remains a risk factor. Thus, in these diseases initial clinical studies in high-risk patients treated in an allogenic transplantation setting may be appropriate. If these problems can be overcome, however, CDD overexpression may represent an attractive approach to achieve hematoprotection from clinically highly relevant drugs.
Prepublished online as Blood First Edition Paper, July 11, 2006; DOI 10.1182/blood-2006-03-011734.
Supported by grants from Deutsche Forschungsgemeinschaft (M.F. and T.M.) and Interne Forschungsförderung der Medizinischen Fakultät der Universität Essen (A.B. and T.M.).
I.R., V.K., U.R.S., and W.B. performed the experiments; T.M., B.O., S.S., and M.F. were responsible for study design and data analysis; A.B. contributed to data analysis and R.A.H. contributed vital analytic tools; I.R., M.F., and T.M. wrote the manuscript; M.F. and T.M. shared equal responsibility of senior authorship.
The publication costs of this article were defrayed in part by page charge payment. Therefore, and solely to indicate this fact, this article is hereby marked “advertisement” in accordance with 18 U.S.C. section 1734.
The authors thank A. Feldmann, M. Möllmann, K. Lennartz, and M. Grubert for excellent technical help and I. Demirer for help in preparing the manuscript. The retroviral SF91 and SFβ1 backbones were kindly provided by C. Baum (Medizinische Hochschule, Hannover, Germany) and W. Ostertag (Heinrich-Pette-Institute, Hamburg, Germany). Erythropoietin was a gift from Boehringer (Mannheim, Germany).

This feature is available to Subscribers Only
Sign In or Create an Account Close Modal