Abstract
Previous results have demonstrated that anti-D therapy in children with chronic auto-immune thrombocytopenic purpura (AITP) induced a significant increase in several pro- and anti-inflammatory plasma cytokines within 2 hours of administration. To investigate the biologic basis of these early in vivo responses, we developed a flow cytometric assay to measure Fc-dependent responses of human peripheral leukocytes with fluorescently labeled and anti-D–opsonized red blood cells (RBCs). When anti-D–opsonized RBCs were incubated with peripheral blood leukocytes, the earliest detectible event observed was a significant oxidative burst in both monocytes (P < .05) and granulocytes (P < .0001), characterized by the production of hydrogen peroxide (H2O2), peroxynitrite (ONOO–), superoxide (O –2), and hydroxyl (OH) by 10 minutes which declined by 1 hour. By 2 hours, the opsonized RBCs were phagocytosed, particularly by granulocytes (P < .001), but the phagocytosis subsequently declined by 6 hours of incubation. The decline in phagocytosis was correlated with a significant production of interleukin-1 receptor antagonist (IL1ra) by both monocytes (P = .036) and granulocytes (P = .0002) within 4 hours. None of these events occurred if the RBCs were coated with anti-D F(ab)′2 fragments. When recombinant IL1ra was titrated into the assay, phagocytosis of the opsonized RBCs was significantly inhibited (P = .002). Taken together, these results suggest that at least one mechanism of action of anti-D is via the production of the anti-inflammatory cytokine IL1ra which can negatively regulate the ability of leukocytes to phagocytose opsonized cells.
Introduction
Chronic autoimmune thrombocytopenic purpura (AITP) is due to the production of autoantibodies that opsonize platelets, thus causing their rapid destruction and clearance by phagocytes within the reticuloendothelial system (RES).1 Intravenous immunoglobulin therapy has been shown to be an effective treatment in patients with AITP, resulting in increased platelet counts.2 At present, however, the mechanism(s) of action of intravenous immunoglobulin remains incompletely defined. On the basis of experimental evidence, at least 4 theories have been proposed and include Fc receptor (FcR) blockade,3 anti-idiotypic regulation,4 and modulation of intracellular cytokines.5 Recently, a novel theory of how intravenous immunoglobulin and anti-D may function in vivo, termed Fc-mediated inhibition, was postulated.6 It was shown in a murine model that intravenous immunoglobulin alters the balance of expression between the excitatory FcγRIIIa and the inhibitory FcγRIIb on splenic macrophages which drives a negative signal to the leukocytes and inhibits platelet destruction.6
Anti-D has also been shown to raise the platelet counts of patients with AITP.7 Little is known about the mechanisms of action of anti-D, although the previous theories may apply. It has been suggested that anti-D opsonizes D+ red blood cells (RBCs) and blocks platelet destruction by adhering to the Fc receptors of leukocytes.1 Alternatively, it has been suggested that anti-D may cause immunosuppression by interacting with FcγR and stimulating the production of immunosuppressive cytokines.8 We recently demonstrated that alterations in in vivo levels of pro- and anti-inflammatory cytokines after anti-D treatment may play an important role in anti-D's mechanism of action. Within 3 hours of anti-D administration, significant, but transient, changes in plasma levels of cytokines, such as interleukin-1 receptor antagonist (IL1ra), IL-6, and tumor necrosis factor α (TNF-α), occurred.9,10 A similar phenomenon has also been reported by others.11,12 These results suggest that, similar to intravenous immunoglobulin, anti-D may have several mechanisms of action.
To further examine the potential role that inhibitory cytokines may play in the mechanism of action of anti-D, we developed a flow cytometric phagocytosis assay that mimicked some of anti-D's in vivo effects. The results show that anti-D–opsonized red blood cells stimulate Fc-dependent leukocyte activation and phagocytosis that is subsequently inhibited by the production of the inhibitory cytokine, IL1ra. This suggests that anti-D, like intravenous immunoglobulin, may modulate the RES via the production of inhibitory cytokines that rescue platelet counts by inhibiting phagocytosis.
Materials and methods
Anti-D IgG and F(ab′)2 fragments
Anti-D (WinRho SDF; 1000 μg) was acquired from the Cangene Corporation (Winnipeg, MB, Canada). To distinguish Fc-dependent effects, F(ab′)2 fragments of anti-D were prepared as previously described.13 Briefly, the anti-D immunoglobulin G (IgG) molecules (1%-3% wt/vol) were dialyzed against 0.2 M sodium acetate, pH 4.5, and digested with 2% (wt/wt) pepsin (Sigma, St Louis, MO) for 24 hours at 37°C. The F(ab′)2 fragments were then purified by Sephadex G150 (Amersham Bioscience, Uppsala, Sweden) gel filtration and Protein G-Sepharose (Amersham Biosciences) adsorption. Final F(ab′)2 purity was determined by high-performance liquid chromatography (HPLC) and was typically more than 96%. When indicated, F(ab)′2 fragments of anti-D were used in the place of intact anti-D IgG.
Preparation of RBCs from whole blood
Peripheral blood from healthy Rh
Isolation of white blood cells (WBCs) from whole blood
Five parts of heparinized blood were mixed with one part of HetaSep (StemCell Technologies, Vancouver, BC, Canada) and incubated for 1 hour at room temperature to allow the aggregated RBCs to settle. The supernatant containing the leukocytes was removed, and the cells were washed twice in PBS to remove the HetaSep. This method typically achieves 98% to 99% removal of RBCs.
Fluorescent labeling and anti-D opsonization of RBCs
All the following steps were performed in the dark. Briefly, 5 × 10¹⁰ RBCs in 5 mL were incubated with an equivalent volume of CellTracker Orange (CMTMR, final concentration 20 μM; Cedarlane Laboratories, Hornby, ON, Canada) for 2 hours at 37°C with occasional shaking. The RBCs were washed twice in PBS at 480g, resuspended to 5 mL PBS, and further incubated for 1 hour to allow covalent attachment of the CMTMR to thiol-containing proteins and subsequent conversion of the dye to its fluorescent conjugate. The cells were again washed twice in PBS at 480g and resuspended to 5 mL with PBS. Anti-D opsonization of RBCs was performed by incubating 3 mL CMTMR-labeled RBCs (1010 RBC/mL) with 25 μg/mL (final concentration) anti-D for 1 hour at room temperature with gentle shaking. By flow cytometry, this procedure causes a saturated binding of anti-D to the RBCs.
Measurement of RBC phagocytosis
Phagocytosis of RBCs by monocytes and granulocytes in peripheral blood was measured by flow cytometry using a method based on a commercial phagocytosis kit (Phagotest; Orpegen Pharma, Heidelberg, Germany). This assay must be performed in the dark. Briefly, in duplicate 5-mL Falcon tubes (Becton Dickinson), 106 HetaSep-separated leukocytes in 100 μL PBS were incubated with the indicated ratios of either nonopsonized- or opsonized-CMTMR–labeled RBCs at various time points. Fluorescein isothiocyanate (FITC)–labeled Escherichia coli cells (Orpegen Pharma) were also incubated with 106 leukocytes (40:1 E coli-to-WBC ratio) as a positive phagocytosis control. One duplicate tube was incubated on ice while the other was incubated at 37°C to allow phagocytosis to proceed. After incubation, 2 mL lysis buffer (Orpegen Pharma) was added to each tube and incubated for 20 minutes at room temperature. The cells were washed once in PBS and resuspended in 150 μL PBS, and the DNA stain LDS-751 was added (final concentration 0.5 μg/mL) and incubated for 30 minutes at 4°C. RBC phagocytosis was then analyzed by flow cytometry using a FACSort flow cytometer (BD Biosciences, San Jose, CA), equipped with an argon ion laser, operating at 15 mW; 10 000 events were acquired using a “live” gate on the basis of positive LDS-751 FL3 histogram fluorescence of diploid cells, and the change in FL2 CMTMR FL2 fluorescence was compared between the tubes incubated at 4°C and 37°C. When indicated, recombinant human IL1ra (Cedarlane Laboratories) was added at the start of the assay at the concentrations shown.
Measurement of intracellular cytokines
HetaSep-separated leukocytes (5 × 10⁶/mL) were mixed with varying amounts of either anti-D–opsonized or nonopsonized RBCs in 24-well culture plates (Falcon; BD Biosciences). Cells in control wells were stimulated with a commercial leukocyte activation cocktail containing ionomycin and phorbol 12-myristate 13-acetate (PMA; BD PharMingen, San Diego, CA). The protein transport inhibitor Brefeldin-A (final concentration 10 μg/mL) was added at the start of culture to inhibit cytokine secretion. The culture plates were incubated at 37°C in a humidified CO2 incubator for 4 hours. Intracellular cytokine staining was performed according to the BD PharMingen protocol. Briefly, cells were washed and incubated with Cytofix/cytoperm buffer (BD PharMingen) for 20 minutes at room temperature. The cells were washed with Perm/Wash buffer (BD PharMingen) and incubated with the indicated phycoerythrin (PE)–conjugated anticytokine antibodies for 15 minutes at room temperature. The cells were then analyzed by flow cytometry. Frequencies of cytokine-producing cells were enumerated after gating on lymphocytes, monocytes, and granulocytes.
Measurement of reactive oxygen species (ROS)
To measure the generation of reactive oxygen species (ROS), the Phago-Burst Kit (Orpegen Pharma) was used. Briefly, 106 HetaSep-separated leukocytes were incubated with various ratios of either nonopsonized or anti-D–opsonized RBCs for 10 minutes at 37°C in the dark. The different mixtures were then incubated for 10 minutes with the fluorogenic substrate dihydrorhodamine (DHR) 123, after which time the RBCs were lysed and fixed with the reagents supplied in the kit. The cells were washed once in PBS and resuspended in 200 μL of the DNA stain LDS-751 (Molecular Probes, Eugene, OR) for 30 minutes at 4°C. During data acquisition, 10 000 events were acquired using a live-gate set in FL3 on diploid cells. For analysis, monocytes and granulocytes were gated on forward and side scatter, and the percentage of cells having produced reactive oxygen metabolites (recruitment) was determined in the FL1 channel and compared with nonstimulated leukocytes (eg, leukocyte alone). Controls included E coli cells as particulate stimulus, PMA and N-formyl-MetLeuPhe (fMLP) as high and low stimuli, respectively. In parallel assays, to distinguish different ROS, 4,5-diaminofluorescein diacetate (DAF-2-DA; Molecular Probes, Eugene, OR) and 4-((9-acridinecarbonyl)amino)-2,2,6,6-tetramethylpiperidin-1-oxyl (TEMPO-9-AC; Molecular Probes) were used instead of DHR 123 (Table 1).
Characterization of the reactive oxygen species (ROS) produced by leukocytes in the presence of anti-D–opsonized RBCs
. | . | Monocytes . | . | Granulocytes . | . | ||
|---|---|---|---|---|---|---|---|
| Fluorescent dye . | ROS detected . | Fold change . | P . | Fold change . | P . | ||
| DHR 123 | H2O2, ONOO-, HOCI | 6.71 ± 5.11 | .005 | 61.80 ± 11.56 | .0001 | ||
| DAF-2-DA | NO | 0.57 ± 0.14 | NS | 1.33 ± 0.68 | NS | ||
| TEMPO-9-AC | O2-, OH | 5.68 ± 0.93 | .006 | 9.58 ± 0.75 | .0007 | ||
Identification of reactive oxygen species (ROS) and reactive nitrogen intermediates (RNIs) using dihydrorhodamine 123 (DHR 123), 4,5-diaminofluorescein diacetate (DAF-2-DA) and 4-((9-acridinecarbonyl)amino)-2,2,6,6-tetramethylpiperidin-1-oxyl (TEMPO-9-AC). The method used was the same as that described in the legend of Figure 1, except for the substitution of DHR 123 with the various fluorescent dyes. Each fluorophore was used at a final concentration of 10 μM, and the phagocytic burst shown is at a 2000:1 (RBC/WBC) ratio. Data are expressed as mean ± SD. NS indicates not significant.
Statistics
Significance between the mean value of the test sample and its corresponding baseline was determined by Student t test for unpaired values.
Results
Production of ROS in the presence of anti-D
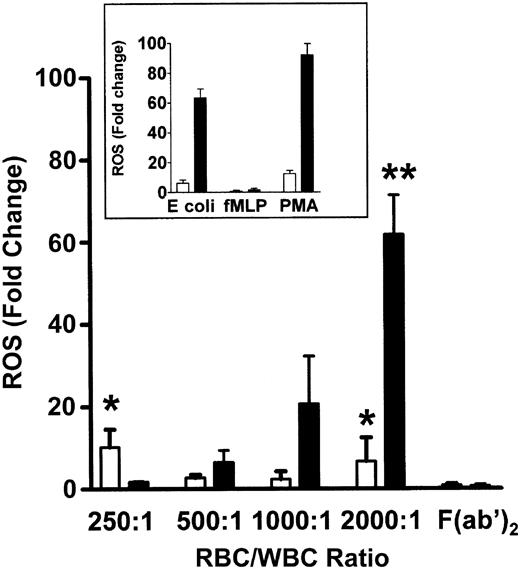
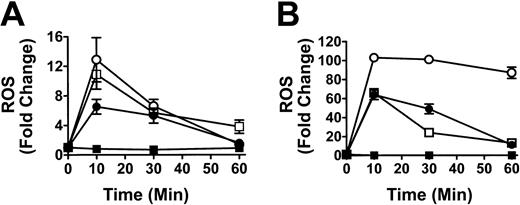
To determine if the co-incubation of WBCs and anti-D–opsonized RBCs induced an oxidative burst, the production of hydrogen peroxide (H2O2), hypochlorous acid (HOCl), and peroxynitrite (ONOO–), was measured by monitoring the oxidation of the fluorogenic substrate DHR 123. The positive controls for phagocytosis using E coli or PMA, showed a 65.1-fold and 97.7-fold increase, respectively, in granulocyte ROS production, whereas monocytes showed a relatively lower ROS increase against the E coli or PMA stimulants (Figure 1, insert). When different ratios of RBCs, opsonized with intact anti-D antibodies, were mixed with leukocytes for 10 minutes, a significant ROS burst similar to the E coli control was seen at an RBC/WBC ratio of 2000:1 for both monocytes (P < .005) and granulocytes (P < .0001) (Figure 1). Figure 1 shows that the anti-D–associated ROS burst in both monocytes and granulocytes was Fc dependent because F(ab′)2-coated RBCs (at a 2000:1 RBC/WBC ratio) did not generate ROS production. ROS production was maximal at 10 minutes of incubation and subsequently declined to baseline levels by 1 hour (Figure 2). Using the fluorophore DAF-2-DA in the ROS assay showed that no nitric oxide was being produced; however, the presence of hydroxyl (OH) and superoxide (O –2) was confirmed with the use of TEMPO-9-AC (Table 1).
Production of ROS in the presence of anti-D–opsonized RBCs. Bar chart shows the production of ROS and how they vary with increasing concentrations of anti-D–sensitized RBCs in monocytes (□) and granulocytes (▪). The inset represents ROS production in control tubes containing the particulate stimulus E coli, the low stimulus fMLP (N-formyl Met-Leu-Phe), and the high stimulus phorbol 12-myristate 13-acetate (PMA). ROS were determined by co-incubating different ratios of WBCs with anti-D–coated RBCs for 10 minutes and measuring the oxidation of the fluorophore dihydrorhodamine (DHR) 123 by flow cytometry. The data are expressed as fold change in ROS production and calculated by the formula: percentage of fluorescence (FL1)–stimulated cells/percentage of fluorescence (FL1)–nonstimulated cells. The results are shown as the means ± SDs of 5 independent experiments. Significance values are indicated (*P < .005; **P < .0001).
Production of ROS in the presence of anti-D–opsonized RBCs. Bar chart shows the production of ROS and how they vary with increasing concentrations of anti-D–sensitized RBCs in monocytes (□) and granulocytes (▪). The inset represents ROS production in control tubes containing the particulate stimulus E coli, the low stimulus fMLP (N-formyl Met-Leu-Phe), and the high stimulus phorbol 12-myristate 13-acetate (PMA). ROS were determined by co-incubating different ratios of WBCs with anti-D–coated RBCs for 10 minutes and measuring the oxidation of the fluorophore dihydrorhodamine (DHR) 123 by flow cytometry. The data are expressed as fold change in ROS production and calculated by the formula: percentage of fluorescence (FL1)–stimulated cells/percentage of fluorescence (FL1)–nonstimulated cells. The results are shown as the means ± SDs of 5 independent experiments. Significance values are indicated (*P < .005; **P < .0001).
Time course analysis of the production of ROS in monocytes and granulocytes. Graphs show production of ROS in monocytes (A) and granulocytes (B). Leukocytes were incubated with anti-D–opsonized RBCs (□) for the indicated times, and ROS production was analyzed as in Figure 1. Controls, including the stimulants E coli (•), fMLP (▪), and PMA (○), are shown. The data are expressed as fold change in ROS production ± SD and calculated by the formula: percentage of fluorescence (FL1)–stimulated cells/percentage of fluorescence (FL1)–nonstimulated cells.
Time course analysis of the production of ROS in monocytes and granulocytes. Graphs show production of ROS in monocytes (A) and granulocytes (B). Leukocytes were incubated with anti-D–opsonized RBCs (□) for the indicated times, and ROS production was analyzed as in Figure 1. Controls, including the stimulants E coli (•), fMLP (▪), and PMA (○), are shown. The data are expressed as fold change in ROS production ± SD and calculated by the formula: percentage of fluorescence (FL1)–stimulated cells/percentage of fluorescence (FL1)–nonstimulated cells.
Phagocytosis of anti-D–opsonized RBCs by monocytes and granulocytes
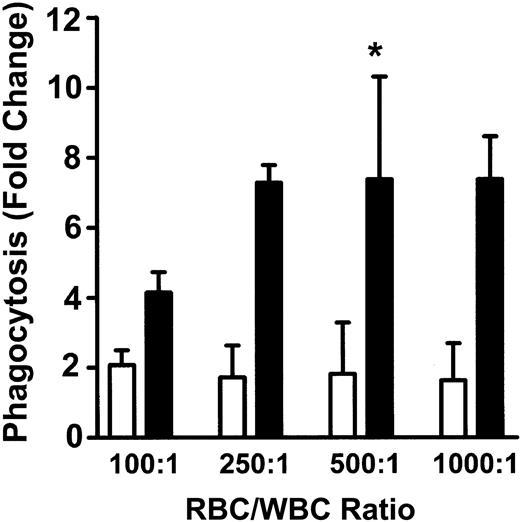
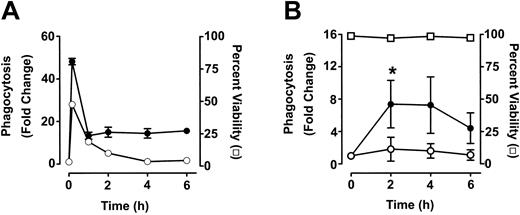
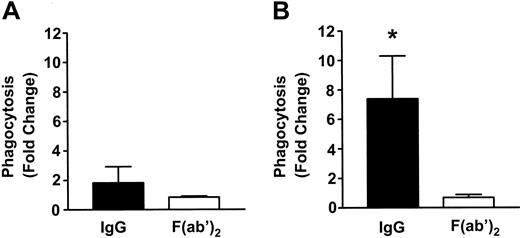
To measure phagocytosis, human RBCs were labeled with the fluorescent dye CMTMR, opsonized with anti-D and incubated with HetaSep-separated leukocytes for various times at 37°C (Figure 3). As shown in Figure 4, at 2 hours, an approximate 2-fold increase in monocytic phagocytosis was seen at the ratios indicated, whereas, in granulocytes, the phagocytosis response was significantly (P < .001) more pronounced (4.4- to 7.7-fold) at all the RBC-to-leukocyte ratios tested. At a 500:1 (RBC/WBC) ratio, within 2 hours, significant (P < .001) phagocytosis of anti-D–opsonized RBCs by granulocytes could be detected, whereas monocyte phagocytosis of the anti-D–opsonized RBCs was significantly (P < .01) lower (Figure 5). Subsequently, the levels of both granulocyte and monocyte phagocytosis decreased by 6 hours of incubation (Figure 5). To determine the Fc-dependence of the phagocytosis, RBCs were coated with anti-D F(ab)′2 fragments. In contrast to RBCs opsonized with intact anti-D, no phagocytosis was detected with RBCs coated with F(ab′)2 fragments (Figure 6). Furthermore, although unlabeled intact anti-D–opsonized RBCs could competitively inhibit labeled and anti-D–opsonized RBC phagocytosis, RBCs coated with anti-D F(ab′)2 fragments were unable to inhibit phagocytosis (not shown). Thus, the phagocytosis of anti-D–opsonized RBCs was Fc dependent. When titrations of H2O2 were added to the assay, no effect on anti-D–opsonized phagocytosis was observed (not shown).
Flow cytometric histogram analysis of phagocytosis of anti-D–opsonized RBCs by granulocytes and monocytes. Leukocytes were incubated in duplicate tubes (one at 4°C and the other at 37°C) with anti-D–opsonized RBCs at an RBC/WBC ratio of 500:1 for 2 hours and analyzed by flow cytometry (A). Panel B shows the CMTMR FL2 fluorescence of gated monocytes (panel A, R1 gate), whereas panel C shows the CMTMR FL2 fluorescence of gated granulocytes (panel A, R2 gate) incubated at the indicated temperatures (thin line, 4°C; thick line, 37°C). The data shown are from one representative experiment.
Flow cytometric histogram analysis of phagocytosis of anti-D–opsonized RBCs by granulocytes and monocytes. Leukocytes were incubated in duplicate tubes (one at 4°C and the other at 37°C) with anti-D–opsonized RBCs at an RBC/WBC ratio of 500:1 for 2 hours and analyzed by flow cytometry (A). Panel B shows the CMTMR FL2 fluorescence of gated monocytes (panel A, R1 gate), whereas panel C shows the CMTMR FL2 fluorescence of gated granulocytes (panel A, R2 gate) incubated at the indicated temperatures (thin line, 4°C; thick line, 37°C). The data shown are from one representative experiment.
Phagocytosis of anti-D–opsonized RBCs by monocytes and granulocytes. Leukocytes were incubated in duplicate tubes (one at 4°C and the other at 37°C) with anti-D–opsonized RBCs at the indicated ratios for 2 hours, and phagocytosis was analyzed by flow cytometry. The data are expressed as fold change in phagocytosis and calculated by the formula: percentage of FL2 fluorescence at 37°C/percentage of FL2 fluorescence at 4°C. □ indicates monocytes; and ▪, granulocytes. The results are shown as the means ± SDs of 5 independent experiments. Significance values are indicated (*P < .001).
Phagocytosis of anti-D–opsonized RBCs by monocytes and granulocytes. Leukocytes were incubated in duplicate tubes (one at 4°C and the other at 37°C) with anti-D–opsonized RBCs at the indicated ratios for 2 hours, and phagocytosis was analyzed by flow cytometry. The data are expressed as fold change in phagocytosis and calculated by the formula: percentage of FL2 fluorescence at 37°C/percentage of FL2 fluorescence at 4°C. □ indicates monocytes; and ▪, granulocytes. The results are shown as the means ± SDs of 5 independent experiments. Significance values are indicated (*P < .001).
Time course analysis of monocyte and granulocyte phagocytosis of anti-D–opsonized RBCs. Leukocytes were incubated in duplicate tubes (one at 4°C and the other at 37°C) with either opsonized E coli (A) or anti-D–opsonized RBCs (B) at an RBC/WBC ratio of 500:1 for the indicated times and analyzed by flow cytometry. The data are expressed as fold change in phagocytosis and calculated by the formula: percentage of FL2 fluorescence at 37°C/percentage of FL2 fluorescence at 4°C. ○ indicates monocytes; and •, granulocytes. In panel B, viability (□) of granulocytes was determined by propidium iodide staining. Monocytes gave similar viability percentages (not shown). The results are shown as the means ± SDs of 3 independent experiments. Significance values are indicated (*P < .0001).
Time course analysis of monocyte and granulocyte phagocytosis of anti-D–opsonized RBCs. Leukocytes were incubated in duplicate tubes (one at 4°C and the other at 37°C) with either opsonized E coli (A) or anti-D–opsonized RBCs (B) at an RBC/WBC ratio of 500:1 for the indicated times and analyzed by flow cytometry. The data are expressed as fold change in phagocytosis and calculated by the formula: percentage of FL2 fluorescence at 37°C/percentage of FL2 fluorescence at 4°C. ○ indicates monocytes; and •, granulocytes. In panel B, viability (□) of granulocytes was determined by propidium iodide staining. Monocytes gave similar viability percentages (not shown). The results are shown as the means ± SDs of 3 independent experiments. Significance values are indicated (*P < .0001).
Fc-dependence of phagocytosis of anti-D–coated RBCs in monocytes and granulocytes. RBCs were coated with intact anti-D or anti-D F(ab)′2 fragments and incubated with leukocytes at an RBC/WBC ratio of 500:1 for 2 hours, and phagocytosis in monocytes (A) and granulocytes (B) was measured by flow cytometry. The data are expressed as fold change in phagocytosis and calculated by the formula: percentage of FL2 fluorescence at 37°C/percentage of FL2 fluorescence at 4°C. The results are shown as the means ± SDs of 5 independent experiments. Significance values are indicated (*P < .001).
Fc-dependence of phagocytosis of anti-D–coated RBCs in monocytes and granulocytes. RBCs were coated with intact anti-D or anti-D F(ab)′2 fragments and incubated with leukocytes at an RBC/WBC ratio of 500:1 for 2 hours, and phagocytosis in monocytes (A) and granulocytes (B) was measured by flow cytometry. The data are expressed as fold change in phagocytosis and calculated by the formula: percentage of FL2 fluorescence at 37°C/percentage of FL2 fluorescence at 4°C. The results are shown as the means ± SDs of 5 independent experiments. Significance values are indicated (*P < .001).
Alteration of cytokine pattern in the presence of anti-D
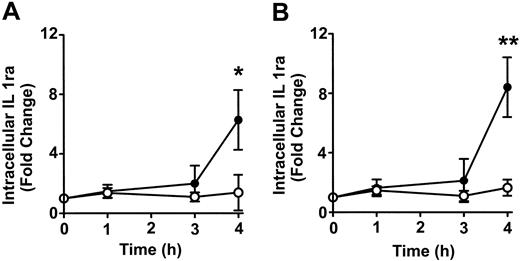
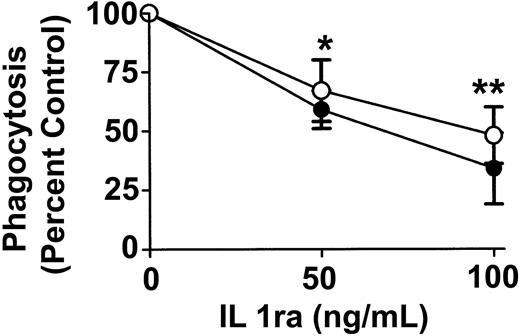
To determine whether anti-D–opsonized RBCs affect monocyte and granulocyte cytokine production, intracellular cytokine levels were measured at different time points after incubation with the opsonized RBCs. No detectable change was noticed with the cytokines granulocyte-macrophage colony-stimulating factor (GM-CSF), TNF-α, IL-6, and the chemokine macrophage inflammatory protein 1 α (MIP-1α) (not shown). However, compared with nonopsonized RBCs, Figure 7 shows that the intact anti-D–opsonized RBCs significantly enhanced the intracellular levels of IL1ra by 4 hours in both monocytes (P = .036) and granulocytes (P = .0002). These data confirmed that anti-D–opsonized RBCs up-regulate IL1ra production in both monocytes and granulocytes. To determine whether IL1ra can affect the course of phagocytosis, exogenous IL1ra was titrated into the assay at time 0 hours. By 2 hours, IL1ra was found to significantly inhibit the phagocytosis of anti-D–opsonized RBCs by granulocytes (P < .002) in a dose-dependent manner (Figure 8). Thus, recombinant IL1ra can inhibit the phagocytosis of anti-D–opsonized RBCs in vitro.
Time course of the change in intracellular IL1ra expression in monocytes and granulocytes. Anti-D–opsonized RBCs were incubated with leukocytes at a ratio of 500:1 for the indicated times, and intracellular cytokine levels in monocytes (A) and granulocytes (B) were determined after permeabilizing and fixing the leukocytes according to the BD PharMingen protocol. Data are expressed as fold change in intracellular IL1ra expression stimulated by opsonized RBCs (•)or nonopsonized RBCs (○). The results are shown as the means ± SDs of 6 independent experiments. Significance values are indicated (*P = .036; **P = .0002).
Time course of the change in intracellular IL1ra expression in monocytes and granulocytes. Anti-D–opsonized RBCs were incubated with leukocytes at a ratio of 500:1 for the indicated times, and intracellular cytokine levels in monocytes (A) and granulocytes (B) were determined after permeabilizing and fixing the leukocytes according to the BD PharMingen protocol. Data are expressed as fold change in intracellular IL1ra expression stimulated by opsonized RBCs (•)or nonopsonized RBCs (○). The results are shown as the means ± SDs of 6 independent experiments. Significance values are indicated (*P = .036; **P = .0002).
Effect of exogenous IL1ra on phagocytosis of anti-D–coated RBCs after 2 hours of incubation in monocytes and granulocytes. The indicated final concentrations of IL1ra were co-incubated with anti-D–opsonized RBCs and WBCs at an RBC/WBC ratio of 500:1 for 2 hours, and phagocytosis was measured by flow cytometry. ○ indicates monocytes; and •, granulocytes. The data are expressed as a percentage of control of phagocytosis and were calculated by the formula: (percentage of 37°C-positive cells + IL1ra/percentage of 37°C-positive control cells – IL1ra) × 100. The results are expressed as the means ± SDs of 3 independent experiments. Significance values are indicated (*P < .002; **P < .001).
Effect of exogenous IL1ra on phagocytosis of anti-D–coated RBCs after 2 hours of incubation in monocytes and granulocytes. The indicated final concentrations of IL1ra were co-incubated with anti-D–opsonized RBCs and WBCs at an RBC/WBC ratio of 500:1 for 2 hours, and phagocytosis was measured by flow cytometry. ○ indicates monocytes; and •, granulocytes. The data are expressed as a percentage of control of phagocytosis and were calculated by the formula: (percentage of 37°C-positive cells + IL1ra/percentage of 37°C-positive control cells – IL1ra) × 100. The results are expressed as the means ± SDs of 3 independent experiments. Significance values are indicated (*P < .002; **P < .001).
Discussion
The mechanisms of action of anti-D in the treatment of AITP remain relatively poorly understood. It was previously shown that anti-D given to children with chronic AITP initiated an early but transient elevation in several plasma cytokines within 3 hours of administration, particularly IL1ra.9,10,12 To further study this effect and to investigate other biochemical changes associated with anti-D, we developed flow cytometric assays to monitor various Fc-dependent events potentially related to opsonized RBCs; these events included oxidative burst, phagocytosis, and cytokine modulation. Our results suggest that the Fc-dependent modulation of IL1ra may play a crucial role in mediating the effects of anti-D.
Anti-D–opsonized RBCs were able to induce a significant increase in ROS production in granulocytes and, to a lesser extent, in monocytes within 10 minutes (Figures 1, 2). In granulocytes, the generation of ROS was dose dependent on the amount of opsonized RBCs added to the assay. Few reports have studied the effects of intravenous immunoglobulin or anti-D on the generation of ROS. With respect to intravenous immunoglobulin, Aukrust et al14 demonstrated that intravenous immunoglobulin decreased monocyte ROS production, whereas Nakatani et al15 showed that intravenous immunoglobulin could significantly enhance ROS in endothelial cells. The reasons for these discrepancies are unknown but may reflect the ability of intravenous immunoglobulins to cause different effects, depending on the cells studied. The results in the present study are the first to suggest that anti-D–opsonized RBCs enhance ROS production in both monocytes and granulocytes. The early ROS production may simply be a marker of Fc-FcR interaction at the leukocyte surface, or, alternatively, there is evidence to suggest that ROS can act as second messengers, particularly H2O2.16 Although exogenously added H2O2 did not affect phagocytosis, intracellular levels of ROS may be involved in the regulation of leukocyte phagocytosis. We are currently studying this possibility.
Further downstream from the ROS production, erythrophagocytosis was significantly enhanced after 2 hours in the presence of anti-D (Figure 5), and, by 6 hours, this activity was beginning to decrease. The decrease was not solely due to cell death because viability was unchanged as measured by propidium iodide (PI) staining (Figure 5). This finding suggests that phagocytosis may be actively inhibited in the assay. Several reports have demonstrated that opsonized or damaged RBCs can be efficiently phagocytosed by adherent or monolayer cultures of macrophages17-19 ; however, few studies have analyzed the ability of both monocytes and granulocytes to phagocytose anti-D–opsonized RBCs in suspension cultures. We found that the granulocyte phagocytosis was significantly higher than monocyte phagocytosis at all the RBC/WBC ratios examined (Figure 5). Our data are consistent with earlier studies demonstrating in vitro erythrophagocytosis by granulocytes.20,21 The reasons for the elevated granulocyte phagocytosis are unclear but may be related to the activation state of HetaSep-separated leukocytes in suspension. This theory is supported by the observation that in these assays all the monocyte responses against either opsonized RBCs or control stimulations with E coli were less pronounced than the granulocyte responses. Nonetheless, although the monocyte phagocytosis of anti-D–opsonized RBCs did not reach significance, it had a similar trend over time compared with granulocyte phagocytosis; this trend was also observed in the monocyte E coli controls (Figure 5A).
On the basis of the cytokine data from our in vivo studies in children with AITP,9,10 we measured several intracellular cytokines within the monocytes and granulocytes. Of all the cytokines tested (IL-6, GM-CSF, TNF-α, and MIP-1α), only IL1ra was detected intracellularly in both granulocytes and monocytes (Figure 7). These results suggest that the cytokines observed the sera of children with AITP, but not observed in the in vitro assay, may be derived from a source other than peripheral blood leukocytes. IL1ra is structurally related to IL1β22-24 and binds to the IL1 receptor.25-27 IL1ra binding to the IL1 receptor, however, does not transmit an intracellular signal as IL1 does, and, thus, it acts as a potent anti-inflammatory cytokine counteracting the inflammatory effects of IL1, eg, inhibition of phagocytosis.26,27 The detection of intracellular IL1ra in the phagocytosis assay indicates that opsonized RBCs may induce phagocytes, in an Fc-dependent manner, to produce large quantities of IL1ra to potentially reduce a subsequent inflammatory reaction.
Earlier reports have demonstrated that intravenous immunoglobulin can significantly increase IL1ra levels in vivo,28,29 and Davenport et al30 also showed that anti-D–coated RBCs could stimulate peripheral blood mononuclear cells (PBMCs) in vitro to secrete IL1ra within 4 hours. The researchers suggested that anti-D–induced cytokine alterations might account for some of the pathophysiologic events seen in IgG-mediated immune hemolysis. What our results additionally suggest is that IL1ra is in fact responsible for inhibiting anti-D–opsonized RBC phagocytosis by both monocytes and granulocytes. Exogenously added IL1ra (100 ng/mL) was found to significantly (P < .002) decrease phagocytosis (Figure 8). This finding correlated well with the production of the cytokine at 4 hours in the in vitro assay measuring intracellular cytokine levels (Figure 7). These data suggest that not only does anti-D–opsonized RBCs induce the production of IL1ra, but the cytokine can also actively inhibit the RBC phagocytosis. The exact mechanism of this inhibition is unclear at present. The IL1ra may act intracellularly or, alternatively, may inhibit intracellular signal transduction processes normally occurring after engagement of the receptor with IL1.24,25 We are currently studying these possibilities.
In summary, a timeline for the effects of anti-D in an in vitro system has been established. An early leukocyte oxidative burst occurs as early as 10 minutes, which depends on the presence of the Fc portion of anti-D. At 2 hours, phagocytosis of anti-D–sensitized RBCs takes place in an Fc-dependent manner, and, subsequently, the levels of the cytokine IL1ra significantly increases at 4 hours, with the consequence that phagocytosis of anti-D–opsonized RBCs decreases. These results suggest that at least one mechanism of action of anti-D is an Fc-mediated increase in IL1ra, which effectively inhibits phagocytosis of opsonized cells.
Prepublished online as Blood First Edition Paper, June 26, 2003; DOI 10.1182/blood-2003-04-1029.
Supported by a grant from the Canadian Blood Services R&D Fund (XT00027).
The publication costs of this article were defrayed in part by page charge payment. Therefore, and solely to indicate this fact, this article is hereby marked “advertisement” in accordance with 18 U.S.C. section 1734.


This feature is available to Subscribers Only
Sign In or Create an Account Close Modal