We read with interest the article of Cushman and colleagues1 entitled “Fibrin fragment D-dimer and the risk of future venous thrombosis.” The article reports that plasma D-dimer is strongly and positively related to the occurrence of future venous thrombosis. Based on this finding the authors make a forceful statement that “the strength of the association observed here, and its consistency in various subgroups, suggests potential clinical roles for D-dimer assessment that could be tested in future clinical studies.” While we agree that the findings of this study are interesting and should be investigated further, we would also like to point out that a number of issues need to be addressed by the investigators in any follow-up study.
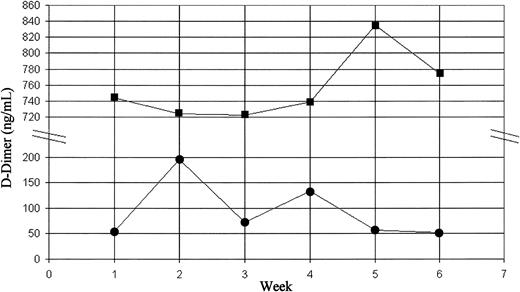
First, studies need to be carried out to find out whether plasma D-dimer levels are stable enough over a period in a particular individual (ie, not subject to wide fluctuations) to permit reliable and accurate interpretations. If not, it will be impossible to make any meaningful interpretations or clinical judgements. In order to establish whether plasma D-dimer levels are “stable” in healthy individuals, we measured our own D-dimer levels weekly over a 6-week period. The measurement of D-dimer was carried out using a commercial kit (Instrumentation Laboratory, Warrington, United Kingdom). As shown in Figure 1, the D-dimer levels of Muttuswamy Sivakumaran (MS) showed noticeable fluctuations, with values ranging from 52 ng/mL to 195 ng/mL (first quintile to the fourth in Cushman et al's distribution curve). This observation raises the question of whether one could use a single measurement of D-dimer level to predict thrombotic risk.
Dynamic changes in plasma D-dimer levels. Weekly measurements of plasma D-dimer levels were carried out using a latex agglutination method. Squares indicate NM; circles, MS.
Dynamic changes in plasma D-dimer levels. Weekly measurements of plasma D-dimer levels were carried out using a latex agglutination method. Squares indicate NM; circles, MS.
Second, it is important that, as in the case of other parameters used in thrombophilia screening (eg, protein C, protein S, and antithrombin III), one should have a normal range or at least an upper level for the plasma D-dimer level above which the values could be considered abnormal. Do Cushman and colleagues propose the value between the fourth and the fifth quintiles (277 ng/mL) or a figure derived from the median of the cohort plus a standard deviation of 2 as that cutoff figure?
Finally, one should consider the implications of extreme values. A significant number of controls in Cushman's cohort had very high D-dimer levels (over 1000 ng/mL). As in the case of Neil Malton (NM; Figure 1), these individuals probably have, for hitherto unexplained reasons, abnormally high baseline D-dimer levels (“hyperfibrinemia” or “hyper D-dimeremia”). The important question is whether the high plasma levels are due to increased production or to reduced clearance of D-dimers from the circulation. The authors measured their own random urine D-dimer levels on the day they had their last blood test. The plasma and urine D-dimer levels of NM were 775 ng/mL and 57 ng/mL, respectively, whereas those of MS were 52 ng/mL and 74 ng/mL, respectively. In other words, the random urine D-dimer levels of NM and MS were 7.4% and 142% of plasma levels, respectively. This finding may suggest that the extreme values recorded in some otherwise healthy individuals may be at least partly due to slower clearance of D-dimers, thus raising the question of whether a ratio of plasma and urine D-dimer levels may be more informative than an isolated plasma level for thrombotic risk assessment of aymptomatic individuals. Obviously, larger studies are required to answer this question. Whatever the cause of these extreme values, they do raise an important question that has a direct clinical relevance: How can we distinguish these asymptomatic individuals with high plasma D-dimer levels from those with raised levels due to an underlying active thrombotic state to prevent making erroneous clinical decisions?
Response: Use of D-dimer in thrombosis risk assessment
The concerns of Sivakumaran and Malton are important and relate primarily to potential clinical application of D-dimer measurement. Based on our findings alone it would be premature to use clinical D-dimer tests in risk assessment of healthy patients for venous thrombosis.1,2 While higher within-person variability would bias research findings to the null hypothesis of no association, in clinical testing the correct classification of patients as to normal or elevated D-dimer levels is very important. As for any biomarker, in the research setting the strong association we observed is an underestimate of the true association, due to within-person and analytical variability. We previously addressed within-person variability for several coagulation and inflammation factors, including the research-based D-dimer assay used in the Longitudinal Investigation of Thromboembolism Etiology (LITE).3 For D-dimer, the index of individuality, or the degree to which an analyte varies over time in an individual relative to the population, was 0.63 (similar to a value of 0.44 for cholesterol). In order to measure D-dimer with the same intraindividual variation as cholesterol, 2 measurements would be needed. These intraindividual variability statistics are similar to those of the emerging cardiovascular disease risk marker, high-sensitivity C-reactive protein,3 now a widely used clinical test. Other investigators have also reported acceptable reliability of D-dimer measurement.4
Because we have not proposed that D-dimer testing be done in clinical settings on the basis of our findings, it would be premature to recommend a cutoff value to define elevated D-dimer, or a mode of investigation to assess apparently healthy subjects with very high values (more than 1000 ng/mL). Since D-dimer assessment is also currently being studied in risk assessment for predicting recurrent venous thrombosis,5 its reproducibility in patients with previous thrombosis will require stringent assessment, as D-dimer in these patients may be higher than in healthy individuals.
Correspondence: Mary Cushman, Departments of Medicine and Pathology, University of Vermont, 208 South Park Drive, Suite 2, Colchester, VT 05446; e-mail: mary.cushman@uvm.edu


This feature is available to Subscribers Only
Sign In or Create an Account Close Modal