Abstract
The translocation t(8;21) yields the leukemic fusion gene AML1/MTG8 and is associated with 10%-15% of all de novo cases of acute myeloid leukemia. We demonstrate the efficient and specific suppression of AML1/MTG8 by small interfering RNAs (siRNAs) in the human leukemic cell lines Kasumi-1 and SKNO-1. siRNAs targeted against the fusion site of the AML1/MTG8 mRNA reduce the levels of AML1/MTG8 without affecting the amount of wild-type AML1. These data argue against a transitive RNA interference mechanism potentially induced by siRNAs in such leukemic cells. Depletion of AML1/MTG8 correlates with an increased susceptibility of both Kasumi-1 and SKNO-1 cells to tumor growth factor β1 (TGFβ1)/vitamin D3–induced differentiation, leading to increased expression of CD11b, macrophage colony-stimulating factor (M-CSF) receptor, and C/EBPα (CAAT/enhancer binding protein). Moreover, siRNA-mediated AML1/MTG8 suppression results in changes in cell shape and, in combination with TGFβ1/vitamin D3, severely reduces clonogenicity of Kasumi-1 cells. These results suggest an important role for AML1/MTG8 in preventing differentiation, thereby propagating leukemic blast cells. Therefore, siRNAs are promising tools for a functional analysis of AML1/MTG8 and may be used in a molecularly defined therapeutic approach for t(8;21)-positive leukemia.
Introduction
The translocation t(8;21)(q22;q22) occurs in about 10%-15% of all de novo acute myeloid leukemia (AML) patients. It fuses the AML1 gene located on chromosome 21 (also called RUNX1) to the MTG8 (ETO, CBF2T1) gene on chromosome 8.1 This translocation replaces the transactivation domain of AML1 with the almost complete MTG8 protein, thereby converting an essential transcriptional activator of definitive hematopoiesis into a constitutive and transdominant transcriptional repressor.2-4 It is most probable that the chimeric AML1/MTG8 protein interferes with normal AML1-dependent transcription by recruiting an active repressor complex, including N-CoR, mSin3, and histone-deacetylases via the MTG8 part of the protein.5-7Recent data indicate that the direct interaction of AML1/MTG8 with other transcription factors, such as SMA- and MAD-related protein 3 (SMAD3) or C/EBPα (CAAT/enhancer binding protein), contributes to the block in differentiation.8-10 Ectopic expression of AML1/MTG8 in hematopoetic cells inhibits proliferation and differentiation and enhances the self-renewal capacity of hematopoietic stem cells, thereby providing a reservoir of preleukemic cells.9,11-13 However, AML1/MTG8 alone may not be sufficient to induce leukemia.11 14-17 The role of AML1/MTG8 during leukemogenesis is not yet fully understood. One approach to address this question is to selectively deplete the AML1/MTG8 protein in leukemic cells and to study the consequences of AML1/MTG8 depletion on gene expression and phenotype of these cells.
Gene suppression by double-stranded RNAs is a natural, widely occurring phenomenon, particularly for the control of transgene expression. It has been described in plants as “posttranscriptional gene silencing” (PTGS), in Neurospora as “quelling,” and in C elegans or Drosophila as “RNA interference” (RNAi).18 Apparently, PTGS, quelling, and RNAi are based on similar mechanisms. A long double-stranded RNA is digested into short fragments of 21 to 25 nucleotides in length, named small interfering RNAs (siRNA), by an RNaseIII-type activity called “Dicer”.19 These siRNAs are assembled into a ribonucleoprotein complex called “RISC” (RNA-induced silencing complex), which binds in an adenosine triphosphate–dependent mode to target RNAs being complementary to one of the siRNA strands, and subsequently trigger target RNA degradation.20-22 So far, 2 different models for siRNA-mediated RNA degradation have been proposed. In the “guide” model, RISC induces cleavage in the complementary target RNA, leading to its degradation.23 The “degradative PCR (polymerase chain reaction)” model suggests a primer function for the siRNA.24,25 In the latter scenario, the siRNA upon annealing with the target RNA becomes elongated by an RNA-dependent RNA polymerase activity. Dicer digests the resulting long double-stranded RNA, thereby creating a second generation of siRNAs, which initiate the next round of annealing and polymerization. These secondary siRNAs may be complementary to target RNA regions located upstream of the target sequences of the primary siRNAs. Therefore, one possible consequence of the degradative PCR model is the occurrence of “transitive” RNAi, in which other mRNAs, sharing sequence elements located upstream of the primary target region, are suppressed by secondary siRNAs in addition to the intended target RNA.26Thus, transitive RNA interference may decrease the specificity of RNAi.
Recently, siRNAs also were shown to interfere efficiently with mammalian gene expression.27 28 We applied siRNAs to inhibit AML1/MTG8 expression and investigated both the efficacy and specificity of siRNAs in the t(8;21)-positive cell lines. In addition, we examined the consequences of AML1/MTG8 suppression on gene expression and the phenotype of these cells.
Materials and methods
Oligoribonucleotides
Oligoribonucleotides (ORNs) were either obtained from Dharmacon Research (Lafayette, CO), from MWG-Biotech (Ebersberg, Germany), or were synthesized by Ribopharma AG (Kulmbach, Germany). The siRNA sequences and their corresponding target sites are shown in Table1. siRNAs were hybridized at a final concentration of 10 to 20 μM in hybridization buffer (25 mM Tris[tris(hydroxymethyl)aminomethane]-Cl pH 7.5, 100 mM NaCl) by heating them to 95°C and slow cooling to room temperature.
siRNA sequences and target sites
| siRNA . | Sequence . | Target mRNA (GenBank accession no.) . | Target site location . |
|---|---|---|---|
| siAGF1 | 5′-CCUCGAAAUCGUACUGAGAAG-3′ | AML1/MTG8 (D13979) | 2102-2122 |
| 3′-UUGGAGCUUUAGCAUGACUCU-5′ | |||
| siAGF2 | 5′-CCUCGAAAUCGUACUGAGAAG-3′ | AML1/MTG8 (D13979) | 2100-2122 |
| 3′-UUGGAGCUUUAGCAUGACUCUUC-5′ | |||
| siAGF6 | 5′-CCUCGAAUUCGUUCUGAGAAG-3′ | AML1/MTG8 (D13979) | 2102-2122 |
| 3′-UUGGAGCUUAAGCAAGACUCU-5′ | |||
| siAM | 5′-CCUCGAAAUCGUACUGAGATT-3′ | AML1/MTG8 (D13979) | 2102-2122 |
| 3′-TTGGAGCUUUAGCAUGACUCU-5′ | |||
| siAML1 | 5′-CCUCGAAGACAUCGGCAGAAA-3′ | AML1 (D43968) | 2102-2122 |
| 3′-UUGGAGCUUCUGUAGCCGUCUUU-5′ | |||
| siGL2 | 5′-CGUACGCGGAAUACUUCGATT-3′ | P pyralis luciferase M15077 | 514-533 |
| 3′-TTGCAUGCGCCUUAUGAAGCU-5′ | |||
| siK3 | 5′-GAUGAGGAUCGUUUCGCAUGA-3′ | Neomycin phosphotransferase II (L11017) | 4204-4184 |
| 3′-UCCUACUCCUAGCAAAGCGUA-5′ | |||
| siK4 | 5′-GAUGAGGAUCGUUUCGCAUGA-3′ | Neomycin phosphotransferase II (L11017) | 4202-4184 |
| 3′-UCCUACUCCUAGCAAAGCGUACU-5′ | |||
| Cy3-siGL2 | 5′-Cy3-CGUACGCGGAAUACUUCGATT-3′ | P pyralis luciferase M15077 | 514-533 |
| 3′-TTGCAUGCGCCUUAUGAAGCU-5′ |
Cell culture and transfection of t(8;21)-positive cells with siRNAs
Kasumi-129 cells were cultured in RPMI 1640 plus 10% fetal calf serum (FCS), and SKNO-130 cells were cultivated in RPMI 1640 plus 20% fetal calf serum containing 10 ng/mL granulocyte-macrophage colony-stimulating factor. Exponentially growing cells were concentrated to 107 cells/mL in culture medium, and 100 to 500 μL of cell suspension was pipetted into a 4-mm electroporation cuvette. Using a rectangle electroporation protocol, we did not observe any variations in siRNA transfection efficiency between 100 and 500 μL of total volume. Immediately before the electroporation step, siRNAs were added, yielding a final concentration of 100 to 200 nM, if not otherwise specified. Electroporation was performed with a Fischer electroporator (Fischer, Heidelberg, Germany) using a rectangle pulse of 330 V for 10 mins. After incubating for 15 minutes at room temperature, the cells were diluted 20-fold with culture medium and incubated at 37°C and 5% CO2.
siRNA uptake studies
Kasumi-1 cells were washed with fluorescence-activated cell-sorting (FACS) buffer (phosphate buffered saline (PBS) + 1% bovine serum albumin (BSA) + 0.1% sodium azide) and fixed in PBS containing 2% formaldehyde 16 hours after electroporation in the presence of 100 nM 5′–Cy3-labeled siGL2. The amount of fluorescently stained cells was determined by flow cytometry using a FACSCalibur (Becton Dickinson, Heidelberg, Germany). To examine the intracellular distribution of siRNAs, washed and fixed cells were pipetted onto coverslips. After mounting in Vectashield (Vector, Burlingame, CA), images were acquired with an LSM 510 (Zeiss, Oberkochen, Germany).
RNase protection assays
After a period of 16 hours to 4 days, total RNA was isolated with RNeasy (Qiagen, Hilden, Germany) and analyzed by RNase protection assays as described previously,31 using an RNA probe of 315 nucleotides in length, covering the AML1/MTG8 mRNA fusion site. The protected fragment sizes were 240 nucleotides for AML1/MTG8 and 100 nucleotides for AML1. Data acquisition and analysis was performed using an FLA-2000 PhosphoImager (Fujifilm, Düsseldorf, Germany) and the Image Gauge 3.0 software (Fujifilm).
Immunoblotting
Nuclear lysates from Kasumi-1 cells (10 μg) were separated by sodium dodecyl sulfate–polyacrylamide gel electrophoresis and transferred onto polyvinylidenefluoride membranes. After blocking with Tris-buffered saline/0.1% Tween20 containing 10% fat-free milk, blots were incubated overnight in Tris-buffered saline/0.1% Tween20 containing 1% fat-free milk and 2.5 mg/L of an AML1-RHD antibody (Oncogene Research, Boston, MA). As secondary antibody, an anti–rabbit IgG horseradish peroxidase conjugate (1:5000 dilution; Amersham, Freiburg, Germany) was used as recommended by the manufacturer. Detection was performed with enhanced chemiluminescence plus (Amersham) using Hyperfilm ECL (Amersham).
Real-time RT-PCR analysis
RNA extraction, reverse transcription, and real-time reverse transcriptase–PCR (RT-PCR) were performed as previously described.32 The primers and probes for AML1/MTG8 (sense primer, 5′-AATCACAGTGGATGGGCCC -3′; antisense primer, 5′-TGCGTCTTCACATCCACAGG-3′; probe, 5′-FAM-CTGAGAAGCACTCCACAATGCCAGACT-TAMRA-3′), C/EBPα (sense primer, 5′-TTC AAC GAC GAG TTC CTG GC-3′; antisense primer, 5′-GGG TAG TCA AAG TCG CCG C-3′; probe, 5′-FAM-TGT TCC AGC ACA GCC GGC AG-TAMRA-3′), and GAPDH (sense primer, 5′-GAA GGT GAA GGT CGG AGT C -3′; antisense primer, 5′-GAA GAT GGT GAT GGG ATT TC-3′; probe, 5′-VIC-CCG ACT CTT GCC CTT CGA AC-TAMRA-3′) were designed with PRIMER-EXPRESS software (Applied Biosystems, Foster City, CA).
Cytokine stimulation of Kasumi-1 cells
Either TGFβ1 (R&D Systems, Wiesbaden, Germany) and vitamin D3 (Calbiochem, San Diego, CA) or granulocyte colony-stimulating factor (G-CSF) (Amgen, Thousand Oaks, CA) were added to the cells 2 days after electroporation in final concentrations of 1 nM, 100 nM, and 25 μg/L, respectively. After further incubation for 2 days, CD11b and CD14 expressions were monitored as markers for myeloid differentiation. Staining of the cells was performed either with a phycoerythrin (PE)–conjugated anti-CD11b antibody, an allophycocyanin (APC)–conjugated anti-CD14 antibody (both from BD Pharmingen), or with an anti–c-fms/CSF-1 antibody (Ab-2; rat IgG, Calbiochem, San Diego, CA) and a PE-conjugated goat–anti-rat antibody (Coulter Immunotech, Unterschleissheim, Germany) according to the manufacturer's instructions. 20 000 cells were analyzed per sample by flow cytometry (FACSCalibur, Becton Dickinson). Data analysis was performed with Cell Quest software (Becton Dickinson).
Colony assays
Half of the electroporated Kasumi-1 cells were treated with 100 nM vitamin D3 plus 1 nM TGFβ1 2 days after electroporation with siRNAs. After another 2 days, 10 000 cells were plated in 1 mL of semisolid medium (Iscove modified Dulbecco medium containing 20% FCS, 0.5625% methylcellulose, 2 mM glutamine, and 200 nM β-mercaptoethanol) in 35-mm dishes. Colonies containing more than 20 cells were counted 14 days after plating.
Results
Design of AML1/MTG8 siRNAs
Three different siRNAs targeted against the fusion site of the AML1/MTG8 mRNA, and several control siRNAs were used in our experiments. The sequence and target site of each siRNA is shown in Table 1. The siRNA siAGF1 is an all-ribo siRNA consisting of 2 strands of 21 nucleotides each in length. The double-strand contains 2 nucleotide–long 3′-overhangs on both termini. The siRNA siAGF2 contains only one 3′-overhang: extension of the antisense strand by 2 nucleotides creates a blunt end at the other terminus. siAM was designed according to Elbashir et al27 with 2 single-stranded 2′-deoxythymidines on each 3′-terminus. We used siAGF6 as mismatch control, which contains 2 centrally located A-to-U transversions in comparison to siAGF1. Unrelated control siRNAs were siK3 and siK4, targeted against neomycin phosphotransferase mRNA, and siGL2,27 directed against luciferase mRNA. In addition, to test for a possible transitive RNA interference effect, we included siAML1 in some experiments. This siRNA is targeted against the nonfused AML1 mRNA. It is homologous to AML1 in the region of the AML1/MTG8 fusion site. Thus, almost half of the sequence is identical to the AML1/MTG8 siRNAs. For uptake studies, we used a 5′–Cy3-labeled derivative of the luciferase siRNA siGL2.
Transfection efficiency and intracellular distribution of siRNAs
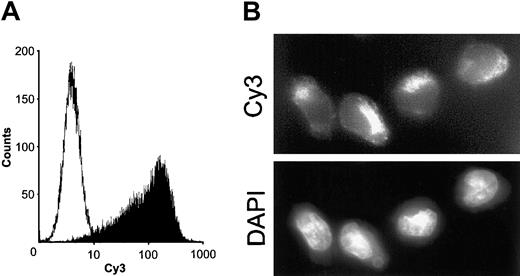
5′–Cy3-labeled siRNAs were delivered to Kasumi-1 cells by electroporation with a rectangular pulse. Almost all cells harbored Cy3 fluorescence 16 hours after electroporation, as judged by FACS analysis (Figure 1A). Fluorescence microscopy revealed a cytoplasmic localization of the fluorescent label, whereas the nuclear regions were only weakly stained (Figure 1B). Notably, this efficient siRNA uptake by Kasumi-1 cells was achieved under much milder conditions than used for plasmid DNA electroporation. As a consequence, we observed few dead cells.
Electroporation of Kasumi-1 cells with a fluorescently labeled siRNA.
(A) FACS analysis of electroporation efficiency. Kasumi-1 cells were electroporated as described in “Materials and methods.” Cells were analyzed by FACS 16 hours after electroporation. White peak, cells electroporated without siRNA; black peak, cells electroporated with 200 nM 5′Cy3-labeled siGL2. (B) Intracellular distribution of electroporated siRNAs. 16 hours after electroporation in the presence of 200 nM 5′Cy3-labeled siGL2, intracellular fluorescence was analyzed by fluorescence microscopy. Original magnification × 610. Upper panel, Cy3-labeled siRNA; lower panel, DAPI (diamidino-phenyl-indol) staining of cell nuclei.
AML1/MTG8 suppression by siRNAs
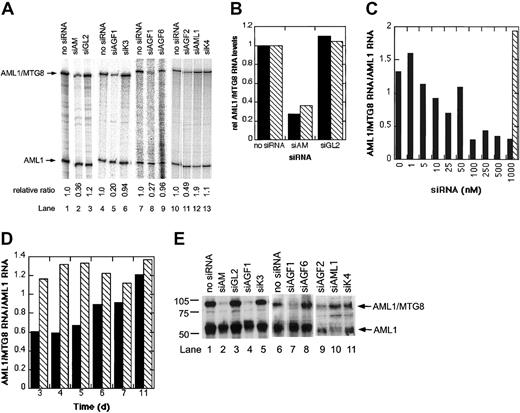
We electroporated Kasumi-1 cells with different siRNAs and assayed AML1/MTG8 and AML1 mRNA levels by RNase protection. The unrelated siRNAs siK3, siK4, and siGL2 and the mismatched siRNA siAGF6 were used as controls. All AML1/MTG8-specific siRNAs (siAGF1, siAGF2, and siAM) reduced the AML1/MTG8 mRNA levels by 50%-80% without exerting a major effect on AML1 mRNA levels (Figure 2A). Conversely, siAML1 reduced AML1 mRNA levels by only 50% without affecting AML1/MTG8. Neither AML1 nor AML1/MTG8 were affected by control siRNAs. To confirm these results, AML1/MTG8 was also quantified in correlation to the GAPDH housekeeping gene by real-time RT-PCR. With this analysis method, a reduction of AML1/MTG8 mRNA levels to less than 40% was observed upon treatment of Kasumi-1 cells with AML1/MTG8 siRNA (Figure 2B). Notably, electroporation of a second t(8;21)-positive cell line, SKNO-1, with this siRNA caused a similar decrease in AML1/MTG8 mRNA levels, whereas electroporation with a control siRNA had no effect on AML1/MTG8 expression (Figure 2B). Maximal inhibition of AML1/MTG8 expression was achieved with siRNA concentrations of 100 nM and higher (Figure 2C). The reduction of AML1/MTG8 mRNA levels lasted for 5 days (Figure 2D).
siRNA-mediated inhibition of AML1/MTG8 expression in t(8;21)-positive cells.
(A) Autoradiographs of RNase protection assays. 16 hours after electroporation in the presence of 200 nM siRNAs, cellular RNAs were isolated and analyzed by RNase protection assays. Arrows mark the protected fragments corresponding to AML1/MTG8 with 240 nucleotides in length and to AML1 with 100 nucleotides in length. The electroporated siRNAs are indicated at the top. The relative ratios between AML1/MTG8 and AML1 band intensities, as quantified by phosphoimaging, are shown at the bottom. Lanes 1-3, 4-6, 7-9, and 10-13 represent different experiments not performed at the same time. (B) Real-time RT-PCR analysis of AML1/MTG8 expression in siRNA-treated SKNO-1 and Kasumi-1 cells. Total RNA was isolated 16 hours after electroporation with 200 nM siRNA and analyzed by real-time RT-PCR as described in “Materials and methods.” AML1/MTG8 mRNA levels normalized by GAPDH mRNA levels are shown. Black bars (▪), SKNO-1 cells; hatched bars (▧), Kasumi-1 cells. For siRNA nomenclature and target sites, see Table 1. (C) Dose-dependent suppression of AML1/MTG8 by siAM. Kasumi-1 cells were electroporated with the indicated concentrations of siRNA. Cellular RNAs were isolated 16 hours after electroporation and analyzed by RNase protection assays. Black bars (▪), AML1/MTG8-specific siRNA siAM; hatched bar (▧), control siRNA siGL2. (D) Time course of siAM-mediated AML1/MTG8 suppression. Cellular RNAs were isolated at the indicated days after electroporation with 200 nM siRNA and analyzed by RNase protection assays. Black bars (▪), siAM; hatched bars (▧), siGL2. (E) Effects of siRNAs on AML1/MTG8 and AML1 protein levels. Nuclear extracts were prepared either 3 days (lanes 1-5) or 4 days (lanes 6-11) after electroporation with 200 nM siRNA and analyzed by immunoblotting. The electroporated siRNAs are indicated on top. Arrows on the right mark AML1/MTG8 and AML1 protein bands. Markers are shown on the left. Lanes 1-5, 6-8, and 9-11 represent different experiments not performed at the same time. For siRNA nomenclature and target sites, see Table 1.
The siRNA-dependent reduction of AML1/MTG8 or AML1 mRNA was paralleled by a major decrease of the corresponding protein. Kasumi-1 cells electroporated with siAGF1, siAGF2, or siAM contained less AML1/MTG8 protein, and cells treated with siAML1 contained less AML1 protein than cells electroporated with control siRNAs or without any siRNA (Figure2E). In conclusion, 3 different siRNAs inhibited AML1/MTG8 expression to similar extents. Furthermore, both AML1/MTG8 and AML1 can be specifically targeted with siRNAs in an exclusive manner.
AML1/MTG8 suppression affects cell shape
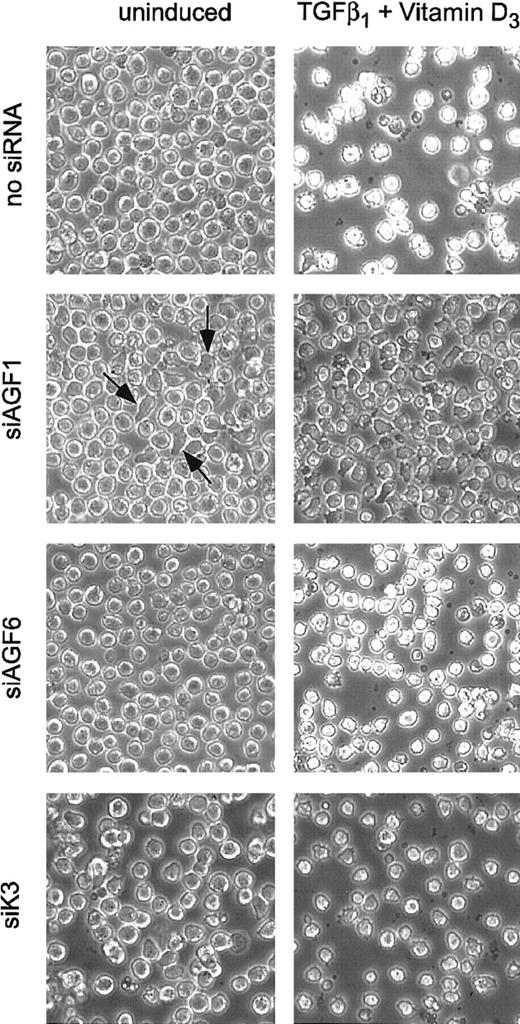
Electroporation of Kasumi-1 cells with AML1/MTG8 siRNAs resulted in changes in cell shape. Whereas electroporation without siRNA or with control siRNAs had no effect on cell shape, cells with an irregular or cylindrical shape became visible within 2 to 3 days after electroporation with AML1/MTG8 siRNAs (Figure3). The fraction of irregularly shaped cells increased significantly when AML1/MTG8 siRNA delivery was followed by addition of TGFβ1 and vitamin D3. In this case, the majority of the cells showed an irregular shape. In contrast, treatment with TGFβ1 and vitamin D3in the presence of siRNAs yielded only marginal changes in cell shape.
Morphology of siRNA-treated Kasumi-1 cells.
Cells were analyzed by phase-contrast microscopy 4 days after electroporation with 100 nM of the indicated siRNAs. Left column, uninduced cells; right column, cells induced with TGFβ1and vitamin D3. siRNAs are indicated on the left. The original magnification was × 100. Some irregularly shaped cells obtained after electroporation with siAGF1 are marked with arrows. For siRNA nomenclature and target sites, see Table 1.
AML1/MTG8 suppression supports differentiation of t(8;21)-positive cells
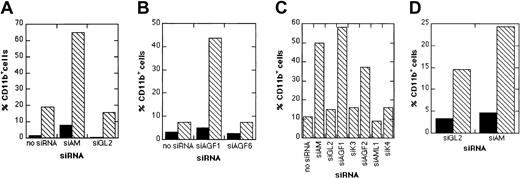
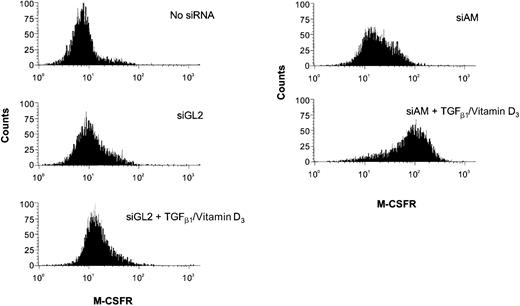
Next, we examined whether depletion of AML1/MTG8 had an influence on the differentiation capacity of Kasumi-1 cells. Kasumi-1 cells electroporated either with AML1/MTG8 siRNAs or with control siRNAs were treated with a combination of TGFβ1 and vitamin D3. As markers for myeloid differentiation, the expression of CD11b and CD14 was monitored via FACS analysis. Electroporation without siRNAs followed by addition of TGFβ1 and vitamin D3 increased the number of CD11b-positive cells from less than 5% to maximal 20% (Figure4). Neither of the control siRNAs, including the mismatch control siAGF6 and the AML1-specific siRNA siAML1, enhanced CD11b expression in comparison to the control without siRNA (Figure 4). Application of AML1/MTG8 siRNAs alone caused a slight increase in the percentage of cells positive for CD11b or M-CSF receptor. Electroporation with AML1/MTG8 siRNAs prior to addition of TGFβ1/vitamin D3 resulted in 40%-60% of CD11b-positive cells (Figure 4A-C) and a substantial increase in the expression of the M-CSF receptor with more than 90% positive cells (Figure 5), indicating a supporting effect of AML1/MTG8 siRNAs on the myelomonocytic differentiation of Kasumi-1 cells. The up-regulation of CD11b correlated with AML1/MTG8 depletion in that the weaker inhibition of AML1/MTG8 expression caused by siAGF2 (Figure 2A,D) was paralleled by a smaller increase in CD11b-positive cells (Figure 4C). Notably, expression of AML1/MTG8 was still inhibited at the time point of FACS analysis independent of the treatment with TGFβ1/vitamin D3 (Figure 2D). Electroporation of SKNO-1 cells with siAM followed by TGFβ1/vitamin D3 induction also yielded a nearly 2-fold increase in CD11b expression (Figure 4D), arguing against a Kasumi-1–specific effect of AML1/MTG8 siRNAs. These data suggest that AML1/MTG8 interferes with both cytokine-induced up-regulation of CD11b and M-CSF receptor and, thus, with myelomonocytic differentiation. This interference can be sequence-specifically abrogated by siRNA-mediated suppression of AML1/MTG8.
siRNA influence on TGFβ/vitamin D3–induced CD11b expression.
(A) Graphical presentation of siAM-dependent CD11b expression in Kasumi-1 cells. Black bars (▪), no TGFβ/vitamin D3treatment; hatched bars (▧), treatment with TGFβ1/vitamin D3. (B) Graphical presentation of siAGF1-dependent CD11b expression in Kasumi-1 cells. Black bars (▪), no TGFβ/vitamin D3 treatment; hatched bars (▧), treatment with TGFβ1/vitamin D3. (C) Effect of AML1/MTG8 and AML1 siRNAs on CD11b expression in Kasumi-1 cells. The graph shows the percentage of CD11b-positive Kasumi-1 cells after electroporation with the indicated siRNA followed by addition of TGFβ1/vitamin D3. (D) Graphical presentation of siAM-dependent CD11b expression in SKNO-1 cells. Black bars (▪), no TGFβ1/vitamin D3 treatment; hatched bars (▧), treatment with TGFβ1/vitamin D3. In each experiment, cells were electroporated with 200 nM of the indicated siRNA. For siRNA nomenclature and target sites, see Table 1.
siRNA influence on TGFβ/vitamin D3–induced M-CSF receptor expression.
The FACS histogram plots show M-CSF receptor presentation on Kasumi-1 cells after electroporation with 200 nM siRNA and TGFβ1/vitamin D3 treatment. The siRNAs and the induction treatment are indicated in the graph. For siRNA nomenclature and target sites, see Table 1.
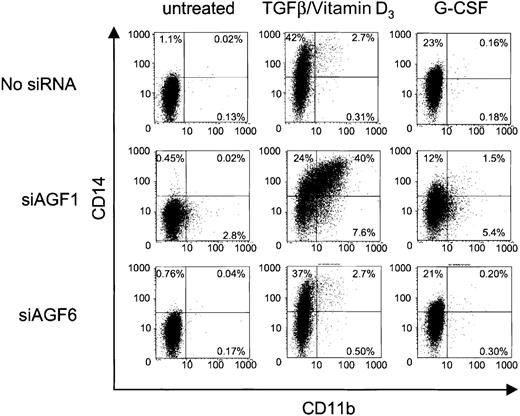
Myelomonocytic differentiation is accompanied by surface display of both CD11b and CD14. We examined a possible coexpression of these 2 markers on siRNA-treated Kasumi-1 cells. As in previous experiments, siAGF1 alone caused an increase in CD11b-positive cells, which was not seen with the mismatch control siRNA siAGF6 (Figure6). Neither siRNA caused an increase in CD14 expression when compared to the control cells without siRNAs. When treated with siAGF1 and TGFβ1/vitamin D3, approximately 40% of the cells expressed both CD11b and CD14, indicating myelomonocytic differentiation (Figure 6). Replacement of siAGF1 by control siRNAs, or omission of siRNAs, yielded less than 5% of double-positive cells. Interestingly, even without siRNA-mediated AML1/MTG8 depletion, addition of TGFβ1 and vitamin D3 caused a 40-fold increase in CD14 surface display.
siRNA influence on cytokine-induced CD11b and CD14 expression.
The FACS dot plots show CD11b and CD14 presentation on Kasumi-1 cells after electroporation with 100 nM siRNA and cytokine treatment. The siRNAs are indicated on the left, the induction treatment is indicated on top. The percentage of cells is given for each quadrant of the plots. X-axis, CD11b expression; y-axis, CD14 expression. For siRNA nomenclature and target sites, see Table 1.
We also examined the effects of G-CSF on the differentiation of siRNA-treated Kasumi-1 cells. On the one hand, when added to cells electroporated without siRNA or with the mismatch control siAGF6, G-CSF caused a 20-fold increase in CD14 expression (Figure 6). CD11b expression was not elevated by G-CSF. On the other hand, delivery of the AML1/MTG8 siRNA siAGF1 followed by the addition of G-CSF yielded a lower increase in CD14 expression compared to the 2 controls, but a 2-fold increase in CD11b expression. The fraction of CD11b/CD14 double-positive cells also was increased upon G-CSF treatment, but not to such an extent as obtained with TGFβ1 and vitamin D3 (Figure 6). Particularly, the fraction of CD11b/CD14 double-positive cells is much smaller upon treatment with AML1/MTG8-specific siRNAs plus G-CSF than that obtained with AML1/MTG8-specific siRNAs plus TGFβ1/vitamin D3.
Induction of C/EBPα expression by AML1/MTG8 siRNAs
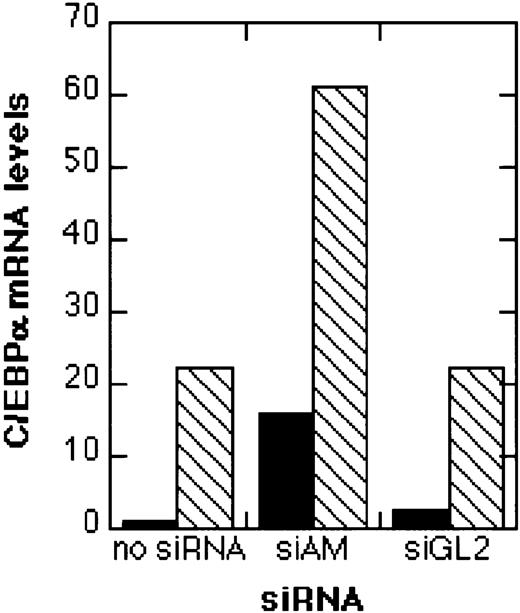
Since induction of differentiation should result also in an induction of marker genes for differentiation, we analyzed the effects of siRNAs on the expression of the transcription factor C/EBPα, which is directly down-regulated by AML1/MTG8. The addition of TGFβ1/vitamin D3 with or without preceding treatment with the control siRNA siGL2 caused a 20-fold increase in C/EBPα transcript levels (Figure 7). When AML1/MTG8 was depleted by siAM, a 15-fold induction of C/EBPα mRNA was observed. Combining siAM with TGFβ1/vitamin D3 resulted in a 60-fold induction of C/EBPα expression. Therefore, siRNA-mediated AML1/MTG8 depletion results in the induction of the myeloid differentiation marker gene C/EBPα, thereby mirroring the induction of CD11b surface display by AML1/MTG8 siRNAs.
Real-time RT-PCR analysis of C/EBPα expression.
Total RNA was isolated 4 days after electroporation with 200 nM siRNA and analyzed by real-time RT-PCR as described in “Materials and methods.” The relative C/EBPα mRNA levels in relation to GAPDH mRNA levels are shown. Black bars (▪), no TGFβ1/vitamin D3 treatment; hatched bars (▧), treatment with TGFβ1 and vitamin D3. For siRNA nomenclature and target sites, see Table 1.
AML1/MTG8 siRNAs decrease the clonogenic growth of Kasumi-1
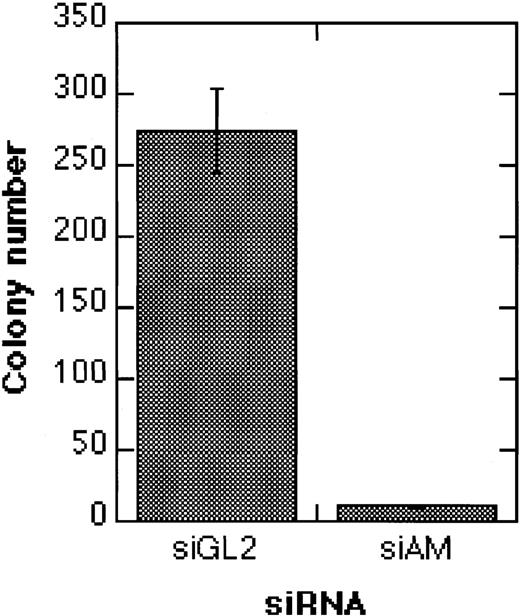
An important question is whether siRNA-mediated AML1/MTG8 depletion can lead to irreversible effects, or whether, due to an only transient inhibition of AML1/MTG8, cells revert to the leukemic phenotype. To address this question, we treated Kasumi-1 cells with siRNAs, followed by the addition of TGFβ1 and vitamin D3. In comparison to the control siRNA siGL2, electroporation with the AML1/MTG8 siRNA siAM severely diminished colony formation of Kasumi-1 cells (Figure8). These data indicate that transient suppression of AML1/MTG8 by siRNAs may lead to a permanent inhibition of cell proliferation in Kasumi-1 cells when combined with inducers of myeloid differentiation.
Effects of siRNAs on the clonogenicity of Kasumi-1 cells.
The graph shows the colony formation of Kasumi-1 cells after electroporation with 200 nM siRNA and TGFβ1/vitamin D3 treatment. Colonies were counted 14 days after electroporation. Error bars indicate standard deviations. For siRNA nomenclature and target sites, see Table 1.
Discussion
Small interfering RNAs are promising tools for the analysis of gene function and the inhibition of pathogenic gene expression. We show here (1) that the leukemic AML1/MTG8 fusion mRNA can be specifically targeted by siRNAs without interfering with the levels of the wild-type AML1 mRNA, and (2) that this specific AML1/MTG8 reduction leads to an increased susceptibility of both Kasumi-1 and SKNO-1 cells toward cytokine-driven induction of myeloid differentiation.
The first reports on the application of siRNAs in mammalian cell culture provided evidence for their high specificity toward their target RNA sequences.27,28 However, if siRNAs caused transitive RNA interference in mammalian cells,26 an siRNA targeted against the fusion site of, for example, the AML1/MTG8 mRNA would also reduce the levels of the wild-type AML1 mRNA. Our data argue against transitive RNA interference as the major mechanism of siRNA-mediated inhibition of gene expression, at least in Kasumi-1 cells. In this system, siRNAs targeted against either AML1/MTG8 or AML1 mRNA reduced only the levels of their respective target RNA and protein, but not those of the corresponding partially homologous mRNA. Similar results have been obtained with siRNAs against BCR-ABL.33,34 Moreover, blocking the 3′-hydroxyl group of the siRNA antisense strand did not prevent the inhibition of gene expression in HaCaT and Hela cells.35 36 These data suggest that in many, if not all, mammalian cell lines, siRNAs guide the cleavage of their complementary target RNA sequence and do not serve as primers in a degradative PCR mechanism.
Recently, several molecular targets of AML1/MTG8 have been identified. One target is the TGFβ signaling pathway, which is inhibited by binding of AML1/MTG8 to the TGFβ-activated transcription factor SMAD3.8 This may lead to a block in TGFβ/vitamin D3-mediated myeloid differentiation. Another molecular target is the transcription factor C/EBPα, which is essential for granulocytic development.10 Its expression is particularly high in CD11b-positive bone marrow cells.37 As with SMAD3, AML1/MTG8 binds directly to C/EBPα, thereby preventing the expression of C/EBPα target genes, including the C/EBPΑ gene itself.10 Our results confirm these data in that the specific depletion of AML1/MTG8 in Kasumi-1 cells by siRNAs led to an approximately 15-fold increase in C/EBPα-mRNA expression, whereas electroporation with control siRNAs had no effect. Moreover, the application of AML1/MTG8 siRNAs followed by stimulation with TGFβ1/vitamin D3 caused a higher expression of C/EBPα and CD11b in comparison to TGFβ1/vitamin D3 alone. This effect is comparable to that observed after overexpression of C/EBPα in Kasumi-1 cells.9,10 In addition, the application of AML1/MTG8 siRNAs followed by stimulation with TGFβ1/vitamin D3 caused a substantial up-regulation of the M-CSF receptor, which is a direct target gene of AML1 and C/EBP members.38 These data do not support previous findings, where AML1/MTG8 and AML1 synergistically activated the promotor of the M-CSF receptor gene in transient transfection assays.39 The reasons for this discrepancy are unclear. One has to take into consideration, however, that these data are derived from different assay systems.
The combination of G-CSF and siAM had a much weaker effect on the phenotype of the Kasumi-1 cells. G-CSF alone induced only CD14 expression. In combination with AML1/MTG8 siRNAs, the numbers of CD11b+ and CD11b+/CD14+ cells slightly increased. The reasons for these differences between G-CSF and TGFβ1/vitamin D3 are unclear. One might speculate that AML1/MTG8 preferentially blocks the differentiation pathway that is activated by TGFβ1/vitamin D3and, to a lower extent, that of G-CSF.
Application of AML1/MTG8 siRNAs followed by addition of TGFβ1/vitamin D3 reduced the clonogenic potential of Kasumi-1 cells and allows a biologic inducer to trigger myeloid differentiation in these cells. Importantly, differentiation induction was possible despite the transient effect of our siRNAs. Thus, this approach appears suitable to analyze the role of AML1/MTG8 in leukemic gene expression and may provide new therapeutic approaches for t(8;21)-associated leukemias.
The authors thank Thomas Tuschl for helpful initial discussion, Stefan Nagel (German Collection of Microorganisms and Cell Cultures [DSMZ], Braunschweig, Germany) for providing SKNO-1 cells, Lisa Neumann for carefully reading the manuscript, and Kerstin Görlich and Dagmar Reile for excellent technical assistance.
Prepublished online as Blood First Edition Paper, December 12, 2002; DOI 10.1182/blood-2002-05-1589.
Supported in part by a grant from the Deutsche Krebshilfe (O.H., G.H., A.N. (10-1217 He1) and a grant from the Deutsche José-Carreras-Leukämie-Stiftung e.V. (J.K.) (DJCLS-R01/08).
P.H., M.J., and H.-P.V. are employed by a company (Ribopharma AG) whose potential product was studied in the present work.
The publication costs of this article were defrayed in part by page charge payment. Therefore, and solely to indicate this fact, this article is hereby marked “advertisement” in accordance with 18 U.S.C. section 1734.
References
Author notes
Olaf Heidenreich, Department of Molecular Biology, Institute for Cell Biology, University of Tübingen, Auf der Morgenstelle 15, 72076 Tübingen, Germany; e-mail:olaf.heidenreich@uni-tuebingen.de.

This feature is available to Subscribers Only
Sign In or Create an Account Close Modal