Abstract
Severe congenital neutropenia (SCN) is a hematopoietic disorder characterized by neutropenia in peripheral blood and maturation arrest of neutrophil precursors in bone marrow. Patients with SCN may evolve to have myelodysplastic syndrome or acute myelocytic leukemia. In approximately 20% of SCN cases, a truncation mutation is found in the cytoplasmic region of the granulocyte colony-stimulating factor receptor (G-CSFR). We then generated mice carrying murine wild-type G-CSFR and its mutants equivalent to truncations at amino acids 718 and 731 in human G-CSFR, those were reported to be related to leukemic transformation of SCN. Although numbers of peripheral white blood cells, red blood cells, and platelets did not differ among mutant and wild-type G-CSFR transgenic (Tg) mice, both of the mutant receptor Tg mice had one third of peripheral neutrophil cell counts compared with wild-type receptor Tg mice. The mutant receptor Tg mice also showed impaired resistance to the infection with Staphylococcus aureus. Moreover, bone marrow of these Tg mice had an increased percentage of immature myeloid cells, a feature of SCN. This maturation arrest was also observed in in vitro cultures of bone marrow cells of truncated G-CSFR Tg mice under G-CSF stimulation. In addition, clonal culture of bone marrow cells of the truncated G-CSFR Tg mice showed the hypersensitivity to G-CSF in myeloid progenitors. Our Tg mice may be useful in the analysis of the role of truncated G-CSFR in SCN pathobiology.
Introduction
Severe congenital neutropenia (SCN, Kostmann syndrome) is characterized by persistent neutropenia and bone marrow morphology that suggests maturation arrest of neutrophil precursors at the promyelocytic or myelocytic stage.1 Many patients with SCN die from infectious diseases in their early life.2 The application of granulocyte colony-stimulating factor (G-CSF) enables long time survival, but approximately 10% to 15% of the patients develop secondary myelodysplastic syndrome (MDS) and acute myelocytic leukemia (AML).3-5 This development suggests that an impairment in the signaling pathway through the G-CSF receptor (G-CSFR) has some role in SCN.
The G-CSFR is a member of the cytokine receptor superfamily. The receptor contains extracellular, transmembrane, and cytoplasmic domains but lacks intrinsic tyrosine kinase activity. This single polypeptide forms homo-oligomeric complexes on binding to ligand and activates cytoplasmic tyrosine kinase.6 Signal transduction pathways that involve Janus tyrosine kinases (Jak1, Jak2, and Tyk2) and signal transducer and activator of transcription proteins (STATs 1, 3, and 5) are linked to the G-CSFR.7 Mutations have been found in the gene encoding G-CSFR in some patients with SCN.2,4Approximately 20% of SCN cases show similar types of molecular defects that introduce premature stop codons leading to a truncation of G-CSFR. So far, 5 types of truncation mutations have been found, which are located between nucleotides 2384 and 2429 (amino acids 716 and 731, respectively); nucleotide and amino acid numbers are based on the report by Fukunaga et al.8 Two of them, 718 and 731 truncation mutants, were reported to be related to the transformation to MDS/AML in SCN.2,4 9 These mutations are point mutations that result in the cytoplasmic truncation of the receptor.
A number of studies on the role of the truncated G-CSFR in SCN have been reported. McLemore et al10 generated a mouse carrying a targeted form of these truncation mutations, using homologous recombination in embryonic stem cells. The targeted mice had normal levels of circulating neutrophils and no evidence of maturation arrest of neutrophil precursors. Hermans et al11 simultaneously reported mice generated for the mutation in the same way as McLemore et al,10 but their mice had reduced numbers of neutrophils in peripheral blood. Furthermore, Bernard et al12 described that these truncation mutations were detected only in a minor percentage of transcripts in patients with SCN, and they reported a patient whose mutation spontaneously disappeared, then concluded that this gene abnormality has no role in the etiology of this disorder and is a bystander phenomenon. Thus, there has been some controversy over the involvement of truncation mutations in the pathogenesis of SCN.
To address this issue, we made 2 murine G-CSFR (mG-CSFR) truncation-mutant genes equivalent to the human 718 and 731 truncations. These fragments were inserted into the expression vector LD2 that has a promoter of the major histocompatibility complex (MHC) class I H2Ld gene.13 Both types of truncation-mutant receptor-transgenic (Tg) mice had a decreased absolute neutrophil count in the peripheral blood as compared with the mice having wild-type receptors, resulting in the impaired ability to resist bacterial infection, and the bone marrow of these mutant receptor Tg mice showed an increased percentage of immature myeloid cells. These results indicate that the truncation-mutant receptor has some effect on the number of mature neutrophils. Our Tg mice may provide a good model for elucidating the role of these truncation mutations in SCN and its leukemic transformation.
Materials and methods
Constructions of mG-CSFR cDNA and the generation of Tg mice
mG-CSFR cDNA was a generous gift from Dr Shigekazu Nagata (Osaka University Medical School, Japan). Two types of truncated mG-CSFR cDNA, 717 and 730 amino acid truncations equivalent to human 718 and 731 truncations, respectively, were generated using a polymerase chain reaction (PCR) method (Figure 1), and each was inserted into theSalI/SpeI site of pLG1 expression vector that has a 1.4-kb mouse MHC L-locus gene (H2-Ld) promoter.14 The full-length of wild-type mG-CSFR cDNA was inserted into the same vector using SalI and SpeI sites. The pLd-G-CSFR plasmids were digested with restriction enzymes,SphI and XhoI for truncated receptors andSphI and NruI for wild-type receptor, to remove the vector portion. These fragments containingH2-Ld–wild-type G-CSFR or –truncated receptors were separated from other fragments in low-melting agarose gel (Sea Plaque; FMC Bio Product, Rockland, ME) and purified using a QIAEX II (QIAGEN, Hilden, Germany) according to the manufacturer's instruction. Transgenes were delivered by standard oocyte injection using C57BL/6 strain.15 The mice were maintained in microisolator cages in an environmentally controlled clean room with 12-hour light-dark cycles under specific pathogen-free conditions. Tg mice were screened for successful integration of the G-CSFR by PCR analysis of tail DNA. Mouse tail tip DNA was prepared by the removal of 1 cm tail, which was incubated in 0.5 mL lysis buffer [50 mM Tris (tris(hydroxymethyl)aminomethane)–HCl, pH 7.6, 0.1 mM EDTA (ethylenediaminetetraacetic acid), 1% sodium dodecyl sulfate, and 0.1 mg/mL proteinase K] at 55°C for 16 hours. The lysate was extracted with an equal volume of phenol and chloroform. PCR was performed using 1 μg total genomic DNA, 20 pmol primers, and 2.5 U Taq DNA polymerase (Perkin Elmer Cetus, Foster City, CA) for 30 cycles (94°C for 40 seconds, 63°C for 40 seconds, and 72°C for 40 seconds), followed by 72°C for 5 minutes using a DNA thermal cycler (Gene Amp, PCR system model 2400; Perkin Elmer). The forward primer (5′-TCATGTTATATGGAGGGGGC) was in the H2-Ld promoter gene, and the reverse primer (5′-GAAGATCAGGGTAACTCCAG) was in the G-CSFR gene. Twenty microliters of the amplified solution was electrophoresed in a 1.0% agarose gel in Tris borate EDTA (TBE) buffer and stained with 0.5 μg/mL ethidium bromide. Founder mice were bred with C57BL/6 mice to obtain progeny. In most experiments, Tg and control mice (negative littermates or age-matched non-Tg mice) were used at 6 to 12 weeks of age.
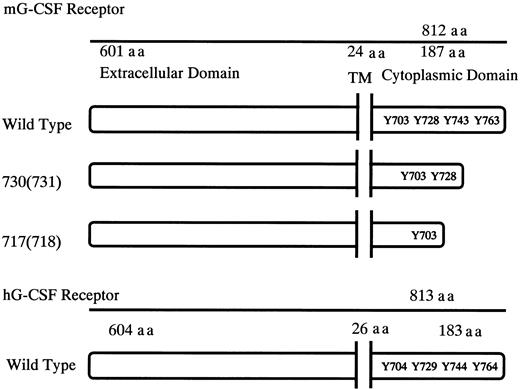
Schematic diagrams for the structure of murine G-CSFR, its mutants, and human G-CSFR.
Murine and human G-CSFR proteins are 72.5% homologous at the nucleotide level and 62.5% homologous at the amino acid level. TM indicates transmembrane domain; Y, tyrosine residues; and aa, amino acid.
Schematic diagrams for the structure of murine G-CSFR, its mutants, and human G-CSFR.
Murine and human G-CSFR proteins are 72.5% homologous at the nucleotide level and 62.5% homologous at the amino acid level. TM indicates transmembrane domain; Y, tyrosine residues; and aa, amino acid.
Blood cell analysis
Peripheral blood cells from 6-week-old healthy C57BL/6 mice, Tg mice, and their normal littermates were collected from the retroorbital venous plexus in glass tubes. Numbers of total white blood cells, red blood cells, and platelets and the hemoglobin concentration were determined by hemocytocounter (Cel Taq α; Nihon Kouden, Tokyo, Japan). The absolute number of peripheral blood neutrophils was calculated from the total white blood cell number, and the proportion of neutrophils that was determined on glass slide samples stained with May-Grünwald-Giemsa. Bone marrow cells from 8-week-old mice were flushed from femurs into a minimum essential medium (α-MEM; Flow Laboratories, Rockville, MD) with 2% fetal bovine serum (FBS; Hyclone, Logan, UT) using 21-gauge needles. Spleen cells were obtained by rubbing between 2 pieces of frosted glass and repeated pipetting. Cells were then passed through a 70-μm nylon cell strainer (no. 2350; Becton Dickinson Labware, Franklin Lakes, NJ). These cells were counted manually, cytocentrifuged with Cytospin 2 (Shandon, Pittsburgh, PA), and closely examined under a light microscope after staining with May-Grünwald-Giemsa for differential counting. By analysis on the cytospin samples, myeloid cells were classified into late myeloid cells, such as mature neutrophils with a banded or segmented nucleus, and early myeloid cells, such as myeloblasts, promyelocytes, myelocytes, and metamyelocytes.
To assess surface G-CSFR transgene product expression, peripheral blood mononuclear cells were incubated at 4°C for 1 hour with phycoerythrin-conjugated human G-CSF (hG-CSF) (Genzyme/Techne, Cambridge, MA), followed by flow cytometric analysis (Becton Dickinson, Mountain View, CA).
Bacterial infection
Staphylococcus aureus (S aureus) 18Z was grown in Luria-Bertani broth at 37°C to a late log phase, washed with phosphate-buffered saline (PBS), and stored in aliquots at −80°C until used. Stock suspension was thawed and diluted serially with PBS containing 10% (vol/vol) glycerol, then the number of viable bacteria was determined by plating on nutrient agar plates and enumerating the colony-forming unit (CFU) after overnight cultivation at 37°C. Mice were infected intraperitoneally with 1.9 × 10⁸S aureus. The dose of infection was based on the data of preliminary experiments using numbers of control mice. Survival of mice was recorded for 8 days after the infection, and the percentage of survival was calculated. The difference of survival rates among the age- and weight-matched groups was evaluated by the Kaplan-Meier log-rank test, and P < .05 was considered significant.
Clonal cell culture
Clonal cell culture was performed in triplicate as described.16 Briefly, 1 mL culture mixture containing bone marrow cells (2.5 × 10⁴ cells), α-MEM, 1.2% methylcellulose (Shinetsu Chemical, Tokyo, Japan), 30% FBS, 1% deionized fraction V bovine serum albumin (BSA; Sigma Chemical, St Louis, MO), 10−4 mol mercaptoethanol (Eastman Organic Chemicals, Rochester, NY), and various concentrations hG-CSF or a set of hematopoietic growth factors (mouse interleukin-3 [mIL-3], human erythropoietin [hEPO], human thrombopoietin [hTPO], mouse stem cell factor [mSCF], and hIL-6) was plated in each of 35-mm suspension culture dishes (no. 171 099; Nunc, Naperville, IL) and incubated at 37°C in a humidified atmosphere flushed with 5% CO2 in air. Except for megakaryocytic colonies, cell aggregates consisting of more than 50 cells were scored as a colony. Colony types were determined on days 10 through 14 of incubation by in situ observation using an inverted microscope, according to the criteria of Nakahata and Ogawa.17,18 Megakaryocytic colonies were scored as such when they had at least 4 megakaryocytes.14 To assess the accuracy of in situ identification of colonies, individual colonies were removed with an Eppendorf micropipette under direct microscopic visualization, spread on glass slides using a cytocentrifuge, and stained with May-Grünwald-Giemsa or acetylcholine esterase for megakaryocytes.
Recombinant hG-CSF, mIL-3, hEPO, and hTPO were kindly provided by Kirin Brewery (Tokyo, Japan). mSCF was a generous gift from Amgen (Thousand Oaks, CA). hIL-6 was generously provided by Tosoh (Kanagawa, Japan). All cytokines were pure recombinant molecules and were used at concentrations that induced an optimal response in methylcellulose culture of murine hematopoietic cells. These concentrations are 100 ng/mL for mSCF, 10 ng/mL for mIL-3, 100 ng/mL for hIL-6, 2 U/mL for hEPO, and 10 ng/mL for hTPO.
Suspension culture of bone marrow cells
Bone marrow cells were incubated at an initial density of 5 × 10⁵ cells/mL in 10% FBS-containing RPMI 1640 (Nikken Biomedical Lab, Kyoto, Japan) supplemented with or without 20 ng/mL G-CSF for 7 days. Viable cells were counted on the basis of the trypan blue dye exclusion method. To analyze morphologic features, cells were spread on glass slides and stained with May-Grünwald-Giemsa.
Results
Expression of G-CSFR in Tg mice
The murine and human G-CSFRs consist of a single chain polypeptide with 812 and 813 amino acids, respectively (Figure1). The structure of hG-CSFR shows significant homology to that of mG-CSFR with 72.5% identity at the nucleotide level and 62.5% at the amino acid level.19 To investigate the role of G-CSFR mutations in SCN, we made murine G-CSFR 717 and 730 truncation-mutant genes, equivalent to human 718 and 731 truncations, respectively, which were reported to be related to leukemic transformation of SCN, and we transgened them by oocyte injection using C57BL/6 mice. By PCR screening of tail tip genomic DNA, 3 founder offspring for the wild-type transgene, 7 for the 730 truncation, and 2 for the 717 truncation were found.
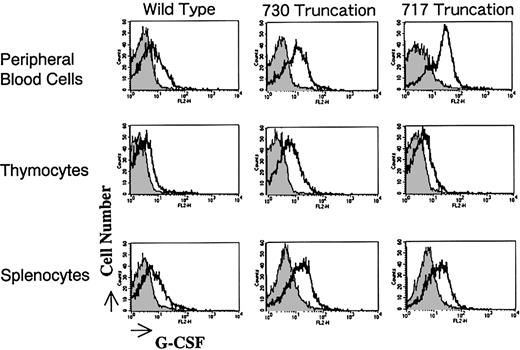
Surface expression of the G-CSFR transgene product in Tg mice was analyzed by flow cytometry. Mononuclear cells of peripheral blood, thymus, and spleen of the mice were gated and analyzed for their expression of G-CSFR through the binding to hG-CSF conjugated with phycoerythrin. As shown in Figure 2, offspring expressing the receptor most intensely was selected. Expression levels in peripheral blood mononuclear cells, thymocytes, and splenocytes were almost the same among transfectants. Normal littermates served as negative controls in all experiments. Expression of G-CSFR was practically of the same level in male and female Tg mice (data not shown).
Expression of G-CSFR on mononuclear cells derived from Tg mice.
Mononuclear cells from peripheral blood, thymocytes, and splenocytes of Tg mice carrying wild-type and mutant G-CSFR with a truncation of 730 or 717 amino acids were incubated with phycoerythrin-conjugated hG-CSF and analyzed by flow cytometry.
Peripheral blood analysis of Tg mice
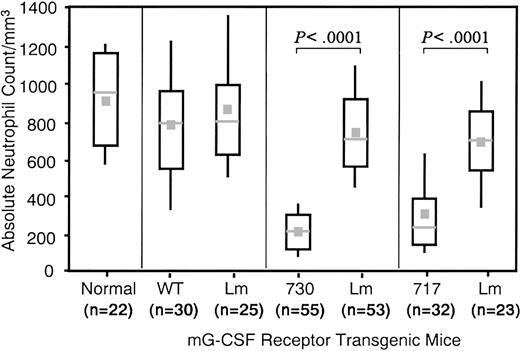
All 3 types of Tg mice had no significant difference in numbers of white blood cells, red blood cells, and platelets and similar levels of hemoglobin compared with their littermates or normal mice (data not shown). However, although no difference was found in peripheral neutrophil numbers between wild-type receptor Tg mice and their littermates, Tg mice expressing mutant 717 or 730 receptors had one third of the number of neutrophils of the respective littermates, although both littermates showed numbers comparable to normal mice (Figure 3).
Box-and-Whisker plots of peripheral neutrophil counts.
The top of each box denotes the third quartile and the bottom of each box denotes the first quartile. The location of the midpoint of the distribution is indicated with a horizontal line in each box. The median is indicated with a gray square. The top whisker denotes the highest 10% and the bottom whisker the lowest 10%. The Mann-Whitney U test was used for the statistical analysis. WT indicates wild-type G-CSFR Tg mice; 730 and 717, Tg mice expressing mutant G-CSFR with a 730 and 717 amino acid truncation, respectively; and Lm, littermates.
Bone marrow analysis of Tg mice
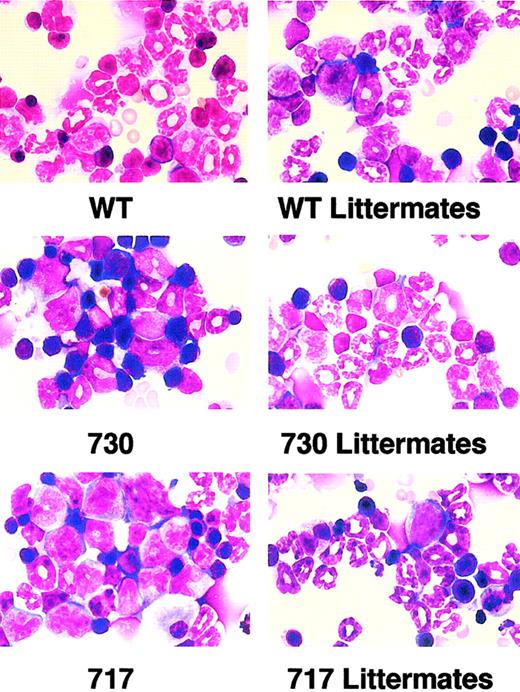
To elucidate the reason for the reduced neutrophils in peripheral blood of truncation receptor Tg mice, we then obtained nucleated cell counts and myelograms of bone marrow. Nucleated cell counts and the myeloid/erythroid cell (M/E) ratio had similar values in Tg mice and their littermates (Table 1). In myelogram analysis, however, percentages of early myeloid cells, such as myeloblasts, promyelocytes, myelocytes, and metamyelocytes, increased in truncation-mutant Tg mice compared with their littermates, whereas there was no difference in the distribution of myeloid cells at each stage between wild-type G-CSFR Tg mice and their littermates (Table 1; Figure 4). Thus, Tg mice expressing truncated G-CSFR showed maturation arrest at the promyelocyte to metamyelocyte stage in bone marrow, which resembles SCN, although the exclusive accumulation of promyelocytes was not observed.
Bone marrow analysis of transgenic mice
| . | Wild type . | 730 truncation . | 717 truncation . | |||
|---|---|---|---|---|---|---|
| . | Tg, n = 3 . | Control, n = 3 . | Tg, n = 3 . | Control, n = 3 . | Tg, n = 3 . | Control, n = 3 . |
| NCC, 104/femur | 2867 ± 144 | 2654 ± 264 | 2579 ± 844 | 2433 ± 814 | 2840 ± 616 | 2815 ± 1113 |
| M/E ratio | 1.27 ± 0.09 | 1.50 ± 0.38 | 1.17 ± 0.21 | 1.40 ± 0.11 | 1.40 ± 0.75 | 1.51 ± 0.20 |
| Early myeloid, % | 15.3 ± 2.43 | 17.43 ± 8.41 | 32.33 ± 3.16 | 19.2 ± 1.22 | 31.43 ± 1.26 | 19.87 ± 9.05 |
| Late myeloid, % | 33.57 ± 8.29 | 37.23 ± 1.66 | 14.87 ± 2.98 | 35.47 ± 2.0 | 10.77 ± 1.66 | 37.9 ± 8.5 |
| Early/late ratio | 0.49 ± 0.22 | 0.47 ± 0.24 | 2.21 ± 0.33 | 0.54 ± 0.02 | 2.98 ± 0.59 | 0.57 ± 0.35 |
Values indicate means ± SD; Early myeloid, immature myeloid cells at the myeloblast to metamyelocyte stage; Late myeloid, mature neutrophils with stab or segmented nucleus; NCC, nucleated cell count; M/E ratio, myeloid cells/erythroid cells ratio; and Early/late ratio, ratio of early myeloid cells to late myeloid cells.
Morphology of bone marrow cells in Tg mice.
Myeloid cells at various stages of differentiation were observed in bone marrow of wild-type (WT) G-CSFR Tg mice and littermates. In contrast, immature myeloid cells were prominent in truncation-mutant Tg mouse marrow. Original magnification × 1000; May-Grünwald-Giemsa stain.
Bacterial infection
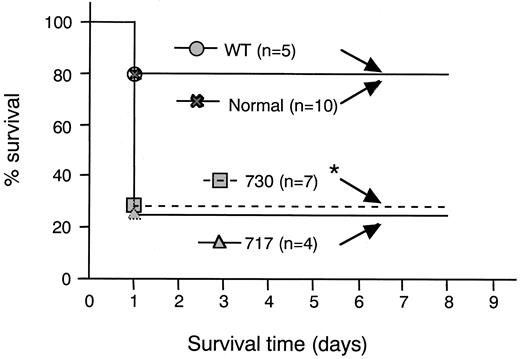
To assess the susceptibility of Tg mice to bacterial infection, groups of mice were challenged with S aureus at a dose less than the minimum lethal dose administered to the control group (Figure5). Death was observed within 2 days of infection in most of the groups, suggesting that S aureuscaused an acute infection. Compared with the mortality rate in the control group, a significantly higher mortality was observed in Tg mice expressing mutant 730 (n = 7). Although a statistical significance was not obtained, Tg mice expressing mutant 717 (n = 4) showed a higher mortality as well. These data indicated that the resistance to bacterial infection was impaired in the groups of neutropenic Tg mice.
Survival of Tg mice to bacterial infection.
Mice were infected intraperitoneally with 1.9 × 10⁸ CFUStaphylococcus aureus 18Z. *P < .05 compared with wild-type receptor transgenic and normal mouse.
Survival of Tg mice to bacterial infection.
Mice were infected intraperitoneally with 1.9 × 10⁸ CFUStaphylococcus aureus 18Z. *P < .05 compared with wild-type receptor transgenic and normal mouse.
Clonal culture of bone marrow cells of Tg mice
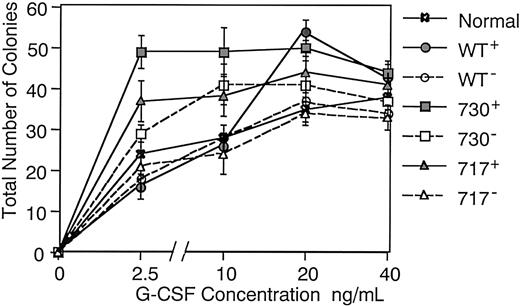
We next examined in vitro proliferation and differentiation of hematopoietic progenitor cells in Tg mice. When bone marrow cells were cultured in methylcellulose medium containing 5 factors (mSCF, mIL-3, hTPO, hIL-6, and hEPO), no difference was found in numbers of various types of colonies, such as granulocyte-macrophage (GM) colonies, erythroid bursts, and multilineage colonies, among Tg mice and their littermates (data not shown). However, GM colony formation in response to G-CSF differed between Tg mice and their littermates or normal mice (Figure 6). When cultured with varying concentrations of G-CSF, bone marrow cells of normal mice and littermates of each Tg mouse produced similar numbers of GM colonies under sufficient G-CSF stimulation (20 ng/mL), but larger numbers of GM colonies were produced in wild-type and truncated G-CSFR Tg mice compared with their littermates (P < .05 in wild-type and 717 truncated receptor Tg mice) in accordance with our previous observation in hG-CSFR Tg mice.14 Interestingly, GM colony-forming cells of wild-type and truncated G-CSFR Tg mice responded differently to G-CSF. Although the number of GM colonies gradually increased depending on the concentration of G-CSF up to 20 ng/mL in wild-type G-CSFR Tg mice as well as in normal mice and littermates of each Tg mouse, that in truncated G-CSFR Tg mice reached a plateau even at 2.5 ng/mL G-CSF, indicating a hypersensitivity to G-CSF stimulation in myeloid progenitors of truncated G-CSFR Tg mice.
Dose dependence of the effect of G-CSF on colony formation.
Bone marrow cells (2.5 × 10⁴) of normal mice, Tg mice expressing wild-type G-CSFR, and mutant receptors with a 730 or 717 amino acid truncation (WT+, 730+, and 717+, respectively), and their littermates (WT−, 730−, and 717−, respectively) were incubated in methylcellulose culture with varying concentrations of G-CSF. Dotted lines represent littermates of the Tg mice.
Suspension culture of bone marrow cells of Tg mice
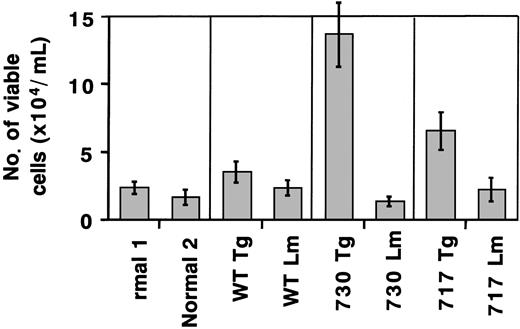
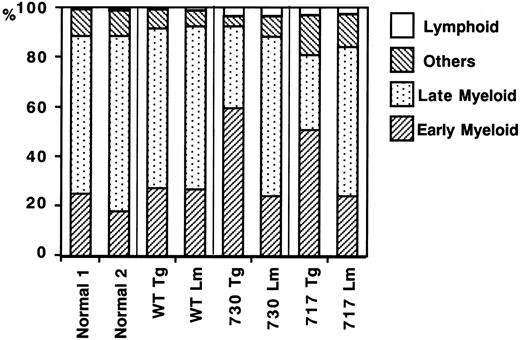
We also carried out suspension cultures of bone marrow cells of Tg mice. In the culture of bone marrow cells for a week with sufficient G-CSF stimulation (20 ng/mL), both truncated G-CSFR Tg mice, but not wild-type G-CSFR Tg mice, had an increased number of viable cells as compared with normal mice or their littermates (Figure7). Morphologic analysis showed that early myeloid cells at the myeloblast to metamyelocyte stage increased in the suspension culture of truncated G-CSFR Tg mouse marrow cells, consistent with the in vivo observation (Figure8). No obvious changes were observed in other lineages of cells, such as lymphoid cells, erythroid cells, monocytes/macrophages, and megakaryocytes.
Total cell count in suspension culture of Tg mouse marrow under sufficient G-CSF stimulation.
Bone marrow cells (5 × 10⁵/mL) of normal mice, Tg mice expressing wild-type (WT) G-CSFR, and mutant receptors with a 730 or 717 amino acid truncation, and their littermates (Lm) were incubated in suspension culture for a week in the presence of 20 ng/mL G-CSF.
Differential counts of bone marrow cells in suspension culture under G-CSF stimulation.
Bone marrow cells (5 × 10⁵/mL) of normal mice, Tg mice expressing wild-type (WT) G-CSFR, and mutant receptors with 730 and 717 amino acid truncations, and their littermates (Lm) were incubated in suspension culture for a week in the presence of 20 ng/mL G-CSF. Others indicates erythroid cells, monocytes/macrophages, and megakaryocytes; Late Myeloid, mature neutrophils with a banded or segmented nucleus; and Early Myeloid, immature myeloid cell (myeloblasts to metamyelocytes). % indicates the percentage of each cell fraction in total bone marrow cells.
Discussion
To elucidate the role of G-CSFR truncations in the etiology of SCN and its leukemic transformation, we made murine G-CSFR 717 and 730 truncation-mutant transgenic mice, equivalent to human 718 and 731 truncations, respectively, which were reported to be related to leukemic transformation of SCN. Both of the generated Tg mice expressing the truncated G-CSFR showed decreased numbers of neutrophils in peripheral blood, one third of the number in wild-type receptor Tg mice, resulting in the impaired ability to resist the bacterial infection. We also observed that immature myeloid cells were predominant in bone marrow of truncated G-CSFR Tg mice. This maturation arrest of the immature myeloid cells was reproducible in in vitro culture. When stimulated by G-CSF, bone marrow cells of truncated G-CSFR Tg mice increased more than those of their littermates or wild-type G-CSFR Tg mice, but immature myeloid cells occupied a larger proportion of the increased cells. These results suggest the involvement of truncated G-CSFR in the pathogenesis of SCN. It was shown through analysis of truncated G-CSFR–transformed murine myeloid cell lines that the intracytoplasmic COOH terminal region with the domain named box 3 and 2 to 3 tyrosines among 4 is critical in myeloid differentiation, and the proximal region stimulates proliferative signals.20-22 Therefore, signals through truncation receptors could be a negative regulator of neutrophil maturation and result in a reduced number of mature neutrophils. In the truncated G-CSFR Tg mice, the maturation arrest of myeloid cells occurred at a little later stage as compared with that in patients with SCN. It may be due to the difference in differentiation mechanism between human and murine myeloid cells. However, there may be a possibility that ubiquitous expression of receptor transgene products driven by the H2 promotor may contribute to the observed bone marrow phenotype. Primitive progenitor cells that do not normally express G-CSFR might expand as early myeloid cells.
We also observed hypersensitivity of myeloid progenitors of truncated G-CSFR Tg mice to G-CSF stimulation. Consistent with the present result, 715 truncation receptor-transformed cells exhibited a hyperproliferative response to G-CSF with up-regulation of STAT5.21-23 In addition, with sufficient G-CSF stimulation, viable myeloid cells were more abundant in suspension culture of bone marrow cells of truncated G-CSFR Tg mice than in wild-type G-CSFR Tg mice, although they had a similar number of G-CSF–responsive myeloid progenitors. Therefore, truncation-mutant receptors may be associated with prolonged myeloid cell survival under G-CSF stimulation. Thus, truncation-mutant receptors may induce proliferative stress to myeloid progenitors under thin G-CSF stimulation, and, with this proliferative stress, additional oncogenic events may act as a “second hit” for their transformation into leukemic cells.
Gene-targeted mice with a truncation of mG-CSFR reported previously showed different results to our Tg mice. The mice carrying a targeted 717 truncation mutation in the study by McLemore et al10 have normal levels of circulating neutrophils and no evidence for a block in neutrophil maturation in bone marrow. The gene-targeted mice carrying a homozygous 715 truncation mutation in the study by Hermans et al24 had 60% fewer circulating neutrophils but did not show maturation arrest in bone marrow. The discrepancies between the current Tg mice and previously generated Tg mice may be caused by the higher expression of transgened receptors in our Tg mice. Tidow et al4 described 2 SCN patients with truncation mutations in the cytoplasmic domain of G-CSFR mRNA, and Kasper et al25 detected normal G-CSFR protein in these SCN patients. Recently, Tschan et al26 also reported that both normal and truncated G-CSFR genes were detected at the same time in one patient with SCN. These reports showed that normal and truncation-mutant genes for G-CSFR exist at the same time in SCN patients with the possibility that these truncation mutations acted in a dominant-negative way. The higher levels of the truncated G-CSFR might result in a more prominent dominant-negative effect on endogenous wild-type G-CSFR. Furthermore, there may be a possibility that ubiquitous expression of truncated G-CSFR contributes to the discrepancy. Although further study should be performed, our Tg mice might be useful in the analysis of the role of truncated G-CSFR in SCN pathobiology.
We thank Imiko Hirose, Kyoko Maruyama, and Asako Hatsuyama for their expert technical assistance in the breeding and analysis of the G-CSFR Tg mice.
The publication costs of this article were defrayed in part by page charge payment. Therefore, and solely to indicate this fact, this article is hereby marked “advertisement” in accordance with 18 U.S.C. section 1734.
References
Author notes
Kohichiro Tsuji, Division of Cellular Therapy, The Advanced Clinical Research Center, The Institute of Medical Science, The University of Tokyo, 4-6-1 Shirokanedai, Minato-ku, Tokyo 108-8639, Japan; e-mail:tsujik@ims.u-tokyo.ac.jp.

This feature is available to Subscribers Only
Sign In or Create an Account Close Modal