The ligation of programmed death-ligand 1 (B7-H1) to T cells results in the preferential production of interleukin 10 (IL-10). We investigated if B7-H1 would be up-regulated in HIV infection, a disease characterized by increased IL-10 production, by measuring B7-H1, B7-1 (CD80), and B7-2 (CD86) expression and mRNA in 36 HIV-infected patients and in 22 healthy controls (HCs). Results showed that (1) B7-H1 expression and mRNA are augmented in cells of HIV patients; (2) increased IL-10 production in these patients is largely induced by B7-H1–expressing CD14+ cells; (3) an inverse correlation is detected between B7-H1 expression and CD4 counts, whereas the up-regulation of B7-H1 is directly associated with HIV plasma viremia; (4) antiviral therapy results in the parallel down modulation of IL-10 production and B7-H1 expression/synthesis; and (5) B7-H1/CD80 and B7-H1/CD86 mRNA ratios are increased in peripheral blood mononuclear cells (PBMCs) of HIV patients compared with HCs. B7-H1 synthesis and expression are up-regulated in HIV infection, and the degree of dysregulation correlates with the severity of disease. Aberrant antigen presentation by antigen-presenting cells (APCs) that exhibit increased B7-H1 expression and IL-10 production in HIV infection could be responsible for T-lymphocyte unresponsiveness and loss of protective immunity. B7-H1 is a surrogate marker potentially involved in AIDS disease progression.
Introduction
The activation of T lymphocytes is dependent on the presentation of processed antigenic peptides in association with major histocompatibility (MHC) molecules to lymphocytes that express a T-cell receptor specific for that binary complex.1,2 However, optimal lymphocyte activation requires a second signal that is delivered by the interaction between costimulatory, accessory molecules.3,4 The cross-linking of CD28 on the surface of T lymphocytes allows for the activation of these cells. CD28 binds to a family of ligands on the surface of non-T cells that are collectively known as B7 molecules.5,6 Beside B7.1 (CD80) and B7.2 (CD86), a number of other B7-like ligands have been described.7-9 Among these ligands, B7-H1 is particularly interesting. B7-H1, also called PD-L1, is constitutively present on monocytes and could be induced on activated T cells.7B7-H1 does not interact with CD28, cytotoxic T-lymphocyte antigen 4 (CTLA-4), or inducible costimulator (ICOS) but was shown to bind to programmed death 1 (PD-1)10,11 a CTLA-4–like molecule belonging to the immunoglobulin superfamily. Studies, however, suggested that receptors other than PD-1 can also ligate B7-H1.7 Ligation of B7-H1 to T cells results in the preferential production of interleukin-10 (IL-10)7 and in increased T-helper–dependent synthesis of trinitrophenyl (TNP)–specific immunoglobulin G2a (IgG2a)12 in mice. These results suggest that ligation of B7-H1 may be responsible for promoting type 2 cytokine-biased responses.
Interleukin-10 production by peripheral blood mononuclear cells (PBMCs) is augmented in infectious and noninfectious pathologies, including HIV disease.13-16 In particular, cell-mediated immunity (CMI) is characteristically impaired in HIV infection.17-20 The progression of this infection is associated with increased HIV replication, reduction of circulating CD4+ T lymphocytes, functional defects of CMI, and augmented apoptosis of T lymphocytes.21,22 An impairment in the production of type 1 cytokines accompanied by increased secretion of type 2 cytokines has also repeatedly been suggested to accompany progression of HIV disease.14,16,23,24 Because IL-10, a T helper cell type 2 (TH2)–type cytokine, is known to be a powerful inhibitor of TH1 activation and to suppress CMI in mice and humans,25,26 we studied the possible role of impaired regulation of B7-H1 expression/synthesis in this disease. Furthermore, because highly active antiretroviral therapy (HAART) was shown to reduce IL-10 production,27-30 we investigated whether B7-H1 would be down-regulated on HAART.
The present study demonstrates that the cell surface expression and the amount of B7-H1 mRNA are increased in HIV-infected patients and that those HIV-infected individuals whose disease is immunologically or virologically more advanced showed an even greater increase in B7-H1. Additionally, we observed a parallel decrease in IL-10 production and in the expression/synthesis of B7-H1 in patients treated with HAART. Our results suggest that B7-H1 is a surrogate marker for AIDS disease progression. In addition, our results also implicate a role of B7-H1 in AIDS progression.
Patients, materials, and methods
Demographic, clinical, and immunologic classification of patients
Immune parameters were investigated in 36 chronically HIV-infected (> 3 years of infection) patients. Twenty-four of 36 patients were receiving highly active antiretroviral therapy (HAART), whereas the other 12 patients were not receiving antiviral drugs. Treated patients had undergone therapy for a median of 10 months before study period and were antiretroviral naive prior to starting HAART. CD4 counts (HAART-treated mean, 589/μL [range, 18-1212/μL]; HAART-untreated, 507/μL [309-808]) and HIV viral load (HAART-treated, 2019/mL [< 50-33 000/mL]; HAART-untreated, 8077/mL [68-45 700/mL]) were not statistically different between the 2 groups of patients. Eighteen patients were treated with one protease inhibitor (PI) plus 2 nucleoside reverse transcriptase inhibitors (NRTIs); 6 other patients received 2 PIs in association with 2 NRTIs. Twenty-two age-matched HIV-uninfected healthy individuals (blood donors) were studied as control subjects. Written informed consent was obtained from all the participants, and the study was approved by institutional review boards from all participating centers.
Blood samples collection
Whole blood was collected by venepuncture in Vacutainer tubes containing EDTA (ethylenediaminetetraacetic acid) (Becton Dickinson, Rutherford, NJ). PBMCs were separated on lymphocyte separation medium (Organon Teknica, Durham, NC) and washed twice in phosphate-buffered saline (PBS; Organon Teknica), and the number of viable leukocytes was determined by trypan blue exclusion. All analyses were performed on freshly collected cells.
Stimulation of PBMCs
PBMCs (2 × 10⁶) were incubated for 18 hours with (1) medium, (2) phytohemagglutinin (PHA; 2.5 μg/mL) (Sigma, St Louis, MO), or (3) lipopolysaccharide (LPS; 10 μg/mL) (Sigma). For cytokine production PBMCs were incubated in the presence/absence of staphylococcal enterotoxin B (SEB; 200 ng/mL) (Sigma) + anti-CD28 (1 μg/mL) (R&D Systems, Minneapolis, MN).
Immunofluorescent staining
PBMCs were washed in PBS, split in different flow cytometry tubes, and stained with monoclonal antibodies specific for CD3, CD14, CD19, CD80, and CD86 (Caltag Laboratories, Burlingame, CA) for 30 minutes at 4°C in the dark. For indirect immunofluorescence staining, PBMCs were first incubated with monoclonal antibody against B7-H1 at 1:1000 dilution. After 30 minutes at 4°C, the cells were washed and further incubated for 30 minutes at 4°C with goat against human immunoglobulin G F(ab′) conjugated with fluorescein isothiocyanate (1:25 dilution; Caltag Laboratories).
For analysis of cytokine-secreting cells, PBMCs were washed after phenotypic staining and fixed in Reagent A solution (FIX & PERM cell permabilization kits; Caltag Laboratories) for 10 minutes at room temperature in the dark. The cells were washed in PBS and resuspended in Reagent B (FIX & PERM cell permabilization kits; Caltag Laboratories) with cytokine-specific monoclonal antibodies (IL-10 PE). After a 30-minute incubation at 4°C in the dark, the cells were washed and fixed in 1% paraformaldehyde in PBS.
Monoclonal antibodies (mAbs)
The following mAbs were used in this study: anti-CD3 (mouse IgG2a isotype), anti-CD14 (mouse IgG2a isotype), anti-CD19 (mouse IgG1 isotype) coupled to R-phycoerythrin-Cyanine 5 Tandem (TC), anti-CD80 (mouse IgG1 isotype) coupled to R-phycoerythrin (PE), anti-CD86 (mouse IgG1 isotype) coupled to fluorescein isothiocyanate (FITC). The intracellular molecule detection mAb used was antihuman IL-10 (mouse IgG1 isotype) coupled to PE.
Cytometric analysis
The cytometric analyses of phenotype and cytokine-secreting lymphocytes were performed using an EPICS XL flow cytometer (Beckman-Coulter, Miami, FL) equipped with a single 15-mW argon ion laser operating at 488 nm interfaced with 486 DX2 IBM computer (IBM, Portsmouth, United Kingdom). For each analysis, 20 000 events were acquired and gated on CD3 (or CD14) expression and side scatter properties. Green fluorescence from FITC (FL1) was collected through 525-nm bandpass filter, orange-red fluorescence from R-PE (FL2) was collected through a 575-nm bandpass filter, and deep-red fluorescence from TC (FL4) was collected through 670-nm bandpass filter. Data were collected using linear amplifiers for forward and side scatter and logarithmic amplifiers for FL1, FL2, and FL4. Samples were first run using isotype control or single fluorochrome-stained preparations for color compensation.
RNA extraction and reverse transcription
Total RNA was extracted from lymphocytes with the acid guanidium thiocyanate-phenol-chloroform method, and purity was determined by spectrophotometry. RNA was treated with RNase-free DNase (RQ1 DNase; Promega, Madison, WI) to remove the contamination of genomic DNA. Total RNA (1 μg) from lymphocytes was reverse transcribed into first-strand cDNA in a 20-μL final volume containing 1 μM random hexanucleotide primers, 1 μM oligo dT, and 200 U Molony murine leukemia virus reverse transcriptase (Clontech, Palo Alto, CA).
Quantification of CD80, CD86, and B7-H1 cDNA by competitive PCR
To quantify the expression of CD80, CD86, and B7-H1, we used an exogenous competitor in competitive polymerase chain reaction (PCR). The competitor template was built according to the instruction provided with the Competitive DNA Construction Kit (Takara, Otsu, Japan). The target template and the competitor have similar lengths and the same primer recognition sequences, thus ensuring identical thermodynamics and amplification efficiency for both template species. The amount of competitor is known. For CD80 cDNA quantification the target generates a fragment of 303 base pair (bp) and the competitor is 344 bp, for CD86 the target is 403 bp and the competitor 444 bp, for B7-H1 the target is 396 bp and the competitor 442 bp. After amplification, products are distinguished by gel electrophoresis to allow densitometric evaluation of the relative intensities of the bands. The ratio of amplification products reflects the ratio between the initial amount of template, thus allowing the precise evaluation of CD80, CD86, and B7-H1 cDNA amounts. The same procedure has been followed to quantify the glyceraldehyde phosphate dehydrogenase (GAPDH) cDNA (target, 199 bp; competitor, 241 bp), to normalize the results obtained. The magnitude of target gene expression is then calculated as copies of target cDNA per copies of GAPDH cDNA.
Quantification of cytokine cDNA by PCR
To normalize the cDNA sample concentration, all samples were diluted to the same concentration as the sample with the lowest GAPDH concentration. Each PCR was performed in a 25-μL reaction mixture containing 5 μL diluted reverse transcriptase (RT) reaction mixture, 2.5 μL 1× PCR buffer (20 mM Tris (tris(hydroxymethyl)aminomethane)–HCl, 100 mM KCl, 0.1 mM EDTA, 1 mM dichlorodiphenyltrichloroethane (DTT), 0.5% Tween 20, 0.5% Nonited p40, 50% glycerol), 1.5 μL of 25 mM MgCl2, 2 μL of 200-μM concentration of each deoxynucleoside triphosphate (dNTP), 0.2 μL of 1.25 U Taq polymerase (Takara, Otsu, Japan), 1 μL of 0.4 μM GAPDH primers, and 1 μL of 0.4 μM for each cytokine (IL-2, IL-10). Thermal cycling was performed in a Touchdown Hybrid (Celbio, Milano, Italy) by using the following amplification profile: an initial denaturation at 95°C for 10 minutes; 35 cycles of denaturation at 95°C for 30 seconds, annealing at 60°C for 30 seconds, and extension at 72°C for 30 seconds; a final amplification step at 72°C for 10 minutes.
The PCR reaction products were then electrophoresed in a 10% acrylamide gel and stained with 0.5 μg/mL ethidium bromide, and the size of each cDNA product was determined by comparison with a DNA size marker pbR322 (Sigma). To quantify relative levels of gene expression the bands on the gels were scanned by transmission densitometry, and the areas of the peaks were calculated in arbitrary units. To evaluate the relative levels of expression of the target genes in RT-PCRs, the value of the internal standard (GAPDH) in each test tube was used as the baseline gene expression of that sample, and the relative value was calculated for each of the target genes amplified in that reaction. These values were then used to compare expression across samples tested.
Statistical analysis
Procedures were based on nonparametric analyses (Mann-Whitney); comparisons between different groups of patients were made using Fisher exact 2-tailed test. Statistical analysis was performed using the SPSS-PC statistical package (SPSS, Chicago, IL).
Results
IL-10 production is increased in HIV patients
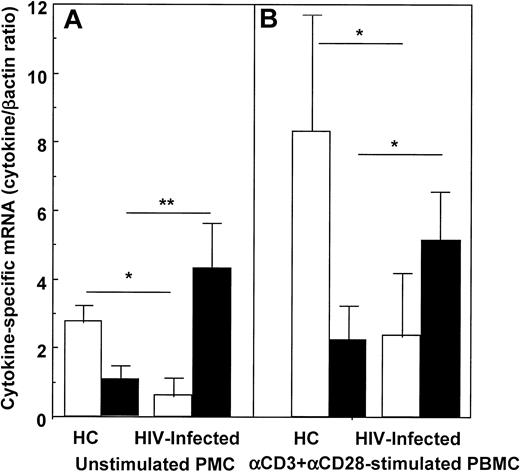
IL-10 and IL-2 mRNA were quantified in unstimulated and in anti-CD3+anti-CD28-stimulated PBMCs of 36 HIV-infected individuals and in 22 HCs. IL-10–specific mRNA was increased, and IL-2–specific mRNA was reduced in HIV patients compared with HCs. These differences were statistically significant and were observed both in unstimulated and in anti-CD3+anti-CD28–stimulated PBMCs (Figure 1).
IL-2– and IL-10–specific mRNA in unstimulated (A) and anti-CD3+anti-CD28–stimulated PBMCs (B) of HIV-infected individuals and of healthy controls.
Open boxes (■) represent IL-2; black boxes (▪) represent IL-10. Mean values, SE, and statistically significant differences are shown. * = P < .05; ** = P < .005.
B7-H1–expressing CD3+, CD14+, and CD19+ cells of HIV-infected individuals and healthy control subjects
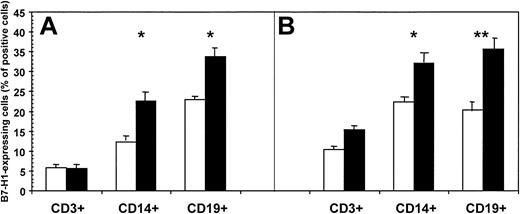
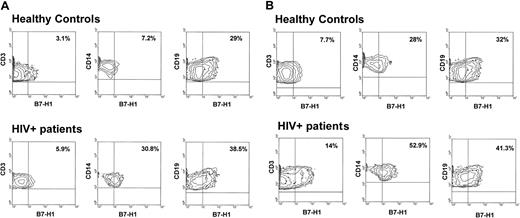
B7-H1 is expressed on resting monocytes/macrophages and B lymphocytes and appears on activated T cells. Thus, we measured B7-H1 expression by fluorescence-activated cell sorter (FACS) in unstimulated and in mitogen-stimulated CD3+, CD14+, and CD19+ cells from all the HIV-infected individuals and HCs included in the study. PBMCs were either stimulated with PHA and subsequently gated on CD3 or stimulated with LPS and gated on CD14 or CD19. Results are shown in Figure2 and are summarized as follows: (1) the percentage of unstimulated and mitogen-stimulated CD3+/B7-H1+ cells was comparable in HIV patients and control subjects; (2) B7-H1–expressing unstimulated and mitogen-stimulated CD14+ cells were significantly increased in HIV patients compared with control subjects (P = .024 and P = .011, respectively); (3) unstimulated and mitogen-stimulated CD19+/B7-H1+ cells were significantly increased in HIV patients compared with controls (P = .014 andP = .0012, respectively). Representative results obtained in HIV-infected patients and in healthy controls are shown in Figure 3.
Percentage of B7-H1–expressing CD3+, CD14+, and CD19+ cells of HIV-infected individuals (▪) and of healthy controls (■).
Cells were either unstimulated (A) or mitogen stimulated (B). Mean values, SE, and statistically significant differences are shown. * = P < .05; ** = P < .005.
Percentage of B7-H1–expressing CD3+, CD14+, and CD19+ cells of HIV-infected individuals (▪) and of healthy controls (■).
Cells were either unstimulated (A) or mitogen stimulated (B). Mean values, SE, and statistically significant differences are shown. * = P < .05; ** = P < .005.
Flow cytometry analysis of B7-H1 expression.
(A) Flow cytometry analysis of B7-H1 expression by CD3+-, CD14+-, and CD19+-unstimulated cells of a representative healthy control (upper panels) and a representative HIV-infected patient (lower panels). (B) Flow cytometry analysis of B7-H1 expression on CD3+-, CD14+-, CD19+-, and anti-CD3+anti-CD28-stimulated cells of a representative healthy control (upper panels) and a representative HIV-infected patient (lower panels).
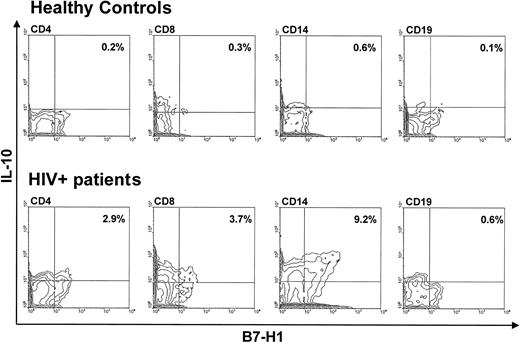
The results represented in Figure 2 showed that HIV infection is associated with the up-regulation of B7-H1, and ligation of B7-H1 is known to result in the preferential generation of IL-10. To verify whether all the cell types analyzed produce increased amounts of this cytokine, we analyzed intracellular IL-10 production in CD3+ (distinguishing between CD4+ and CD8+ lymphocytes), CD14+, and CD19+B7-H1-expressing cells of HIV-infected patients and HCs. The results showed that, although all B7-H1–expressing cell types stained positive to intracellular IL-10, increased IL-10 production in HIV infection was mainly observed in the B7-H1–expressing CD14+ cells (Figure 4).
Flow cytometry analysis of intracellular IL-10 in CD4+-, CD8+-, CD14+-, and CD19+-unstimulated cells of a representative healthy control (upper panels) and a representative HIV-infected patient (lower panels).
Flow cytometry analysis of intracellular IL-10 in CD4+-, CD8+-, CD14+-, and CD19+-unstimulated cells of a representative healthy control (upper panels) and a representative HIV-infected patient (lower panels).
B7-H1-specific mRNA in PBMCs of HIV-infected individuals and healthy controls
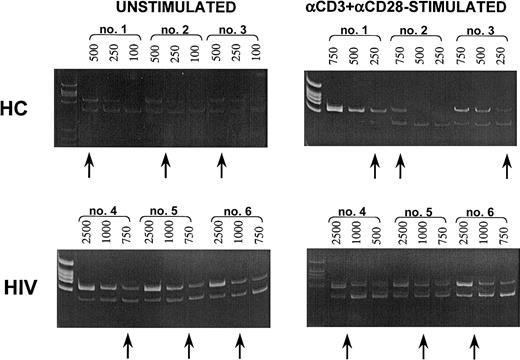
B7-H1–specific mRNA was quantified using PCR techniques in unstimulated and anti-CD3+anti-CD28–stimulated PBMCs of HIV-infected patients and HCs. The results indicated that PBMCs of HIV-infected patients expressed a significantly higher amount of B7-H1–specific mRNA compared with HCs. These differences were statistically significant both when unstimulated (P = .024) and anti-CD3+anti-CD28–stimulated PBMCs (P = .032) were analyzed. CD80- and CD86-specific mRNA was quantified as well; results showed that similar amounts of CD80- and CD86-specific mRNA are present in unstimulated and mitogen-stimulated PBMCs of patients and control subjects (Table1). Representative results obtained in HIV patients and in healthy controls are shown in Figure5.
B7-H1-, CD80-, and CD86-specific mRNA in unstimulated and in αCD3+αCD28-stimulated PBMCs of healthy controls and of HIV-infected patients
| . | Unstimulated PBMCs . | Anti-CD3+ αCD28-stimulated PBMCs . | ||||
|---|---|---|---|---|---|---|
| B7-H1 . | CD80 . | CD86 . | B7-H1 . | CD80 . | CD86 . | |
| Healthy controls (N = 22) | 24.3 ± 6.8* | 29.2 ± 8.3 | 44.7 ± 14.1 | 74.1 ± 14.2* | 57.1 ± 3.6 | 83.5 ± 22.4 |
| HIV-patients (N = 36) | 91.7 ± 17.3 | 38.9 ± 7.4 | 25.2 ± 5.8 | 151.8 ± 18.6 | 72.1 ± 8.9 | 43.6 ± 9.7 |
Protein/GAPDH ratio is presented. Mean values and SE are shown.
P < .05.
Quantification of B7-H1–specific mRNA.
(Upper panels) Quantification of B7-H1–specific mRNA in resting (unstimulated; left panel) or in anti-CD3+anti-CD28−–stimulated (right panel) PBMCs of 3 representative healthy controls. (Lower panels) Quantification of B7-H1–specific mRNA in resting (unstimulated; left panel) or in anti-CD3+anti-CD28–stimulated (right panel) PBMCs of 3 representative HIV-infected patients. The upper bands show cDNA retrotranscribed from mRNA extracted from PBMCs; the lower bands show different dilutions (eg, 500, 250, 100) of the specific competitors. The arrows show the dilution at which equivalence is observed between sample cDNA and the specific competitors.
Correlation of B7-H1 expression with CD4 count and HIV viral load in HIV-infected patients
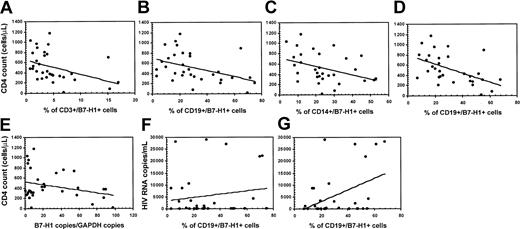
The progression of HIV infection is associated with reduced CD4 counts, increased HIV plasma viremia, and increased IL-10 production. To analyze possible associations between these parameters we tested whether B7-H1 expression would be correlated with CD4 counts and HIV viremia. A number of statistically significant correlations were observed. Thus, results indicated an inverse correlation between CD4 counts and the percentage of unstimulated CD3+/B7-H1 (P = . 032;r = −0.396) (Figure 6A) and CD19+/B7-H1 (P = .012;r = −0.426) (Figure 6B) cells. An inverse correlation was also seen between CD4 counts and the percentage of mitogen-stimulated CD14+/B7-H1+ (P = 028;r = −0.381) (Figure 6C) and CD19+/B7-H1+ (P = .011;r = −0.521) (Figure 6D) cells. These results were verified by quantification of B7-H1–specific mRNA. Results confirmed that CD4 counts are inversely correlated with the expression of B7-H1–specific mRNA in unstimulated PBMCs (P = .0045;r = −0.620) (Figure 6E).
Correlation between B7-H1 expression and CD4+ T-cell counts and between B7-H1 expression and HIV plasma viremia in HIV-infected patients.
Panels show the correlation between CD4 counts and the percentage of unstimulated CD3+/B7-H1 (A), unstimulated CD19+/B7-H1 (B), mitogen-stimulated CD14+/B7-H1 (C), and mitogen-stimulated CD19+/B7-H1 (D). Panel E shows the correlation between CD4 counts and the expression of B7-H1–specific mRNA in unstimulated PBMCs. (F-G) The correlation between HIV plasma viremia and the percentage of unstimulated (F) and mitogen-stimulated CD19+/B7-H1 (G) cells.
The potential value of B7-H1 as a surrogate marker of progression in HIV infection was further reinforced by the positive correlation that was detected between HIV plasma viremia and the percentage of unstimulated (P = .012; r = 0.461) (Figure6F) and mitogen-stimulated (P = .032;r = 0.377) (Figure 6G) CD19+/B7-H1+ cells. Finally, a strong positive correlation was detected between HIV plasma viremia and IL-10-producing, B7-H1-expressing CD14+ cells (P = .008; r = 0.819).
Antiviral therapy reduces IL-10 production, resulting in a down-regulation of B7-H1
Highly active antiretroviral therapy (HAART) results in a reduction of IL-10 production. We verified if this effect of HAART would be associated with a down-regulation of B7-H1. Thus, we divided HIV-infected individuals into those who were (n = 24) or were not (n = 12) undergoing HAART and compared B7-H1 expression and B7-H1–specific mRNA in the 2 groups of patients. CD4 counts and HIV viral load were not statistically dissimilar between these groups of individuals.
The results showed that IL-10 was reduced in HAART-treated patients; this result was paralleled by a down-regulation of B7-H1. Thus (1) the percentage of unstimulated and of mitogen-stimulated peripheral cells is reduced in HAART-treated patients, and (2) B7-H1–specific mRNA is reduced in unstimulated and mitogen-stimulated PBMCs of HAART-treated compared with HAART-untreated patients. These results are shown in Table 2.
IL–2 and IL-10 mRNA, B7-H1 expression, and B7-H1–specific mRNA in 24 HIV-infected patients undergoing highly active antiretroviral therapy (HAART) and in 12 HIV-infected, HAART-untreated patients
| . | HAART treated . | HAART untreated . | P . |
|---|---|---|---|
| Unstimulated PBMCs | |||
| IL-2 mRNA | 0.53 ± 0.31 | 0.88 ± 0.29 | NS |
| IL-10 mRNA | 3.06 ± 1.02 | 5.59 ± 0.97 | NS |
| B7-H1 expression on | |||
| CD3+cells | 5.34 ± 1.44 | 8.98 ± 2.51 | NS |
| CD14+cells | 19.37 ± 4.88 | 33.71 ± 8.55 | .043 |
| CD19+cells | 26.74 ± 4.58 | 39.91 ± 7.15 | .032 |
| B7-H1–specific mRNA | 19.04 ± 4.17 | 31.14 ± 5.88 | .033 |
| Stimulated PBMCs | |||
| IL-2 mRNA | 2.06 ± 0.87 | 3.18 ± 0.99 | NS |
| IL-10 mRNA | 3.62 ± 0.95 | 6.72 ± 1.12 | .017 |
| PDL-1 expression on | |||
| CD3+cells | 9.98 ± 2.54 | 14.17 ± 3.21 | NS |
| CD14+cells | 27.44 ± 4.19 | 39.81 ± 5.72 | .039 |
| CD19+cells | 37.81 ± 4.77 | 46.11 ± 6.22 | NS |
| B7-H1–specific mRNA | 78.12 ± 9.15 | 107.74 ± 14.32 | .041 |
Mean ± SE and statistical significance are shown.
Discussion
T-cell activation is induced by the presentation of processed antigenic peptides within the cleft of MHC molecules on the surface of antigen-presenting cells (APCs) in the presence of cytokines and costimulatory molecules.1-4 The B7 family of molecules is the main cluster of costimulatory molecules expressed on the surface of APCs and includes both molecules with a prevalent stimulatory effect (CD80 and CD86) and molecules that can have a prevalent inhibitory function.6,7,31 Among these molecules B7-H1, a receptor that is mainly present on monocytes and on B lymphocytes but also appears on T lymphocytes on activation, has a pivotal role.7 B7-H1 does not interact with CD28, CTLA-4, or ICOS and was demonstrated to ligate PD-1.10 Nevertheless, because PD-1 is only detected on a minority of activated T cells,7 it has been suggested that receptors other that PD-1 can also ligate B7-H1. Ligation of B7-H1 to its receptor(s) results in the preferential stimulation of IL-10 production, and in the synthesis of T helper-dependent TNP-specific IgG2a in mice.7,8 Thus, ligation of B7-H1 could be responsible for promoting type 2 cytokine-biased responses. Antigen presentation in the presence of IL-10 does not lead to T-cell proliferation but rather to lack thereof;25,26 ligation of B7-H1 may, therefore, also result in the unresponsiveness/anergy of antigen-specific T cells. Recent results show that ligation of B7-H1 also promotes T-cell apoptosis, potentially favoring immune evasion of tumors.31
HIV infection is associated with increased IL-10 production13-16 and is also associated with functional impairment and anergy of antigen-specific responses, as well as increased susceptibility of T lymphocytes to apoptosis.21 22 These clinical observations are strikingly similar to the effect induced by B7-H1 ligation. Thus, we evaluated whether the synthesis and expression of B7-H1 would be up-regulated in HIV infection and in progression to AIDS. Our results demonstrated that B7-H1 is up-regulated in HIV infection and that the degree of up-regulation is negatively associated with CD4 counts and positively associated with HIV plasma viremia. Furthermore, parallel decreases in IL-10 production and in B7-H1 synthesis/expression are seen during antiretroviral treatment of HIV-infected patients. Our observation supports B7-H1 expression as a reverse indicator for HIV infection.
It is unknown whether B7-H1 is also involved in the down-regulation of CMI that is observed in HIV infection. The observation that B7-H1 ligation preferentially stimulates secretion of IL-10,7which down-regulates TH1 response and facilitates the induction of T-cell anergy,25,26 seems to support this hypothesis. The mechanism(s) leading to the up-regulation of B7-H1 in HIV infection is unclear, but this phenomenon is unlikely to be secondary to a direct effect of the virus. In fact, recent data show that B7-H1 is abundant in human carcinomas of lung, ovary, and colon,32 whereas the synthesis and expression of B7-H1 is drastically reduced in inflammatory bowel diseases (IBDs) (M.C. et al, unpublished observation, August 2002). Interestingly, whereas carcinomas33-35 are known to be associated with increased IL-10 production, IL-10 production is reduced in IBD.36-38
HIV infection results in a loss of T helper function that involves all the T helper/APC pathways. In particular, the loss of T helper cell proliferation and IL-2 production in response to presentation of processed antigens on self-APC is precocious and characteristic.18 Earlier data stemming from cocultures of HIV-infected T helper cells with autologous uninfected APCs, or vice versa, showed that this defect is not dependent either on an inability of the APCs to process/present antigens or on a T helper cell–specific impairment, but rather on the way in which the 2 cell types interact.39 40 The observation that B7-H1 expression is augmented on the surface of cells of HIV-infected individuals could explain this observation. Thus, antigenic presentation in the presence of IL-10 secretion could result in a lack of T-cell responsiveness.
The susceptibility of antigen-stimulated CD4+ T cells of HIV-infected patients to undergo apoptosis is enhanced,41-43 and vitro susceptibility of these lymphocytes to apoptosis was shown to be differentially regulated by type 1 and type 2 cytokines. Hence, type 1 cytokines prevent in vitro apoptosis, whereas type 2 cytokines, and in particular IL-10, did not prevent, but amplified, apoptosis.44,45 Ligation of B7-H1 on APCs of HIV-infected individuals, and subsequent IL-10 production, would thus result in augmented susceptibility of antigen-specific T cells to apoptosis. It is interesting that the inhibitory effects associated with the triggering of the PD-l pathway, and the prevention of IL-10–induced apoptosis of CD4+ T lymphocytes of HIV-infected individuals, can be overcome by IL-2.45Nevertheless, this rescue mechanism would likely not function in progressive HIV infection, a disease that is characterized by early defects that selectively involve IL-2 production.17 18
We demonstrate here a direct correlation between HIV viral load and (1) increased expression of B7-H1 and (2) augmented percentage of B7-H1-expressing, CD14+, IL-10+ cells. It has been reported that IL-10 enhances entry of HIV into target cells through the up-regulation of CD4 and CCR5.46,47Additionally, IL-10 was shown to increase HIV infection of human monocytes48 and to directly stimulate viral replication in antigen-presenting cells.49 The B7-H1–mediated augmented production of IL-10 could explain these observations.
Although HIV infection resulted in increased B7-H1 synthesis/expression on CD3+, CD14+, and CD19+ cells, our data show that IL-10 production in HIV infection is mostly observed in CD14+ cells. This result confirms previous data demonstrating that IL-10 production is differentially regulated in T cells and monocytes of HIV-infected individuals and that monocytes are the major IL-10–producing cell type in this infection.50The potential of IL-10–producing antigen-presenting cells to modulate immune responses has been reported in experimental autoimmune encephalitis (EAE) in mice.51,52 In this model, suppression of EAE is dependent on the ability of APCs to produce IL-10,51,52 and IL-10 production can result in tolerance via a direct suppression of T helper lymphocytes,53 via the modulation of regulatory cells,54 or through the modulation of APC function.55 The importance of the PD-l pathway in the regulation of tolerance, or lack thereof, is further reinforced by results showing that mice deficient in PD-1 exhibit a breakdown of peripheral tolerance and demonstrate multiple autoimmune features.11,56,57 In this context, it is noteworthy that progressive HIV disease is associated with autoantibody production.58 59 The dysregulation of the PD-l pathway resulting in the up-regulation of synthesis/expression of B7-H1 in the context of a chronic infection, as described here in HIV infection, could nevertheless be deleterious and lead to tolerance and unresponsiveness of antigen-specific lymphocytes, phenomena that are seen in this infection. In this time, however, we do not know whether the effect of B7-H1 is mediated through ligation of PD-1 on T cells because other receptors other than PD-1 on T cells have been implicated in the effect of B7-H1.
Biologic phenomena that are associated with progression of HIV-infected individuals to AIDS are (1) decline in the number of CD4+ T cells; (2) increase in HIV plasma viremia; (3) impairment/anergy of the functionality of T helper cells, decrease in production of type 1 cytokines, and increase in IL-10 production; and (4) increased susceptibility of PBMCs to activation-induced T-cell death. This study sheds light on the possible connection among these phenomena by demonstrating that B7-H1 synthesis/expression, the ligation of which results in IL-10 production, T helper cell impairment/anergy, and promotion of T-cell apoptosis are augmented in the progression of HIV infection. Blockade of B7-H1 by specific antibodies or soluble inhibitors could be beneficial in HIV disease.
We thank Ms Alessandra Beardo, Giuliana Magri, and Francesca Fasano, Department of Immunology, University of Milano, for excellent technical support.
Prepublished online as Blood First Edition Paper, December 5, 2002; DOI 10.1182/ blood-2002-10-3065.
Supported by grants from Istituto Superiore di Sanita' “III Programma Nazionale di Ricerca sull' AIDS 1999” and from Ministero Universitá e Ricerca (MURST) “Progetto Centri di Eccellenza Cisi.”
The publication costs of this article were defrayed in part by page charge payment. Therefore, and solely to indicate this fact, this article is hereby marked “advertisement” in accordance with 18 U.S.C. section 1734.
References
Author notes
Mario Clerici, Cattedra di Immunologia, Universita' degli Studi di Milano, DISP LITA Vialba, Via GB Grassi, 74, 20157 Milano, Italy; e-mail:mago@mailserver.unimi.it.

This feature is available to Subscribers Only
Sign In or Create an Account Close Modal