Abstract
Macrophage inflammatory protein-1α (MIP-1α) and MIP-1β are distinct but highly homologous CC chemokines produced by a variety of host cells in response to various external stimuli and share affinity for CCR5. To better elucidate the role of these CC chemokines in adaptive immunity, we have characterized the affects of MIP-1α and MIP-1β on cellular and humoral immune responses. MIP-1α stimulated strong antigen (Ag)–specific serum immunoglobulin G (IgG) and IgM responses, while MIP-1β promoted lower IgG and IgM but higher serum IgA and IgE antibody (Ab) responses. MIP-1α elevated Ag-specific IgG1 and IgG2b followed by IgG2a and IgG3 subclass responses, while MIP-1β only stimulated IgG1 and IgG2b subclasses. Correspondingly, MIP-1β produced higher titers of Ag-specific mucosal secretory IgA Ab levels when compared with MIP-1α. Splenic T cells from MIP-1α– or MIP-1β–treated mice displayed higher Ag-specific Th1 (interferon-γ [IFN-γ]) as well as selective Th2 (interleukin-5 [IL-5] and IL-6) cytokine responses than did T cells from control groups. Interestingly, mucosally derived T cells from MIP-1β–treated mice displayed higher levels of IL-4 and IL-6 compared with MIP-1α–treated mice. However, MIP-1α effectively enhanced Ag-specific cell-mediated immune responses. In correlation with their selective effects on humoral and cellular immune responses, these chemokines also differentially attract CD4+ versus CD8+ T cells and modulate CD40, CD80, and CD86 expressed by B220+ cells as well as CD28, 4-1BB, and gp39 expression by CD4+ and CD8+ T cells in a dose-dependent fashion. Taken together, these studies suggest that these CC chemokines differentially enhance mucosal and serum humoral as well as cellular immune responses.
Introduction
Early-acting innate effector molecules are required to signal the host of potentially lethal agents for protection. In this regard, intestinal epithelial cells produce inflammatory cytokines interleukin-1 (IL-1), tumor necrosis factor-α (TNF-α), IL-6, and IL-8.1,2 Recently, human nasal- and adenoid-derived epithelial cells have been shown to secrete CC chemokines such as macrophage inflammatory protein-1α (MIP-1α) and MIP-1β.3 Although MIP-1α and MIP-1β are derived from separate genes, they are highly homologous (about 60% identity).4 While MIP-1α and MIP-1β bind CCR5,5,6 MIP-1α also binds CCR1 7,8 as well as CCR3 in the mouse,9 and MIP-1β is a ligand for CCR8.10 These chemokines are produced by epithelial cells,3,11-13 lymphocytes,14 and platelets15 and act as potent chemoattractants for monocytes,16,17 natural killer (NK) cells,18 eosinophils,19 and dendritic cells.20,21 Several studies have also demonstrated a selective effect of MIP-1α and MIP-1β on CD8+ and CD4+ T-cell subset migration22,23 and microvascular cell adhesion.24 Moreover, MIP-1α was found to be more efficient at the chemotaxis of B cells when compared with MIP-1β.23 However, it is not certain how these chemokines affect adaptive immunity.
MIP-1α and MIP-1β have been shown to induce lymphocyte migration into the nasal mucosa and are highly expressed by influenza virus–infected bronchial and nasal epithelial cells.13Moreover, Mycobacterium tuberculosis–infected murine macrophages or Klebsiella pneumoniae challenge results in the expression MIP-1α.17,25 Anti–MIP-1α monoclonal antibody (mAb) treatment has been shown to block Th1 responses that are required to clear a Cryptococcus neoformansinfection.26 Correspondingly, MIP-1α has been shown to enhance interferon-gamma (IFN-γ) production of in vitro antigen (Ag)–stimulated T cells27 while decreasing IL-4 production.28 In contrast, CCR5 gene knock-out (CCR5−/−) and MIP-1α−/− mice displayed augmented Th1 responses to Leishmania donovani Ag compared with wild-type mice when challenged with L donovani.29 These studies have addressed the expression of chemokines in response to microbial infection and the important role of MIP-1α and MIP-1β in the outcome of inflammatory and infectious diseases. Despite these studies, the mechanisms that these chemokines use for the transition of acute inflammation to host mucosal immune responses remain elusive.
We have previously demonstrated that lymphotactin and RANTES (regulated on activation normal T cells expressed and secreted) enhance mucosal and systemic immunity when nasally coadministered with a protein Ag.30 31 These previous studies clearly suggest that chemokines may be major regulatory molecules facilitating the induction of adaptive mucosal immunity. The current study seeks to identify the effects of MIP-1α and MIP-1β on mucosal and systemic immune responses. Our results demonstrate that both of these chemokines differentially regulate humoral and cellular immunity.
Materials and methods
Reagents
Murine MIP-1α and MIP-1β were purchased from PeproTech (Rocky Hill, NJ). The potential level of endotoxin contamination was quantified by the chromogenic Limulus amebocyte lysate assay (Associates of Cape Cod, Falmouth, MA) to be less than 5 EU/mg. Chicken egg albumin (OVA), bovine serum albumin (BSA), and hen egg white lysozyme were purchased from Sigma Chemical (St Louis, MO). Cholera toxin was purchased from List Biologicals (Campbell, CA).
Mice and immunizations
Female C57BL/6 and BALB/c mice, aged 5 to 6 weeks, were procured from The Jackson Laboratory (Bar Harbor, ME). All mice were housed in horizontal laminar flow cabinets free of microbial pathogens. Routine Ab screening for a large panel of pathogens and histologic analysis of organs and tissues were performed to ensure that mice were pathogen free. C57BL/6 and BALB/c mice used in immunization studies were 8 to 12 weeks of age. Following anesthesia, mice were nasally immunized on days 0, 7, and 14 with 75 μg OVA in the presence or absence of 0.01 to 5 μg MIP-1α or MIP-1β in 10 μL phosphate-buffered saline (PBS) (5 μL per nare). Control mice received 75 μg OVA and 1 μg cholera toxin in 10 μL PBS, and negative control mice received 75 μg hen egg lysozyme or PBS alone. BALB/c mice of similar age were also immunized to confirm the results obtained using C57BL/6 mice. Experimental groups consisted of 5 mice, and studies were repeated 3 to 5 times. The guidelines proposed by the National Research Council's committee for the Care of Laboratory Animal Resources Commission of Life Sciences were followed to minimize animal pain and distress.
Sample and tissue collection
Fecal samples were weighed and dissolved in PBS containing 0.1% sodium azide (eg, 1 mL per 100 mg of fecal pellet). Following suspension by vortexing for 10 minutes, fecal samples were centrifuged and supernatants were collected for analysis. Nasal and vaginal cavities were rinsed 3 times with 50 μL PBS. Blood samples were collected by tail vein bleeding, and serum was obtained following centrifugation. Serum and mucosal secretions were collected on days 0, 7, 14, and 21 for OVA-specific Ab analysis by enzyme-linked immunosorbent assay (ELISA). Mice were killed by CO2 inhalation 1 week after the last immunization to quantify the OVA-specific Ab-forming cells (AFCs) and T-cell responses present in immune compartments.
OVA-specific Ab detection by ELISA
Fecal and serum sample levels of OVA-specific Abs were measured by ELISA, as previously described.30 Briefly, 96-well Falcon 3912 flexible ELISA plates (Fisher Scientific, Pittsburgh, PA) were coated with 100 μL of 1 mg/mL OVA in PBS overnight at 4°C and blocked with 1% BSA (Sigma) in PBS (B-PBS) for 3 hours at room temperature. Individual samples (100 μL) were added and serially diluted in B-PBS. After overnight incubation at 4°C and 3 washes using PBS containing 0.05% Tween 20 (PBS-T), titers of immunoglobulin M (IgM), IgG, or IgA were determined by the addition of a 0.33 μg/mL horseradish peroxidase (HRP)–conjugated goat antimouse μ, γ, or α heavy chain–specific antisera (Southern Biotechnology Associates, Birmingham, AL) in B-PBS-T. Similarly, 100 μL biotin-conjugated rat antimouse γ1 (G1-7.3 at 12.5 ng/mL), γ2a (R19-15 at 125 ng/mL), γ2b (R12-3 at 12.5 ng/mL), γ3 (R40-82 at 50 ng/mL), and ε (G1-7.3 at 1.25 μg/mL) (PharMingen, San Diego, CA) heavy chain–specific mAbs were used to determine IgG subclass and IgE isotype titers.30 After incubation and wash steps, 100 μL of 0.5 μg/mL HRP-antibiotin Ab (Vector Laboratories, Burlingame, CA) in B-PBS-T or 500 ng/mL poly-HRP80 streptavidin (Research Diagnostics, Flanders, NJ) in Poly-HRP Diluent (Research Diagnostics) was added to IgG subclass or IgE detection wells, respectively, and incubated for 3 hours at room temperature. Following incubation, the plates were washed 6 times and the color reaction for ELISA was developed by adding 100 μL of 1.1 mM 2,2′-azino-bis(3)-ethylbenzthiazoline-6-sulfonic acid (Sigma) in 0.1 M citrate-phosphate buffer (pH 4.2) containing 0.01% H2O2 (ABTS solution). End-point titers were expressed as the reciprocal log2 of the highest dilution, which indicated an optical density that was 415 nm (OD415) of at least 0.1 OD unit above the OD415 of negative controls after a 20-minute incubation.30
Cell isolation
Single-cell suspensions of spleen, Peyer patches, nasal tract, and cervical lymph nodes were prepared by aseptically removing tissues and then passing them through a sterile wire screen. Lower respiratory tract tissues were excised, minced, and further disrupted by stirring in collagenase type IV (Sigma) in RPMI 1640 (collagenase solution) during incubation at 37°C.30 After removal of Peyer patches, the small intestine was cut into 1 cm strips and stirred in PBS containing 1 mM EDTA (ethylenediaminetetraacetic acid) at 37°C for 30 minutes. Next, intestinal lamina propria lymphocytes were isolated by digesting tissue in the collagenase solution for about 45 minutes with stirring at 37°C. Lymphocytes were further purified using a discontinuous Percoll (Pharmacia, Uppsala, Sweden) gradient, collecting at the 40% to 75% interface.30 Cell suspensions were washed twice in RPMI 1640. Lymphocytes were maintained in complete medium, which consisted of RPMI 1640 supplemented with 10 mL/L nonessential amino acids (Mediatech, Washington, DC), 1 mM sodium pyruvate (Sigma), 10 mM HEPES (N-2-hydroxyethylpiperazine-N′-2-ethanesulfonic acid) (Mediatech), 100 U/mL penicillin, 100 μg/mL streptomycin, 40 μg/mL gentamycin (Elkins-Sinn, Cherry Hill, NJ), 50 μM mercaptoethanol (Sigma), and 10% fetal calf serum (FCS) (Atlanta Biologicals, Norcross, GA). T-cell fractions were obtained by passing single-cell suspensions over nylon wool for 1 hour at 37°C (more than 95% purity).
IgA, IgM, and IgG enzyme-linked immunospot (ELISPOT) analysis
An ELISPOT assay was used to detect total or OVA-specific AFCs.30 In brief, 96-well Millititer HA nitrocellulose-based plates (Millipore, Bedford, MA) were coated with 100 μL of 1 mg/mL OVA in PBS, PBS only (negative control), or 0.5 μg/mL goat antimouse Ig (H+L) polyclonal Ab (positive control) (Southern Biotechnology Associates) and incubated overnight (12 hours) at 4°C. Subsequently, wells were blocked with B-PBS for 2 hours and washed with complete media. Whole cells were added to wells in duplicate at 1 × 10⁶/mL, 5 × 10⁵/mL, and 1 × 10⁵/mL concentrations in complete medium and incubated for 6 hours at 37°C in 5% CO2. After washing with PBS-T, individual AFCs were detected with HRP-labeled goat antimouse μ, γ, or α chain–specific Abs (1 μg/mL) (Southern Biotechnology Associates), visualized by adding 3-amino-9-ethylcarbazole (AEC) buffer (Moss, Pasadena, MD), and counted using a dissecting microscope (SZH Zoom Stereo Microscope System; Olympus, Lake Success, NY).
Ag-specific T-helper cell responses
Purified T cells were cultured at a density of 5 × 10⁶/mL with 1 × 10⁶/mL T cell–depleted and irradiated 30 Gy (3000 rad) splenic feeder cells in complete medium containing OVA (1 mg/mL) at 37°C in 5% CO2. T cells were cultured in 96-well round-bottom plates (Corning Glass Works, Corning, NY) to determine Ag-specific proliferative responses. After 3 days of culture, cells were pulsed with 0.5 μCi (0.0185 MBq) methyl-3H-thymidine (Amersham Life Sciences, Arlington Heights, IL) per well for 18 hours. Cells were harvested on glass microfiber filter paper (Whatman, Clifton, NJ), and radioactivity levels were obtained by liquid scintillation counting.
Effects of MIP-1α and MIP-1β on resting and OVA-stimulated DO11.10 primary lymphocytes
Splenocytes from DO11.10 mice were isolated and added at a density of 1 × 10⁶ cells per milliliter in complete medium containing 0, 1, 10, 100, or 1000 ng/mL MIP-1α and MIP-1β. A class II–restricted OVA peptide containing amino acids 323 to 339 (50 μg/mL) was used to activate primary OVA-specific T-cell receptor (TCR) transgenic CD4+ T cells from DO11.10 mice.32 Lymphocytes were also cultured with optimal doses of concanavalin A (ConA; 5 μg/mL) or antimouse CD3ε mAb (10 μg/mL–coated plates) as positive controls or alone as negative controls. After incubation for 2 days, cells were stained with phycoerythrin (PE)–conjugated rat antimouse CD28, CD30, CD37, CD80, CD86, CD154, or CD153 (PharMingen) and Cy5-conjugated CD4, and/or B220, fluorescein isothiocyanate (FITC)–conjugated MAC-1 and/or CD8 mAbs (PharMingen) for 30 minutes with agitation. Lymphocytes were then washed with fluorescence-activated cell sorter (FACS) buffer (PBS with 1% BSA) and fixed in 2% paraformaldehyde in PBS and analyzed by flow cytometry using a FACSCaliber (Becton Dickinson, San Jose, CA).
Cytokine analysis by ELISA
For the assessment of cytokine production, 800 μL of culture supernatants from 24-well flat bottom plates (Corning Glass Works) was harvested after 2 days of incubation. The T-helper (Th) cytokines, IL-2, IL-4, IL-5, IL-6, IL-10, TNF-α, IFN-γ, and granulocyte-macrophage colony-stimulating factor (GM-CSF), in cell culture supernatants were determined by ELISA following the manufacturer's instructions (E-Biosciences, San Diego, CA). The IL-5 cytokines in culture supernanatants were determined as described previously by Lillard et al.30 Briefly, Falcon 3912 Microtest plates (Fischer Scientific) were coated with 100 μL of 2.5 μg/mL rat antimouse IL-5 (PharMingen) in 0.1 M bicarbonate buffer (pH 9.5) overnight at 4°C and blocked with 3% BSA in PBS at room temperature for 3 hours. Next, serially diluted recombinant murine cytokines as standards (PharMingen) or cultured supernatant samples were added in duplicate and incubated overnight at 4°C. The plates were washed with PBS-T and incubated with 0.2 μg/mL biotinylated secondary murine cytokine detection Abs (PharMingen) in B-PBS-T at room temperature for 3 hours. After washing with PBS-T and PBS, wells were incubated for 2 hours in 100 μL of 0.5 μg/mL peroxidase-conjugated antibiotin Ab (Vector Laboratories) and developed with ABTS solution, as described above. The cytokine ELISA assays were capable of detecting 15 pg/mL IFN-γ; 5 pg/mL IL-2, IL-4, and IL-5; 100 pg/mL IL-6; and 200 pg/mL IL-10.
In vitro T-cell proliferation assay
Proliferating T lymphocytes were labeled with 5-bromo-2′-deoxy uridine (BrdU, Roche Diagnostics, Dusseldorf, Germany); subsequently, BrdU incorporation was detected using a scanning multiwell spectrophotometer (SpectraMax 250 ELISA reader, Molecular Devices, Sunnyvale, CA). In brief, after 2 days of culture, cells at a density of 1 × 10⁶/mL were transferred in polystyrene 96-well plate (Corning Glass Works). An aliquot of 10 μL BrdU labeling solution (10 μm/mL) per well was added and incubated for 18 hours at 37°C in a humidified atmosphere containing 5% CO2. The cells were then fixed and incubated with 100 μL nuclease in each well for 30 minutes at 37°C. The cells were washed with complete media and again incubated with BrdU solution for 30 minutes at 37°C. The incorporation was developed in ABTS solution, and the optical density was read at 450 nm.
Cytotoxic T lymphocyte (CTL) analysis
The CD8+ T-cell subset from the cervical lymph nodes, Peyer patches, and spleen were isolated and purified as described above and restimulated ex vivo with the class I–restricted peptide of OVA257-264 (SIINFEKL) for 5 days with syngeneic EL4 feeder cells.33 The cytotoxic T lymphocyte (CTL) response was determined by a 4-hour 51Cr release assay using E.G7.OVA target cells.34
Statistics
The data are expressed as the mean ± 1 SEM and compared using a 2-tailed Student t test or an unpaired Mann-WhitneyU test. The results were analyzed using the Statview II statistical program (Abacus Concepts, Berkeley, CA) for Macintosh computers and were considered statistically significant if Pvalues were less than .05. When cytokine levels were below the detection limit (BD), they were recorded as one half the lower detection limit (eg, 50 pg/mL for IL-6) for statistical analysis.
Results
MIP-1α and MIP-1β stimulate OVA-specific systemic Ab responses
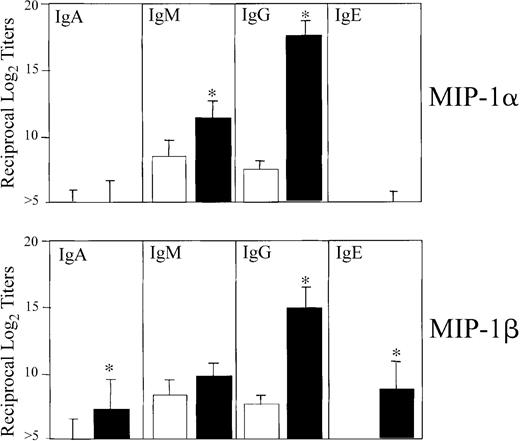
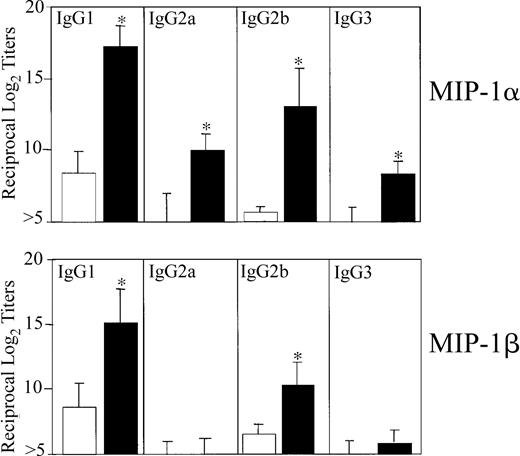
We first determined the optimal dose of MIP-1α and MIP-1β that would affect Ag-specific serum Ab responses. For this purpose, mice were nasally administered 3 times at weekly intervals with OVA (75 μg) in the presence of increasing concentrations of the 2 chemokines (eg, 0.0, 0.01, 0.1, 1.0, and 5.0 μg). Accordingly, we analyzed OVA-specific Ab isotypes and IgG subclasses in sera and mucosal secretions. Significant titers of OVA-specific Ab responses were elicited when mice were given a 1.0 μg dose of MIP-1α or MIP-1β, and the Ab responses were not further increased when chemokine doses were increased (data not shown). Therefore, a dose of 1 μg MIP-1α or MIP-1β was used for subsequent in vivo experiments. Mice nasally immunized 3 times with OVA plus 1 μg MIP-1α or MIP-1β displayed significantly increased Ag-specific serum IgG Ab levels (Figure1). Serum IgE and IgA Ab responses were noted only in mice that received MIP-1β but not MIP-1α (Figure 1). Both molecules clearly exerted different effects on serum IgG subclass responses. The humoral adjuvant activity of MIP-1α induced significant increases in anti-OVA IgG1 and IgG2b Ab titers followed by IgG2a and IgG3, while MIP-1β only induced IgG1 and IgG2b Ab responses (Figure 2).
OVA-specific serum IgA, IgM, IgG, and IgE Ab responses following nasal immunization with MIP-1α or MIP-1β.
Groups of 5 C57BL/6 mice were nasally immunized on days 0, 7, and 14 with 75 μg OVA and 0.0 (■) or 1.0 μg MIP-1α or MIP-1β (▪) in PBS. The data presented are the mean Ab titers ± SEMs of 3 separate experiments. ELISA determined the distribution of OVA-specific serum and fecal Ab titers on day 21. Asterisks indicate statistically significant differences (P < .05) from Ab titers of mice immunized with OVA alone.
OVA-specific serum IgG subclass Ab responses following nasal immunization with MIP-1α or MIP-1β.
Groups of 5 C57BL/6 mice were nasally immunized on days 0, 7, and 14 with 75 μg OVA and 0.0 (■) or 1.0 μg MIP-1α or MIP-1β (▪) in PBS. The data presented are the mean IgG subclass Ab titers ± SEMs of 3 separate experiments. ELISA determined the distribution of OVA-specific serum and fecal Ab titers on day 21. Asterisks indicate statistically significant differences (P < .05) from Ab titers of mice immunized with OVA alone.
MIP-1β and MIP-1α effects on mucosal IgA Ab responses
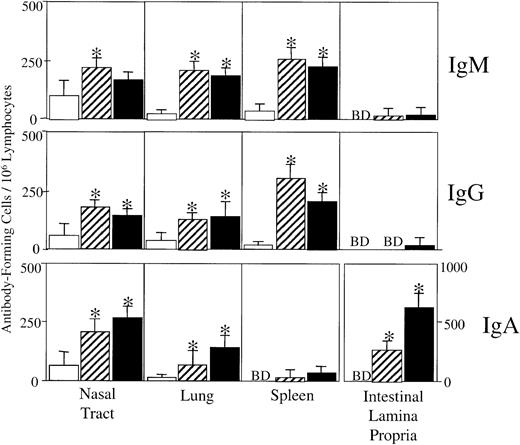
We next asked whether the adjuvant activity of nasally coadministered MIP-1α or MIP-1β could promote mucosal secretory IgA Ab responses. Analysis of OVA-specific S-IgA Ab responses in mucosal secretions revealed significant S-IgA Ab titers in fecal extracts as well as vaginal and nasal washes of mice nasally immunized with OVA plus MIP-1α or MIP-1β (Table 1). These results were further confirmed by analysis of OVA-specific AFCs in cells isolated from mucosal and systemic tissues. Mice that received OVA alone did not display substantial Ag-specific AFCs in any of the tissues analyzed (Figure 3). Both MIP-1α and MIP-1β increased OVA-specific IgM and IgG AFCs in splenic and respiratory tract cell isolates but not in intestinal lamina propria–derived cells (Figure 3). We noted the presence of significant IgA AFCs in tissues from mice immunized with MIP-1β but limited IgA AFC generation by MIP-1α (Figure 3). These results suggest that the nasal delivery of MIP-1α or MIP-1β enhanced OVA-specific peripheral IgG Ab responses, while MIP-1β significantly stimulated S-IgA Abs.
Ag-specific mucosal IgA Ab responses following nasal immunization with MIP-1α or MIP-1β and OVA*
| Vaccine . | End-point titers of anti-OVA IgA Abs . | ||
|---|---|---|---|
| Feces . | Vaginal wash . | Nasal wash . | |
| OVA only | ≤2 | ≤2 | ≤2 |
| MIP-1α plus OVA | 76.8 ± 7.5† | 22.5 ± 3.2† | 9.2 ± 1.8† |
| MIP-1β plus OVA | 153.1 ± 25.3† | 60.8 ± 8.1† | 14.8 ± 1.6† |
| Vaccine . | End-point titers of anti-OVA IgA Abs . | ||
|---|---|---|---|
| Feces . | Vaginal wash . | Nasal wash . | |
| OVA only | ≤2 | ≤2 | ≤2 |
| MIP-1α plus OVA | 76.8 ± 7.5† | 22.5 ± 3.2† | 9.2 ± 1.8† |
| MIP-1β plus OVA | 153.1 ± 25.3† | 60.8 ± 8.1† | 14.8 ± 1.6† |
Groups of 5 C57BL/6 mice were nasally immunized on days 0, 7, and 14 with 75 μg OVA and 0.0 or 1.0 μg MIP-1α or MIP-1β. The data presented are the mean Ab titers ± SEMs of 3 separate experiments. ELISA determined the distribution of OVA-specific serum and fecal Ab titers on day 21.
Statistically significant differences (P < .05) of Ab titers of mice that received OVA alone.
OVA-specific AFCs in spleen, nasal tract, lung, and intestinal lamina propria.
Groups of 5 C57BL/6 mice were nasally immunized on days 0, 7, and 14 with 75 μg OVA and 0.0 (■)or 1.0 μg MIP-1α (▨) or MIP-1β (▪) in PBS. Levels of OVA-specific AFCs present in spleen, intestinal lamina propria, and respiratory tracts, including associated lymphoid tissue, were determined by ELISPOT analysis 7 days after the last immunization. AFCs below detectable levels (fewer than 10 AFCs per 106 lymphocytes) are designated BD. The data presented are the mean AFCs ± SEMs, in duplicate cultures, of 3 separate experiments. Asterisks indicate statistically significant differences (P < .05) from AFCs of mice immunized with OVA alone.
Proliferation and cytokine secretion by MIP-1α– and MIP-1β–induced OVA-specific T cells
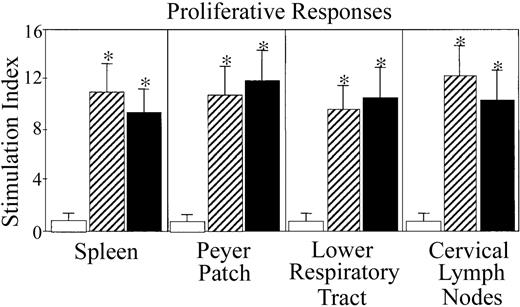
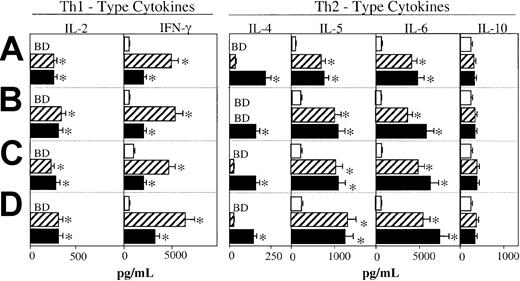
Because MIP-1α and MIP-1β differentially regulated mucosal and systemic Ab responses, we next examined whether the differences in their effects could be attributed to their ability to differentially promote Th1- versus Th2-type cytokine responses. The CD4+ T cells isolated from the lower respiratory tract, Peyer patches, cervical lymph nodes (CLNs), or spleens of mice immunized with OVA in the presence of MIP-1α or MIP-1β exhibited marked increases in OVA-specific proliferative responses in comparison with CD4+ T cells derived from control mice that received OVA alone (Figure 4). In addition, these chemokines enhanced the splenic-, Peyer patch–, lower respiratory tract–, and CLN-derived Th cell–derived responses to in vitro restimulation with OVA. In fact, CD4+ T cells from these inductive lymphoid tissues of mice immunized with either MIP-1α or MIP-1β exhibited greater IFN-γ secretion when compared with CD4+ T cells from control mice given OVA only (Figure5). IFN-γ responses were always higher in groups that received MIP-1α. On the other hand, MIP-1β promoted higher levels of Th2 cytokine responses (ie, IL-4, IL-5, and IL-6) by ex vivo–restimulated OVA-specific T cells (Figure 5). Thus, MIP-1α and, to a lesser degree, MIP-1β promote IFN-γ and Th1-type responses, while IL-4 and Th2-type responses were especially induced by MIP-1β.
Proliferation responses by OVA-specific CD4+T cells from mice immunized with OVA plus MIP-1α or MIP-1β.
Groups of 5 C57BL/6 mice were nasally immunized on days 0, 7, and 14 with 75 μg OVA and 0.0 (■)or 1.0 μg MIP-1α (▨) or MIP-1β (▪) in PBS. One week after the last immunization, lower respiratory tract (lung and mediastinal lymph nodes)–, Peyer patch–, spleen-, and CLN-derived T cells were purified and cultured at a density of 5 × 10⁶/mL with 500 μg/mL OVA for 3 days with T cell–depleted, irradiated splenic feeder cells (1 × 10⁶/mL) in complete medium. Experimental groups consisted of 5 mice, and studies were repeated 3 times. Proliferation was measured by 3H-thymidine incorporation. The stimulation index corresponds to counts per minute (cpm) of cell cultures containing OVA divided by the cpm of cultures without OVA. The data presented are the mean stimulation indexes ± SEMs of quadruplicate cultures. Asterisks indicate statistically significant differences (P < .05) from the stimulation index of mice immunized with OVA alone.
MIP-1α and MIP-1β differentially regulate Ag-specific Th cytokine responses.
Groups of 5 C57BL/6 mice were intranasally immunized on days 0, 7, and 14 with 75 μg OVA and 0.0 (■) or 1.0 μg MIP-1α (▨) or MIP-1β (▪) in PBS. One week after the last immunization, spleen- (A), Peyer patch– (B), lower respiratory tract (lung and mediastinal lymph nodes)– (C), and CLN-derived (D) T cells were purified and cultured at a density of 5 × 10⁶/mL with 500 μg/mL OVA for 5 days with T cell–depleted, irradiated splenic feeder cells (1 × 10⁶/mL) in complete medium. Experimental groups consisted of 5 mice, and studies were repeated 3 times. Cytokine production of cultured supernatants was determined by ELISA. Th1- and Th2-type cytokine profiles are presented as the mean cytokine levels (picograms per milliliter) ± SEMs of duplicate cultures from each group. Asterisks indicate statistically significant differences (P < .05) from cytokine levels of mice immunized with OVA alone, while cytokines below detectable levels are designated BD.
MIP-1α, but not MIP-1β, promotes mucosal and systemic CD8+ CTL responses
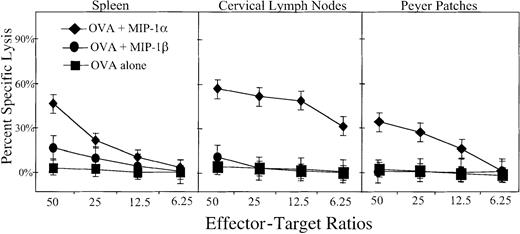
It was important to establish whether MIP-1α and/or MIP-β support CTL responses. For this purpose, CLN, Peyer patch, and spleen CD8+ T cells were assessed for their cytotoxic T-cell activity. No specific CTL response was noted in CLN, Peyer patch, or spleen cells from control mice immunized with OVA only or MIP-1β plus OVA. In contrast, cells from mice that received the MIP-1α plus OVA showed dramatic increases in the percent cell lysis of the H-2b–restricted EG7.OVA tumor cell line34; interestingly, increased CTL responses were seen in cells isolated from both mucosal and systemic immune compartments (Figure6).
MIP-1α– and MIP-1β–mediated OVA-specific CTL responses.
Groups of 5 C57BL/6 mice were nasally immunized on days 0, 7, and 14 with 75 μg OVA and 0.0 (▪) or 1.0 μg MIP-1α (♦) or MIP-1β (●) in PBS. One week after the last immunization, spleen-, Peyer patch–, and CLN-derived CD8+ lymphocytes were purified and restimulated ex vivo with OVA peptide 257-264 (SIINFEKL) for 5 days with syngeneic EL4 cells in complete medium. Experimental groups consisted of 5 mice, and studies were repeated 3 times. The cytotoxic response was determined by 4-hour 51Cr release against E.G7.OVA or OVA peptide 257-264 (SIINFEKL) pulsed EL4 cells. Data shown are mean values of triplicates obtained at varying effector-target ratios as indicated.
Effects of MIP-1α and MIP-1β differentially regulate costimulatory molecule expression by Ag-presenting cells in vitro
The adjuvant effects of cholera toxin (CT) have been attributed to the ability of this enterotoxin to up-regulate CD86 expression.35 Earlier studies with RANTES showed that it enhances CD80 but not CD86 expression.33 To better elucidate the mechanisms underlying the adjuvant effects of MIP-1α and MIP-1β, we assessed their potential to modulate the expression of costimulatory molecules (ie, CD80, CD86, and CD40) on B cells and that of corresponding receptors (ie, CD28 and CD154/gp39) on T cells.
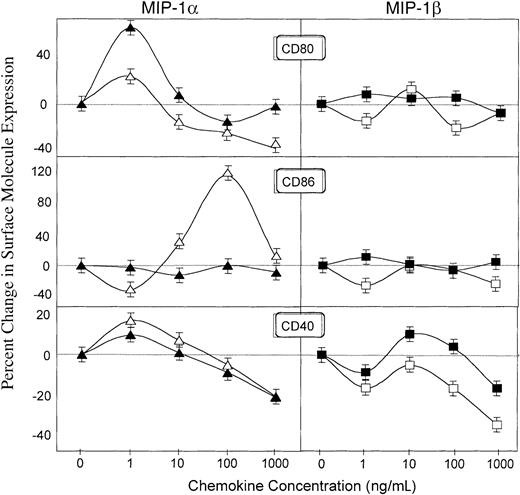
Results depicted in Figure 7 clearly show that MIP-1α and MIP-1β differentially regulate costimulatory molecule expression. MIP-1α but not MIP-1β enhanced CD80 expression by both resting and Ag-stimulated B cells from DO11.10 mice (Figure 7). The stimulatory effect of MIP-1α was also seen on CD86 expression by resting B cells while MIP-1α did not significantly affect CD86 expression by resting or OVA-stimulated B cells (Figure 7). CD40 expression on resting and OVA-stimulated B cells was also up-regulated by MIP-1α, but only OVA-stimulated B cells showed increased CD40 expression after treatment with MIP-1β (Figure 7). The same pattern of effects was seen on macrophages (CD11b+) where MIP-1α but not MIP-1β up-regulated CD80 and CD86 expression (data not shown).
Regulation of CD80, CD86, and CD40 expression by B220+ cells by MIP-1α and MIP-1β.
Splenocytes from DO11.10 mice were incubated with 0, 1, 10, 100, or 1000 ng/mL MIP-1α (triangles) or MIP-1β (squares) in plates containing 0 (open symbols) or 500 (filled symbols) μg/mL OVA. The percent increase (or decrease) of the costimulatory molecule expression by resting (open symbols) or OVA-activated (filled symbols) lymphocytes was calculated as the percent of double-positive B220+ and CD80+, CD86+, or CD40+ cells in cultures containing MIP-1α or MIP-1β minus the percent gated of double-positive cells in cultures without these chemokines, divided by the latter. Studies were repeated 3 times, and the data presented are the mean percent changes ± SEMs of these experiments.
MIP-1α and MIP-1β differentially regulate costimulatory molecules on T cells
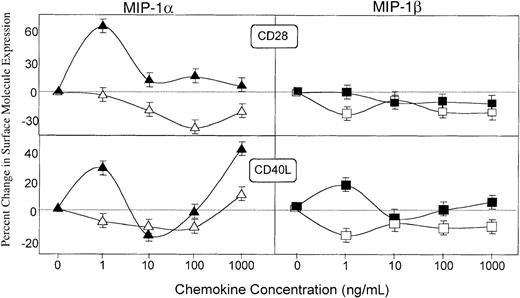
To further establish the differences of MIP-1α and MIP-1β effects on distinct regulation of costimulatory signals, we next assessed their potential to modulate the expression of receptors for costimulatory molecules expressed by T cells. MIP-1α significantly increased the expression of CD28 and CD154 (ie, CD40L and gp39) by OVA-stimulated CD4+ T cells; on the other hand, MIP-1β promoted only modest increases in CD154 expression by OVA-stimulated CD4+ T cells (Figure8). MIP-1β did not affect CD28 expression by either resting or OVA-stimulated CD4+ T cells. The same pattern of regulatory effects by MIP-1α and MIP-1β were observed by CD8+ T cells. In contrast with the effect on CD4+ T cells, MIP-1β failed to stimulate CD40L expression by Ag-stimulated CD8+ T cells (data not shown).
Regulation of CD28 and CD154 (CD40L) expression on CD4+ cells by MIP-1α and MIP-1β.
Spleen cells from DO11.10 mice were incubated with 0, 1, 10, 100, or 1000 ng/mL MIP-1α (triangles) or MIP-1β (squares) in plates containing 0 (open symbols) or 500 (filled symbols) μg/mL OVA. The percent increase (or decrease) of the costimulatory molecule expression by resting (open symbols) or OVA-activated (filled symbols) T cells was calculated as the percent of double-positive CD4+ and CD28+ or CD154+ cells in cultures containing MIP-1α or MIP-1β minus the percent gated of double-positive cells in cultures without these chemokines, divided by the latter. Studies were repeated 3 times, and the data presented are the mean percent changes ± SEMs of these experiments.
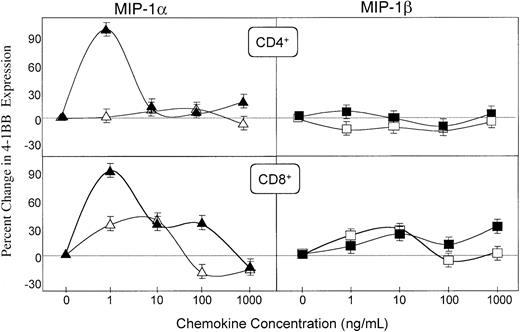
We finally investigated the effect of MIP-1α and MIP-1β on the expression of CD137 (4-1BB) by CD4+ and CD8+ T cells, because this molecule has been associated with the preferential development of CTL and Th1-type responses.36-40 MIP-1α dramatically increased the expression of 4-1BB on both OVA-activated CD4+ and CD8+ T cells (Figure9). On the other hand, MIP-1β did not enhance CD137 expression by CD4+ T cells and only modestly up-regulated the expression of this molecule on CD8+ T cells. Taken together, our findings suggest that the differential adjuvant activity of MIP-1α and MIP-1β could result from their distinct effects on the expression of T- and B-cell costimulatory molecules.
Regulation of CD137 (4-1BB) expression on CD4+ and CD8+ cells by MIP-1α and MIP-1β.
Spleen cells from DO11.10 mice were incubated with 0, 1, 10, 100, or 1000 ng/mL MIP-1α (triangles) or MIP-1β (squares) in plates containing 0 (open symbols) or 500 (filled symbols) μg/mL OVA. The percent increase (or decrease) of the costimulatory molecule expression by resting (open symbols) or OVA-activated (filled symbols) T cells was calculated as the percent of double-positive CD4+ or CD8+ and 4-1BB+ cells in cultures containing MIP-1α or MIP-1β minus the percent gated of double-positive cells in cultures without these chemokines, divided by the latter. Studies were repeated 3 times, and the data presented are the mean percent changes ± SEMs of these experiments.
Discussion
The spectrum of mucosal cells expressing MIP-1α– and MIP-1β–specific receptors as well as the ability of these chemokines to attract lymphocytes and affect the outcome of Th1- and Th2-mediated disease pathologies provided the rationale to test the effects of MIP-1α and MIP-1β on acquired mucosal immunity. The results reported here support our hypothesis that MIP-1α and MIP-1β are able to enhance the development of both humoral as well as cellular mucosal and systemic immunity. For the first time, we have also shown that MIP-1α– and MIP-1β–mediated immunity is fostered by differential regulation of costimulatory molecule expression for support of humoral and cell-mediated immune responses.
Immunization of mice with OVA and MIP-1α or MIP-1β enhanced Ag-specific serum and mucosal Ab and CD4+ T-cell proliferative and cytokine responses in systemic and mucosal compartments. Previous studies in our laboratory have shown that the classical mucosal adjuvant, CT, can induce Ag-specific IgE and IgG1 Ab titers.41 However, when RANTES was used as an adjuvant, Ag-specific serum IgG subclass Ab responses were predominantly IgG2a, followed by IgG2b, IgG3, and IgG1 OVA-specific titers.31However, nasal immunization regimens that use soluble protein Ag often result in higher IgG1 Ag-specific Ab titers.42,43 In this regard, both MIP-1α and MIP-1β supported OVA-specific IgG1 and IgG2b responses. The cytokine IL-4 supports IgG1 and IgE Ab generation and production44-46; hence, the levels of anti-OVA IgG1 Abs were consistent with the observed cytokine secretion by OVA-restimulated CD4+ T cells of MIP-1α– and MIP-1β– treated mice. Interestingly, the Ag-induced secretion of IL-4 was most pronounced in CD4+ T lymphocytes from mice immunized with MIP-1β plus OVA.
IFN-γ production is often associated with IgG2a and IgG3 Ab production47 and may account for the MIP-1α– and MIP-1β–mediated anti-OVA IgG2a and IgG3 Ab responses. Even low doses of IFN-γ (1500 units) have been shown to increase IgG2a production in vivo, while considerably higher doses of IFN-γ (12 500 units) are required to induce decreases in IgG1 and IgE responses.48In fact, the Ag-specific IFN-γ responses were greatest in mice immunized with MIP-1α plus OVA, which correlates with the MIP-1α–induced increases in OVA-specific IgG2a and IgG3 Ab responses. Taken together, the analysis of the OVA-specific humoral and T-helper responses revealed that MIP-1α yields a mixed Th1- and Th2-type response with strong IFN-γ and lower IL-4, while MIP-1β generates a predominate Th2 response.
The precise cytokine signals required for S-IgA production are not completely understood, and studies support that both Th1- and Th2-type cell–derived cytokines are important for S-IgA.49-51 We have previously shown that chemokines like lymphotactin and RANTES also induce S-IgA.30 31 Clearly, serum and mucosal Ag-specific Ab responses were enhanced by MIP-1α and MIP-1β. However, MIP-1β yielded higher increases in S-IgA responses in fecal, nasal, and vaginal secretions. In confirmation, anti-OVA AFCs observed in the spleen, intestinal lamina propria, nasal tract, and lung confirmed the Ag-specific IgA Abs detected in the corresponding mucosal secretions. The heightened IgA Ab response generated by MIP-1β also correlates with the predominant Th2 > Th1 cytokine response induced by this chemokine.
We have also shown that the cytokine responses promoted by these chemokines, particularly MIP-1α, can induce significant Ag-specific CTLs in both systemic and mucosal tissues. No doubt, the Th1 > Th2 profile of CLN, Peyer patch, and splenic lymphocytes from the MIP-1α–treated mice also supported the observed Ag-specific CTL responses. This response was mediated by CTLs from both mucosal (CLNs and Peyer patches) and systemic (splenic) immune compartments. Our results are clearly consistent with the pattern of cytokine and IgG subclass responses. Most important, our findings demonstrate that CTL responses can be induced in mucosal and systemic tissues by a protein-based vaccine harboring MIP-1α.
Cytokines produced by CD4+ T cells after mucosal administration of MIP-1α or MIP-1β only partially explain the increases in OVA-specific Ab and T-cell responses. While these chemotactic molecules directly aid in the accumulation of lymphocytes at infection or immunization sites, lymphocyte recruitment alone does not ensure the initiation of an adaptive immune response, particularly not a mucosal immune response.52 We have previously shown that MIP-1α and RANTES can increase CD80 expression as well as augment T-cell and Ag-presenting cell (APC) functions.31,33 To address the potential mechanisms that are used by these chemokines to initiate adaptive immune responses, we investigated how MIP-1α and MIP-1β would affect the expression of costimulatory molecules on B cells and corresponding receptors on T cells. Indeed, the mucosal adjuvanticity of CT involves the selective up-regulation of CD86 expression.35 Our previous studies with RANTES have shown that this chemokine positively regulates the expression of CD80, but not CD86, by Ag-presenting cells and CD28, CD40L, CD30, but not 4-1BB, expression by T cells.31 33
MIP-1α significantly up-regulates expression of CD80, like RANTES,33 but also increases CD86 surface levels on resting B cells. In addition to B7 ligands, CD40 is another receptor important for B-cell activation and differentiation.53 We have observed significant changes in CD40L expression by activated T cells cocultured with RANTES.31 A modest yet dose-dependent increase (and subsequent decrease) in CD40 expression was observed following MIP-1α and MIP-1β incubation with Ag-stimulated or resting DO11.10 CD11b+ or B220+ lymphocytes. In general, our data suggest that MIP-1α is more effective at modulating surface expression of costimulatory molecules necessary for activation of APCs.
CD154 (ie, gp39 or CD40L) is considered a major determinant in the outcome of T cell–B cell interactions.53 CD40L stimulation can also drive B-cell activation and IgA production.54,55 The generation and activation of cell-mediated immunity often depends on the availability of and help from CD4+ T cells and requires CD154 interactions.56 57 We show for the first time that MIP-1α is more effective at increasing CD40L expression by T cells than MIP-1β. These results also correspond to the Ag-specific humoral, T-helper, and CTL responses generated by nasal immunization of this chemokine.
CD28 also supplies a coactivation signal for T-cell activation.58,59 Stimulation through CD28 acts in concert with the signals provided by Ag recognition, which result in IL-2 production and subsequent cell division.60 CD28 is also required for mucosal immunity and T cell–mediated immunity.60,61 We have previously shown that RANTES acts as a mucosal adjuvant partly through CD28 up-regulation.31In the current study, we show that MIP-1α induces CD28 expression by Ag-stimulated D011.10 T lymphocytes. These studies suggest that the immune-enhancing potential of MIP-1α, like RANTES, may be mediated by CD28 up-regulation.
4-1BB is preferentially expressed by Th1-type T cells, and naive T cells can be led to differentiate to Th1-type T cells after 4-1BB and CD28 stimulation.37,62 4-1BB is also necessary for optimal induction, amplification, and persistence of CTL responses.39 MIP-1α up-regulated 4-1BB expression by Ag-stimulated CD4+ and CD8+ T cells from DO11.10 mice. However, MIP-1β failed to stimulate 4-1BB expression by CD4+ T cells and only moderately up-regulated the expression of this molecule on CD8+ T cells. This observation supports the predominant Th1-type pattern and cell-mediated immune responses in mice that received MIP-1α versus MIP-1β.
Our results show that both Th1- and Th2-type pathways can be induced by mucosally administered MIP-1α and MIP-1β. We have shown that, under certain conditions, MIP-1α and MIP-1β can reduce or enhance immune cell functions. Perhaps due to the importance of chemokines in host immunity, a number of pathogens have evolved endogenous chemokine homologs and binding proteins that presumably interfere with host immunity so that these microbes can evade immune detection.16,63-72 Besides chemotaxis, our data suggest that chemokines such as lymphotactin,30RANTES,31 and now MIP-1α and MIP-1β can serve as potent and effective modulators of adaptive mucosal immunity (humoral and cell-mediated). Further studies will be needed to elucidate the precise contributions that chemokines and their receptors make to the generation of acquired immunity. Our results have clarified the roles that MIP-1α and MIP-1β play in mucosal and systemic humoral as well as cell-mediated immunity. Not only do chemokines mediate acute immune cell functions (ie, inflammation), our findings imply that chemokines affect adaptive immunity (ie, cytokine secretion, Ab formation, CTL activity, and costimulatory molecule expression).
This paper benefited from many fruitful conversations with members of the Morehouse School of Medicine, the University of Alabama at Birmingham Immunobiology Vaccine Center, and the National Institutes of Health's National Institute on Aging.
Prepublished online as Blood First Edition Paper, September 12, 2002; DOI 10.1182/blood-2002-07-2305.
Supported in part by the United Negro College Fund (UNCF)–Merck Postdoctoral Fellowship, Foundation for Digestive Health and Nutrition Research Scholar Award, and National Institutes of Health grants RR03034, GM08248, DK58967, AI18958, AI43197, DC04976, and P30 DK54781.
The publication costs of this article were defrayed in part by page charge payment. Therefore, and solely to indicate this fact, this article is hereby marked “advertisement” in accordance with 18 U.S.C. section 1734.
References
Author notes
Jerry R. McGhee, Department of Microbiology, 845 19th St South, BBRB 761, Birmingham, AL 35294; e-mail:mcghee@uab.edu; and James W. Lillard Jr, Department of Microbiology, 720 Westview Dr, Atlanta, GA 30310; e-mail: lillard@msm.edu.

This feature is available to Subscribers Only
Sign In or Create an Account Close Modal