Abstract
CD8α+ and CD8α− dendritic cells (DCs) have been considered as independent DC subpopulations both ontogenetically and functionally during recent years. However, it has been demonstrated that both DC subsets can be generated from a single precursor population, supporting the concept that they do not represent separate DC lineages. By using highly purified splenic CD8α− DCs, which were injected intravenously and traced by means of an Ly5.1/Ly5.2 transfer system, this study shows that CD8α− DCs acquired the phenotypic characteristics of CD8α+ DCs, by a differentiation process involving CD8α, DEC-205, and CD24 up-regulation, paralleled by the down-regulation of CD11b, F4/80, and CD4. These data demonstrate that CD8α+DCs derive from CD8α− DCs, and strongly support that CD8α− and CD8α+ DCs represent different maturation or differentiation stages of the same DC population. Therefore, CD8α+ DCs would represent the last stage of DC differentiation, playing an essential role in the induction of T-cell responses, due to their antigen-presenting potential, cross-priming ability, and capacity to secrete large amounts of key cytokines such as interferon γ and interleukin-12.
Introduction
Despite the extensive research on dendritic cell (DC) biology developed over the last decade, essentially driven by the possibility of exploiting their antigen-presenting cell (APC) potential in vaccination and immunotherapeutic anticancer trials, their origin remains to be unraveled. In the mouse, the wide variety of DC subsets described so far, each of them endowed with unique functional capacities, can be classified on the basis of their CD8α expression. In this sense although CD8α− and CD8α+ DCs have been considered as myeloid- and lymphoid-derived, respectively (for a review, see Banchereau et al1), this concept has been challenged in a recent report by our group demonstrating that both subpopulations can be generated from a unique lymphoid-committed precursor population.2 These findings have been confirmed and extended in a recent report by Weissman and colleagues, showing that both CD8α− and CD8α+ DCs can be derived from either lymphoid- or myeloid-committed precursors.3 Therefore, no experimental evidence supports any longer the concept that CD8α− and CD8α+ DCs represent different DC lineages, and the question of the functional correlation between these DC subpopulations is reopened. Here we demonstrate that highly purified splenic CD8α− DCs isolated from Ly5.2+ C57BL mice acquire the phenotypic characteristics of splenic CD8α+DCs on intravenous transfer into congenic Ly5.1+ C57BL mice, by a differentiation process involving CD8α, DEC-205, and CD24 (heat-stable antigen [HSA]) up-regulation, paralleled by the down-regulation of CD11b (Mac-1), F4/80, and CD4. These results provide the first evidence of the derivation of splenic CD8α+ DCs from the CD8α− subpopulation, and demonstrate conclusively that these DC subsets do not represent independent DC subpopulations either ontogenetically or functionally.
Materials and methods
Mice
For phenotypic experiments 5- to 6-week-old C57BL/6 mice were used. In transfer assays CD8α− DCs were isolated from 5- to 6-week-old C57BL/Ka Ly5.2 (C57BL/Ly5.2) mice and injected into 8-week-old C57BL/6 Ly5.1 Pep3b(C57BL/Ly5.1) mice.
DC-enriched cell fractions
Spleens were cut into small fragments and then digested with collagenase A (0.5 mg/mL; Boehringer-Mannheim, Mannheim, Germany) and DNase I (40 μg/mL, Boehringer-Mannheim) in RPMI 1640 medium supplemented with 5% fetal calf serum (FCS) for 10 minutes at 37°C with continuous agitation. Digested fragments were filtered through a stainless-steel sieve, and cell suspensions washed twice in phosphate-buffered saline (PBS) solution supplemented with 5% FCS and 5 mM EDTA containing 5 μg/mL DNase I. The cells were then resuspended in cold isosmotic Optiprep solution (Nyegaard Diagnostics, Oslo, Norway), pH 7.2, density 1.061 g/cm3, containing 5 mM EDTA, and a low-density cell fraction, accounting for less than 1% of the starting cell population, was obtained by centrifugation at 1700g for 10 minutes. Splenic DC-enriched cell fractions were then treated for 50 minutes at 4°C with a monoclonal antibody (mAb) mixture including anti-CD3 (clone KT3-1.1), anti-B220 (clone RA3-6B2), and antigranulocyte antigen Gr1 (clone RB6-8C5). The unwanted cells were then removed magnetically after incubation for 30 minutes at 4°C with antirat immunoglobulin-coated magnetic beads (Dynabeads, Dynal, Oslo, Norway) at a 7:1 bead-to-cell ratio. Analysis of CD11c versus CD8α expression revealed that DC-enriched cell fractions used for phenotypic analysis were composed of more than 60% DCs.
Purification of CD8α− DCs
CD8α− DCs used in transfer experiments were purified from splenic DC-enriched cell fractions, from which CD8α+ DCs were depleted with magnetic beads after incubation with anti-CD8α (clone 53-6.72), by magnetic cell sorting (MACS) with MACS separation columns (Miltenyi Biotec, Bergisch, Germany) after incubation with anti–CD11c-conjugated MACS microbeads (Miltenyi Biotec). After reanalysis the DC fraction had a purity of more than 98% and did not contain CD8α+ DCs as assessed after analysis of CD11c versus CD8α, using the anti-CD8α mAb CT-CD8a (Caltag, San Francisco, CA) recognizing a different epitope than the anti-CD8α mAb 53-6.72 used for magnetic bead depletion.
DC sorting and electron microscopy
For electron microscopy studies CD8α− and CD8α+ DCs were sorted from DC-enriched cell fractions as CD11c+ CD8α− and CD11c+CD8α+ cells, respectively, on a FACSort flow cytometer (Becton Dickinson, Mountain View, CA). The sorted preparation had a purity of more than 98%. DCs were fixed with 1% glutaraldehyde and 1% paraformaldehyde in 0.1 M (pH 7.6) Sørensen phosphate buffer for 1 hour at 4°C, postfixed with 1% OsO4 in the same buffer for 1 hour at 4°C, dehydrated in graded acetone solutions, and embedded in Embed-812 (Electron Microscopy Sciences, Washington, PA). Ultrathin sections (70-80 nm) were counterstained with uranyl acetate and lead citrate and examined with a Jeol 1010 electron microscope (Jeol, Tokyo, Japan).
CD8α− DC transfer experiments
Purified CD8α− DCs (3 × 10⁶cells/mouse) isolated from C57BL/Ly5.2 mice were transferred intravenously into nonirradiated C57BL/Ly5.1 mice, which were analyzed at 18 hours and 2, 3, 4, and 5 days for the presence of donor-type splenic Ly5.2+ DCs.
Flow cytometry
Analysis of splenic DC-enriched fractions and purified CD8α− DCs were performed after triple staining with fluorescein isothiocyanate (FITC)–conjugated anti-CD11c (clone N418), phycoerythrin (PE)–conjugated anti-CD8α (clone CT-CD8a, Caltag), and biotin-conjugated anti-CD8β (clone H35.17.2), anti–DEC-205 (clone NLDC-145), anti-CD24 (HSA, clone M1/69), anti-CD11b (Mac-1, clone M1/70), antimacrophage antigen F4/80 (clone 31-A3-1), anti-CD4 (clone GK1.5), anti–major histocompatibility complex (MHC) class II (clone FD11-54.3), anti-CD86 (B7-2, clone GL1, Pharmingen, San Diego, CA), or anti-CD40 (clone FGK45), followed by streptavidin-tricolor (Caltag). Analysis of donor-type CD8α− DCs in transfer assays was performed after triple staining with FITC-conjugated anti-Ly5.2 (clone AL1-4A2), PE-conjugated anti-CD11c (clone HL3; Pharmingen), and biotin-conjugated anti-CD8α, anti-CD8β, anti–DEC-205, anti-CD24, anti-CD11b, antimacrophage antigen F4/80, anti–T-cell receptor β (TCR-β) chain (clone H57-153-80N), or anti-CD4, followed by streptavidin-tricolor (Caltag). Analyses were performed on a FACSort instrument.
Results
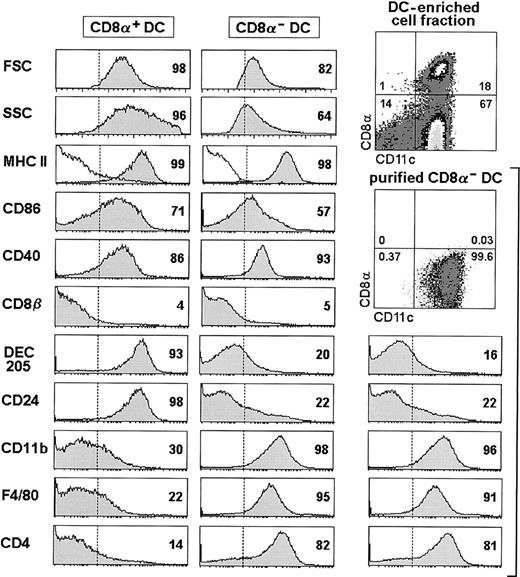
The experimental system used in this study is based on the analysis of the phenotypic changes undergone by splenic CD8α− DCs purified from C57BL/Ly5.2 donor mice on intravenous transfer into C57BL/Ly5.1 congenic mice. In this model, transferred donor-type DCs can be traced using an anti–Ly5.2-specific mAb. The working hypothesis was to address whether CD8α+DCs derive from the CD8α− DC subset by a maturation process involving the up-regulation of CD8α together with the regulation of additional cell surface markers defining CD8α− and CD8α+ DCs subpopulations, such as CD8β, DEC-205, CD24 (HSA), CD11b (Mac-1), F4/80, and CD4. The phenotype of CD8α− versus CD8α+ DCs is illustrated in Figure 1. This analysis has been performed in splenic DC-enriched cell suspensions obtained as described in “Materials and methods,” after gating for CD11c+ CD8α−, or CD11c+CD8α+ cells. CD8α− DCs were CD8β− , DEC-205−/lo, CD24−/lo, CD11bhi, F4/80hi, and CD4+ (CD4 was expressed by 75%-80% of CD8α− DCs). On the other hand, CD8α+ DCs were CD8β−, DEC-205hi, CD24hi, CD11b−/lo, F4/80−/lo, CD4−/lo. Importantly, as previously reported,4 neither splenic nor thymic DCs are positive for CD8β, and therefore CD8α+ DCs express in their surface CD8αα homodimers, in contrast with CD8+ T cells, expressing CD8αβ heterodimers with the exception of thymus-independent intestinal intraepithelial CD8+ T cells, which also express CD8αα homodimers (for a review, see Rocha et al5). This issue is of special relevance in the subsequent experiments, as a criterion to exclude the possibility of CD8 transfer from T cells to DCs. Although CD8α+ DCs displayed slightly higher levels of MHC class II, CD86, and CD40 than CD8α− DCs, these markers were not differentially expressed by CD8α− versus CD8α+ DCs, and therefore they were not considered in subsequent experiments.
Phenotypic analysis of CD8α+ and CD8α− DCs performed on splenic DC-enriched cell fractions.
The phenotype of purified CD8α− DCs is also illustrated. The percentage of cells with a fluorescence intensity over the dotted vertical lines, corresponding to the background staining shown in MHC II histograms (white profiles), is indicated. In CD11c versus CD8α contour plots, the percentage of cells within each quadrant is indicated. Data are representative of 4 independent experiments with similar results. FSC, forward scatter; SSC, side scatter.
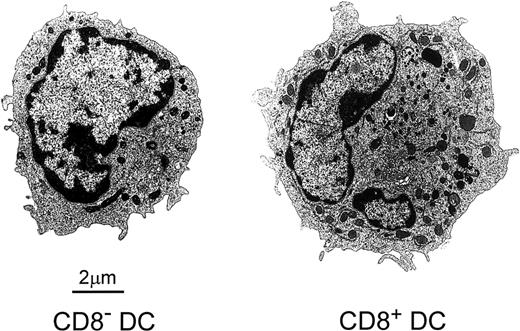
The analysis by electron microscopy of FACS-sorted CD8α−or CD8α+ DCs revealed important ultrastructural differences between them (Figure 2). CD8α− DCs were smaller than their CD8α+counterparts (7.2 ± 0.8 μm versus 9.1 ± 0.9 μm; n = 7). Besides, CD8α− DCs had a rounded nucleus, short microvilli at the cell surface, and few rough endoplasmic reticulum profiles, Golgi cisternae, mitochondria, and endocytic vesicles. On the other hand, CD8α+ DCs displayed the characteristic features described for interdigitating cells located in lymphoid organ T-cell zones,6 that is, an irregularly shaped lobulated nucleus, a complex cell surface with long microvilli, and a clearly defined perinuclear area containing a well-developed Golgi apparatus and numerous mitochondria and endocytic vesicles.
Electron micrographs of FACS-sorted CD8α−and CD8α+ DCs showing their differential ultrastructural characteristics.
See the text for details.
Electron micrographs of FACS-sorted CD8α−and CD8α+ DCs showing their differential ultrastructural characteristics.
See the text for details.
On the basis of the phenotypic profiles described above, CD8α− DCs were purified by negative selection of contaminating cells, including CD8α+ DCs, T cells, B cells, and granulocytes using magnetics beads (M-450 antirat IgGs + antimouse IgGs Dynabeads, Dynal) followed by positive selection using CD11c-conjugated magnetic cell sorting beads (MACS microbeads, Miltenyi Biotec); the purity of the CD8α− DC population was more than 98%. Purified CD8α− DCs displayed an identical phenotype than that described for the same subset in DC-enriched cell suspensions (Figure 1), indicating that the purified CD8α− DC preparation contained actually only CD8α− DCs and did not include contaminating CD8α+ DCs. In addition, no contaminating CD8α+ DCs were detected, after staining with the anti-CD8α mAb CT-CD8a (Caltag) recognizing a different epitope than the anti-CD8α mAb 53-6.72 used for magnetic bead depletion.
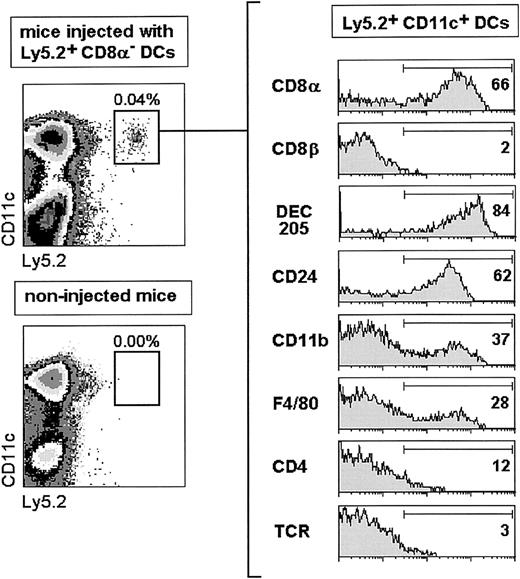
To explore whether CD8α+ DCs could derive from the CD8α− DC subset, purified Ly5.2+CD8α− DCs were transferred intravenously into nonirradiated congenic C57BL/Ly5.1 recipient mice, which were analyzed for donor-type Ly5.2+ DCs in splenic DC-enriched cell suspensions. At day 4 after CD8α− DC transfer (Figure3), donor-type DCs, detected as Ly5.2+ CD11c+ cells, constituted around 0.04% (ie, 0.5-1 × 10⁴ Ly5.2+ DCs/spleen) of the splenic DC-enriched cell suspension. The low percentage of DCs detected in the spleen is in agreement with other reports dealing with the migration, after intravenous or subcutaneous transfer, of both ex vivo- and in vitro-obtained DCs,7-9 and is most likely related to the low viability of DCs after injection and/or to DC retention in other locations such as the liver or the lung.
Analysis of donor-type Ly5.2+ DCs 4 days after transfer of highly purified CD8α− DCs.
The percentage of positive cells for each marker is indicated. TCR expression was used as a negative staining control. Data are representative of 4 independent experiments with similar results.
Analysis of donor-type Ly5.2+ DCs 4 days after transfer of highly purified CD8α− DCs.
The percentage of positive cells for each marker is indicated. TCR expression was used as a negative staining control. Data are representative of 4 independent experiments with similar results.
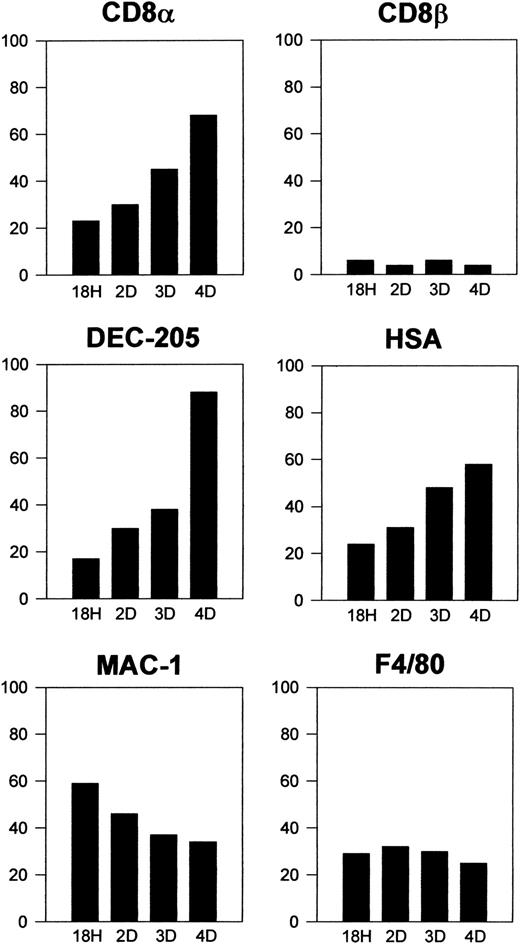
Donor-type DCs that had migrated to the spleen were characterized phenotypically after triple immunofluorescence staining as described in “Materials and methods.” Interestingly, these cells were negative for CD8β but about 60% to 80% of them expressed high levels of CD8α, DEC-205, or CD24 (HSA), and a similar proportion did not express CD11b, F4/80, or CD4. These data revealed that 4 days after transfer more than 60% of CD8α− DCs had up-regulated CD8α and acquired a CD8α+ DC phenotype. As illustrated in Figure 4, showing the kinetics of the process, 18 hours after transfer around 20% of CD8α−DCs had already up-regulated CD8α, DEC-205, and CD24 (HSA) and correspondingly down-regulated CD11b and F4/80, this last marker being expressed by only 20% of DCs as soon as 18 hours after transfer. Differentiation of CD8α− DCs into CD8α+DCs occurred progressively along the first 4 days after transfer when, as mentioned above, approximately two thirds of transferred DCs were CD8α+. Donor-type DCs were almost undetectable by day 5 after transfer.
Kinetics of CD8α− DC differentiation on intravenous transfer.
Histograms represent the percentage of positive cells for the indicated markers at 18 hours and 2, 3, and 4 days after transfer of highly purified CD8α− DCs. Data are representative of 2 (for 18 hours and 2 days) or 4 (for 3 and 4 days) independent experiments with similar results.
Donor-type CD8α+ DCs cannot correspond to contaminating CD8α+ DCs that could have been injected together with CD8α− DCs first because CD8α+ DCs were undetectable within the CD8α− DC preparation injected (see “Materials and methods” and Figure 1, where even the 0.03% of cells present in the upper right quadrant did not represent CD8α+ DCs because of their CD8α levels). Secondly, because if CD8α+ DCs obtained after injection (> 60% of Ly5.2+ DCs after 4 days) were contaminants, that would mean that this minute CD8α+ DC population (in any case constituting < 0.03% of the injected cells) would have migrated with an extremely high efficiency, whereas the CD8α− DCs (constituting > 98% of the cells injected) would have migrated with an almost null efficiency. Importantly, it has been demonstrated that CD8α− DCs migrate more efficiently to the spleen than CD8α+ DCs after intravenous injection, that is, in equivalent experimental conditions to those of our assays.7 Finally, the kinetics of CD8α up-regulation shown in Figure 4 provide further support against the possibility that CD8α+ DCs could represent contaminants of the transferred CD8α− DC preparation.
Discussion
Data presented in this report demonstrate conclusively that CD8α+ DCs can be derived in vivo from CD8α− DCs by a process of differentiation and maturation involving the up-regulation of CD8α+ DC-characteristic markers, such as CD8α, DEC-205, and HSA, that was paralleled by the down-regulation of CD8α− DC markers, such as CD11b, F4/80, and CD4. These results indicate that, in fact, physiologically CD8α+ DCs represent a mature form of CD8α−DCs. Several experimental evidences support this concept:
1. In vivo DC migration studies performed in our laboratory have demonstrated that FITC-induced CD8α− Langerhans cell migration from the epidermis to the draining lymph nodes determined a Langerhans cell maturation process involving CD8α and leukocyte-associated function antigen 1 (LFA-1) up-regulation, generating the lymph node-related CD8αint DC subset.10
2. It has been shown that splenic CD8α− DCs are located at the periphery of the white pulp in relation with the marginal zone, whereas CD8α+ DCs are found in the inner part of the white pulp.11 Interestingly, bacterial lipopolysaccharide (LPS) or soluble Toxoplasma gondiitachyzoite antigen (SATg), known to promote DC maturation causes splenic CD8α− DC migration toward the inner white pulp, where CD8α+ DCs are located, and this is paralleled by the up-regulation of DEC-205,12,13 described as an endocytic receptor expressed in vivo and ex vivo by CD8α+but not by CD8α− DCs.14 Although these reports did not address whether CD8α was up-regulated by CD8α− DCs, they suggested that LPS and STAg actually promoted a CD8α− DC migration/maturation process involving CD8α up-regulation. Similar data, supporting the CD8α up-regulation on CD8α− DC maturation, were provided by a report analyzing Peyer patch CD8− DC migration from the intestinal subepithelial dome to the interfollicular T-cell areas, induced by STAg intravenous administration.15
3. With regard to chemokine receptor expression splenic CD8α− DCs but not CD8α+ DCs are positive for CCR6,16 which has been shown to be expressed by immature DCs, such as DCs differentiated in vitro from bone marrow cells with granulocyte-macrophage colony-stimulating factor (GM-CSF) and tumor necrosis factor α (TNF-α), as well as Langerhans cells.17 18
4. Splenic CD8α+ DCs but not CD8α− DCs produce interleukin-12 (IL-12)19 and, interestingly, the capacity to secrete IL-12 by DCs has been correlated with DC maturation,20 and with in vivo STAg-induced migration of splenic marginal DCs to the white pulp, accompanied by DEC-205 up-regulation.13
On the other hand, the functional correlation between CD8α− DCs and CD8α+ DCs described here contrasts with the hypothesis supported by certain authors during recent years that CD8α− and CD8α+ DCs might represent different DC lineages, particularly myeloid- and lymphoid-derived DCs, respectively. However, this hypothesis has been recently challenged by our data,2 demonstrating that both DC subsets can be generated from the CD4lowlymphoid-committed precursor population. These data were subsequently extended in 2 recent reports showing that CD8α− and CD8α+ DCs could be derived from either lymphoid- or myeloid-committed progenitors.3,21 Therefore, experimental evidence no longer supports the concept that CD8α− and CD8α+ DCs correspond to myeloid and lymphoid DCs, respectively, and represent different DC lineages. Moreover, current information dealing with the derivation of DCs is controversial, and no definitive conclusions can be drawn about the lymphoid or myeloid origin of the different mouse DC subpopulations. Interestingly, on the basis on their results dealing with the differential kinetics of splenic CD8α− and CD8α+ DC differentiation after transfer of lymphoid progenitors versus bone marrow precursors, Manz et al21 proposed that CD8α+ DCs could represent a mature form of the CD8α− DC subset.
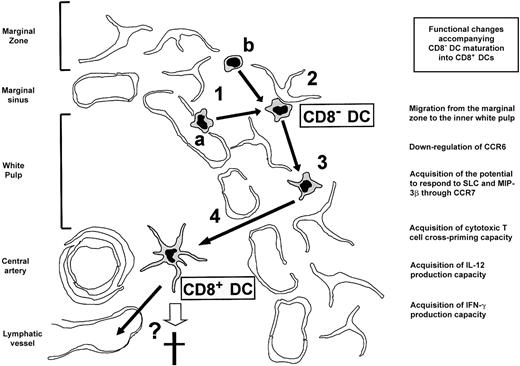
In conclusion, our data and those derived from the reports described above strongly support the view that splenic CD8α− and CD8α+ DCs, considered until recently as representative of different DC lineages, correspond in fact to different maturation/differentiation stages of the same DC population. A model of mouse splenic DC differentiation is presented in Figure5. CD8α− DCs gain access to the splenic marginal zone either from the blood via the marginal sinuses (Figure 5, 1a) or by intrasplenic differentiation from a yet undefined DC precursor (Figure 5, 1b). CD8α− DCs are transiently retained in the reticular meshwork of the marginal zone by interacting with stromal reticular cells (Figure 5, 2) or eventually with other marginal zone cells, such as marginal zone B cells or macrophages. MadCAM-1/α4β7 could be involved in such interactions because the mucosal addressin MadCAM-1 mediates transient interactions between migrating lymphocytes and the endothelial cells of intestinal high endothelial venules, and is expressed by marginal zone reticular cells.22Additionally, chemokine-based mechanisms could participate in this process. Reversal of CD8α− DC retention in the marginal zone (Figure 5, 3) occurs as the result of passive destabilization of cell-to-cell interactions or chemokine receptor desensitization, or massively during an immune response as the consequence of CD8α− DC contact with antigen. CD8α− DCs migrate to the T-cell area of the white pulp (Figure 5, 4) under the control of chemotactic mechanisms that could involve the chemokine receptor CCR7 and its ligands SLC and macrophage inflammatory protein 3β (MIP-3β) known to mediate DC recruitment to the lymph node and Peyer patch T-cell areas.15 23 Migration to the white pulp is accompanied by CD8α up-regulation and acquisition of the additional phenotypic and functional characteristics of CD8α+ DCs. Finally, CD8α+ DCs die in situ or leave the spleen via lymphatic vessels, the kinetics of these processes being most likely greatly influenced by their involvement in an immune response.
Model of DC differentiation in the mouse spleen.
(1) Access of CD8α− DCs to the marginal zone either from the blood via the marginal sinus (a) or by intrasplenic differentiation from an unknown precursor (b). (2) Transient retention of CD8α− DCs in the marginal zone reticular meshwork. (3) Reversal of CD8α− DC retention in the marginal zone. (4) Migration of CD8α− DCs to the inner white pulp accompanied by the acquisition of the phenotypic and functional features of CD8α+ DCs. Finally, CD8α+ DCs die in situ or leave the spleen via lymph vessels (see “Discussion” for a detailed explanation). Principal changes accompanying the proposed maturation of CD8α− DCs into CD8α+ DCs are indicated. IFN-γ indicates interferon γ.
Therefore, a stable CD8α− DC subpopulation located transiently as sentinels in the marginal zone, which represents the most efficient antigen-trapping zone in the spleen, would continuously generate a stable CD8α+ DC subpopulation located in the inner white pulp, by a migration process involving important phenotypical and functional changes. This process would globally determine the acquisition by CD8α+ DCs of a strong potential to induce MHC I- or II-restricted T-cell responses, due to their high antigen presentation efficiency, cross-priming ability,24 and capacity to secrete key cytokines such as interferon γ25 and IL-12.26
Importantly, this model of CD8α− DC maturation provides a convincing explanation to certain DC differentiation anomalies described in genetically modified mice, such as Ikaros C−/− mice,27 PU.1-deficient mice,28 or RelB-deficient mice29 displaying very low numbers of splenic CD8α− DCs, concomitant with important defects in T-cell, B-cell, or myelomonocytic development. According to our model, the absence in Ikaros C−/− mice of B cells, which are required for a correct marginal zone development22 and for splenic expression of MadCAM-1,30 and the existence of a disrupted marginal zone in PU.1- or RelB-deficient mice, would prevent the stabilization in the microenvironment of the marginal zone of CD8α− DCs, that will acquire a CD8α+ DC phenotype immediately on migration to the area surrounding the white pulp.
Additional experiments are being conducted in our laboratory to define conclusively the in vivo differentiation pathway generating the different DC subsets in physiologic conditions.
The authors would like to thank Dr A. Rolink (Basel Institute for Immunology, Basel, Switzerland) for the anti-CD40 hybridoma FGK45.
Supported by the European Commission (grant QLRT-1999-00276), the Comunidad de Madrid of Spain (grant 08.1/0076/2000), and the Ministerio de Ciencia y Tecnologı́a of Spain (grant BOS 2000-0558).
The publication costs of this article were defrayed in part by page charge payment. Therefore, and solely to indicate this fact, this article is hereby marked “advertisement” in accordance with 18 U.S.C. section 1734.
References
Author notes
Carlos Ardavı́n, Department of Cell Biology, Faculty of Biology, Complutense University, 28040 Madrid, Spain; e-mail: ardavin@bio.ucm.es.

