Interleukin-15 (IL-15) induces proliferation and promotes cell survival of human T and B lymphocytes, natural killer cells, and neutrophils. Here we report the constitutive expression of a functional IL-15 receptor (IL-15R) in 6 of 6 myeloma cell lines and in CD38high/CD45low plasma cells belonging to 14 of 14 patients with multiple myeloma. Furthermore, we detected IL-15 transcripts in all 6 myeloma cell lines, and IL-15 protein in 4/6 cell lines and also in the primary plasma cells of 8/14 multiple myeloma patients. Our observations confirm the existence of an autocrine IL-15 loop and point to the potential paracrine stimulation of myeloma cells by IL-15 released from the cellular microenvironment. Blocking autocrine IL-15 in cell lines increased the rate of spontaneous apoptosis, and the degree of this effect was comparable to the pro-apoptotic effect of depleting autocrine IL-6 by antibody targeting. IL-15 was also capable of substituting for autocrine IL-6 in order to promote cell survival and vice versa. In short-term cultures of primary myeloma cells, the addition of IL-15 reduced the percentage of tumor cells spontaneously undergoing apoptosis. Furthermore, IL-15 lowered the responsiveness to Fas-induced apoptosis and to cytotoxic treatment with vincristine and doxorubicin but not with dexamethasone. These data add IL-15 to the list of important factors promoting survival of multiple myeloma cells and demonstrate that it can be produced and be functionally active in an autocrine manner.
Multiple myeloma is characterized by the accumulation of malignant plasma cells in the bone marrow. Because the myeloma cells proliferate and accumulate in close proximity to stromal and hematopoietic cells, a great deal of effort has focused on identifying factors responsible for the survival and growth of the neoplastic clone in the stromal matrix. Some of these soluble factors are produced and secreted by cells of the microenvironment,1,2 while others are produced by the myeloma cells themselves. These include interleukin-1β,3,4 interleukin-6 (IL-6),4,5transforming growth factor β,4 tumor necrosis factor β,6 granulocyte colony-stimulating factor,4and macrophage colony-stimulating factor.7 IL-6, a potent growth factor for murine hybridomas and plasmacytomas, is at present considered the most relevant growth and survival factor for human multiple myeloma as well.5,8,9 The function of IL-6 as survival factor is demonstrated by its ability to inhibit apoptosis induced by growth factor withdrawal,10,11dexamethasone,12 and triggering of the cell-death receptor Fas.13 However, malignant plasma cells lose their IL-6 dependence during in vitro culturing,1which raises the question as to whether unknown cytokines might have the potential to replace IL-6 signaling in promoting survival and growth of myeloma cells.
IL-15, a recently identified cytokine,14 was found to share many biological activities with IL-2, which led to a series of studies on its effect on T cells and on natural killer (NK) cells. These studies revealed that IL-15 stimulated proliferation of cytotoxic T cells14 and regulated survival of NK cells.15Furthermore, a proliferation and differentiation promoting function of IL-15 has also been demonstrated in preactivated human B cells.16 Its inhibitory effects on apoptosis induced by anti-Fas, anti-CD3, anti–immunoglobulin M (anti-IgM) antibodies, or dexamethasone in activated human T and B cells have recently been demonstrated.17 IL-15 not only shares biological activities with IL-2 but also uses the same β-receptor and γ-receptor subunits.18 These subunits are indispensable for signal transmission whereas the α-receptor subunit is responsible for the high-affinity binding of IL-15 to the receptor.18 19 While much attention has been paid to the expression patterns of the IL-15 receptor (IL-15R) components in T cells, there is no information available on IL-15Rα expression in normal and neoplastic B cells during maturation and differentiation. In the present study, we examined whether all components of the IL-15R are expressed in both myeloma cell lines and in native neoplastic plasma cells. Furthermore, the effects of IL-15 on myeloma cell viability and the potential contribution of an autocrine IL-15 loop to the propagation of the neoplastic clone were investigated.
Patients and methods
After the acquisition of informed consent, tumor cells were collected during routine examinations from the bone marrow of 14 patients suffering from multiple myeloma. The patients' characteristics are given in Table 1. The samples were treated with a erythrocyte lysis buffer (NH4Cl, 155 mmol/L; KHCO3, 100 mmol/L; and ethylene diamine tetra-acetic acid [EDTA], 1 mmol/L) to remove erythrocytes. The samples were then washed in RPMI 1640 medium (10% fetal calf serum [FCS]) and immediately analyzed. During flow cytometric analysis, plasma cells were characterized by high expression of CD38 and dim or absent expression of CD45. This 2-color analysis has been described as a reliable identification of plasma cells in peripheral blood and bone marrow.20
Cell lines and culture conditions
The following neoplastic plasma cell lines were used in this investigation: ARH-77; LP-1; MC-Car, the plasmacytoma cell line (The American Type Culture Collection, Rockville, MD); OPM-2, the myeloma cell line, and IM-9, the myeloma/lymphoblastoid cell line (German Collection of Microorganisms and Cell Cultures, Braunschweig, Germany); and RPMI 8226, the myeloma cell line (Dr T Otani, Fujisaki Cell Center, Okayama, Japan). All cell lines and native plasma cells were cultured in RPMI 1640 media (Seromed, Berlin, Germany) at 37°C in a humidified atmosphere containing 5% CO2. The culture was supplemented with heat-inactivated FCS, 10% (Biological Industries, Beth Haemek, Israel); L-glutamine, 2 mmol/L (Seromed); and gentamycin, 100 μg/mL (GIBCO, Grand Island, NY).
Reagents
The following antibodies were used to determine the protein expression levels by flow cytometry: monoclonal mouse antihuman IL-2Rα, IL-2Rβ, and IL-2Rγ antibodies (PharMingen, San Diego, CA); polyclonal goat antihuman IL-15Rα antibody (Santa Cruz Biotechnology, Santa Cruz, CA); murine antihuman Fas (clone UB2; Immunotech, Marseilles, France); antihuman FasL (clone H11; Alexis, Laeufelfingen, Switzerland); antihuman Bcl-2 mAb (Dako, Vienna, Austria); and goat antihuman Bax (Santa Cruz Biotechnology).
Murine antihuman IL-2Rβ monoclonal antibody (mAb) (clone Mik-β2, PharMingen) was used to block IL-15 signaling.21Monoclonal mouse antihuman IL-15 antibody (clone M112; Genzyme Diagnostics, Cambridge, MA) was used in inhibitory experiments and for detection of intracellular IL-15 protein in myeloma cells. Monoclonal mouse antihuman IL-6 antibody (R&D Systems, Minneapolis, MN) was used to block IL-6 signaling. The murine mAbs anti-CD38 (Pharmingen) and anti-CD45 (Becton Dickinson, San Jose, CA) were used for the detection of neoplastic plasma cells in bone marrow aspirates of patients. We also used recombinant IL-15 and IL-6 (PBH; Eubio, Vienna, Austria) and IL-15 enzyme immunosorbent assay (ELISA) (Genzyme Diagnostics), with a detection limit of 10 pg/mL, for detection of IL-15 in culture supernatants.
RNA extraction, cDNA synthesis, and reverse transcription-polymerase chain reaction
Total RNA from approximately 1 × 10⁶ cells was extracted according to the guanidinium thiocyanate-phenol-chloroform protocol described by Chomczynski and Sacchi.22In distilled water, we diluted 1 μg RNA with 250 ng of oligo (dT)15 primer to a final volume of 14 μL. The solution was denatured at 70°C for 5 minutes and immediately chilled on ice. We added the following reagents (Promega, Madison, WI) to each reaction: reverse transcription (RT) mixture (6 μL) containing 4 μL 5 × buffer; dATP, dCTP, dGTP, and dTTP (2 pmol each); and Moloney-murine leukemia virus RT (200 units). For complementary DNA (cDNA) synthesis, all samples were incubated at 37°C for 60 minutes, and the reaction was then stopped by heating the sample to 80°C for 2 minutes; 100 ng of cDNA obtained was amplified by 36 cycles for IL-15, IL-15Rα, bcl-2, and bax-α; 28 cycles for Fas; and 50 cycles for FasL with 1 unit polymerase (Taq, Promega). The reaction conditions were: for denaturing 60 seconds at 95°C, for annealing 60 seconds each at 63°C (cycle 1-3), 59°C (cycle 4-6), and 56°C (cycle 7-50) and for extension 45 seconds at 72°C.
The oligonucleotide primers used were as follows: for IL-1523: TAA AAC AGA AGC CAA CTG (sense) and CAA GAA GTG TTG ATG AAC AT (antisense); for IL-15Rα 23: GTC AAG AGC TAC AGC TTG TAC (sense) and GGT GAG CTT GCT CCT GGA G (antisense); for bcl-224: GGT GCC ACC TGT GGT CCA CCT G (sense) and CTT CAC TTG TGG CCC AGA TAG G (antisense); for bax-α 24: ATG GAC GGG TCC GGG GAG CAG C (sense) and CCC CAG TTG AAG TTG CCG TCA G (antisense); for FasL 25: TTC TTC CCT GTC CAA CCT CTG TGC (sense) and TCA TCT TCC CCT CCA TCA TCA CCA (antisense); and for Fas: TTC TGC CAT AAG CCC TGT CC (sense) and GGT GTT GCT GGT GAG TGT GC (antisense). The expected amplification product sizes were: IL-15 (357 base pair [bp]); IL-15Rα (778 bp); bcl-2 (459 bp); bax-α (323 bp); FasL (603 bp); and Fas (318 bp). GAPDH (987 bp) served as internal control for the reverse transcriptase–polymerase chain reaction (RT-PCR).
Detection of IL-15R components and IL-15 by flow cytometry
For the detection of IL-15Rα/IL-2Rβγ proteins, 0.5 × 10⁶ cells were treated with the specific antibody (1 μg per each sample) or with a nonreactive (isotype-matched) negative control antibody. After 30 minutes incubation at 4°C in PBS containing 0.3% bovine serum albumin (BSA), the cells were washed and a secondary FITC-labeled antibody (dilution 1:10) was added for a further 30 minutes. Cells were subsequently washed, resuspended in PBS/2% paraformaldehyde, and analyzed within 1 hour (FACScan, Becton Dickinson). A minimum of 10 000 viable cells, gated according to their forward scatter/side scatter profile, were analyzed for their fluorescence intensity. For analysis of native plasma cells of multiple myeloma patients, R-phycoerythrin–labeled anti-CD38 (Pharmingen) and peridinin chlorophyll protein–labeled anti-CD45 (Becton Dickinson) antibodies were also used. At least 5000 primary plasma cells were analyzed for their fluorescence signals.
For intracellular IL-15 staining, 0.5 × 10⁶ cells were fixed and permeabilized (Fix & Perm; An-der-Grub Bio Research, Kaumberg, Austria) according to manufacturer's instructions. Permeabilized cells were incubated with murine anti–IL-15 mAb (1 μg per each sample) or an isotype-matched negative control antibody for 15 minutes at RT. Subsequently, secondary staining using a rabbit antimouse antibody (Dako) and a tertiary staining using a FITC-labeled goat antirabbit antibody (Dako) (both at a 1:10 dilution) were performed.
Detection of Fas, FasL, Bcl-2, and Bax by flow cytometry
For detection of surface Fas and FasL expression, 0.5 × 10⁶ cells were stained with either a specific mAb (1 μg) or an isotype-matched negative control mAb for 30 minutes at 4°C, washed, and immediately analyzed by flow cytometry. For intracellular staining of Bcl-2 and Bax, 0.5 × 10⁶cells were fixed and permeabilized (An-der-Grub Bio Research) according to manufacturer's instructions. Permeabilized cells were stained with specific monoclonal antibodies (mAbs) (1 μg) or the relevant control mAbs for 20 minutes at RT. For Bax detection, a secondary rabbit antigoat mAb was used for 20 minutes at RT. Cells were washed and immediately analyzed by flow cytometry for their specific fluorescence signals.
Detection of apoptotic cells
Staining of cells with the combination of annexinV/FITC and propidium iodide (PI) was performed according to manufacturer's instructions for detection of early (annexinV/FITC+/PI−) and late (annexinV/FITC+/PI+) apoptotic cells26; both subpopulations were considered to represent the total fraction of apoptotic cells. Briefly, 2.5 × 10⁵ cells were incubated with saturating concentrations of annexinV/FITC (Alexis) and PI (Sigma, Vienna Austria) for 15-30 minutes at RT and immediately analyzed by flow cytometry.
The breakdown of the mitochondrial transmembrane potential (ΔΨ) was followed by staining the cells with the fluorescent dye 5,5′,6,6′-tetrachloro-1,1′,3,3′-tetraethylbenzimidazol-carbo-cyanine iodide (10 μmol/L) (JC-1; Molecular Probes, Leiden, Netherlands) for 20 minutes at RT. This fluorochrome has been demonstrated to be a reliable probe for assessing ΔΨ changes during apoptosis.27 Immediately after washing with PBS, the fluorescence signal intensity of FL-2 (representing cells with high mitochondrial transmembrane potential) and of FL-1 (low potential) were analyzed by flow cytometry.
Statistical analysis
For statistical analysis of data, P values were assessed using a Fisher PLSD test in the analysis of variance (ANOVA) program or using the paired Student t test program (Statview 5.1; Abacus Concepts, Berkeley, CA) as appropriate.
Results
IL-15R subunits expressed in myeloma cells
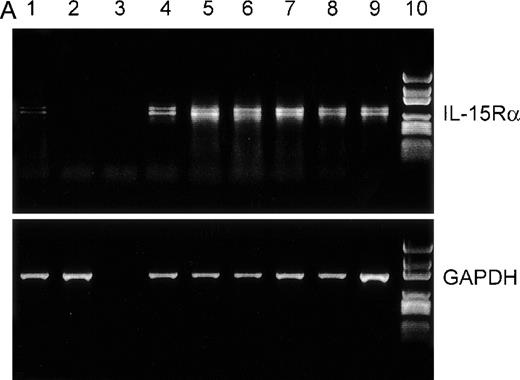
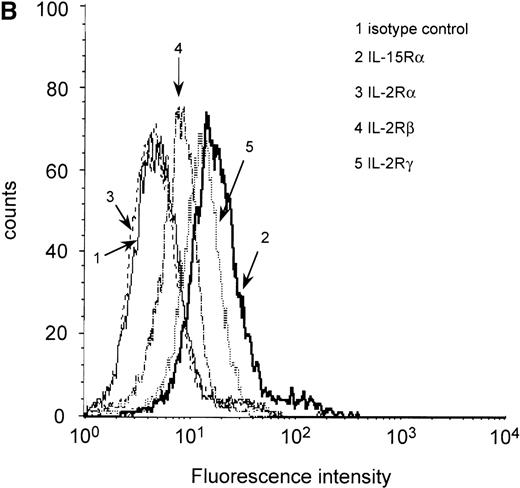
It has been demonstrated that IL-15 and IL-2 share the βγ receptor subunits, but the high-affinity binding of IL-15 (kd = 10-80 pmol/L) depends on the expression of the IL-15Rα chain.18,28 To analyze IL-15Rα expression in the myeloma cell lines ARH-77, LP-1, MC-Car, OPM-2, and RPMI 8226 and the myeloma/lymphoblastoid cell line IM-9, a RT-PCR analysis of IL-15Rα messenger RNA (mRNA) was performed. PBMC of healthy donors were used as a positive control,23 and erythrocytes of these donors were used as a negative control. All cell lines had detectable amounts of the IL-15Rα mRNA in 2 molecular forms (Figure1A), which have been reported to be generated by alternative splicing.28 Additionally, using flow cytometry, we detected constitutive expression of IL-15Rα protein in all myeloma cell lines (Table2). Representative result for expression in RPMI 8226 cells is depicted in Figure 1B. Since functional studies have shown that the β and γ chains are necessary for signaling by IL-15, we subsequently analyzed the myeloma cell lines for these subunits. We found low but significant expression of IL-2Rβ and medium expression levels of the γ chain (Table 2). Representative result in RPMI 8226 cells is depicted in Figure 1B. To investigate the expression of IL-15Rα/IL-2Rβγ on native malignant plasma cells, we used flow cytometry to examine CD38high/CD45low cells from the bone marrow aspirates of 14 patients with multiple myeloma. In all cases, the myeloma cell fraction expressed all components of the IL-15R (Table 1).
RT-PCR and flow cytometric analyses of IL-15R, IL-2R, and control GAPDH.
(A) RT-PCR analysis of expression of IL-15Rα (upper) and control GAPDH (lower) in myeloma cell lines. The results indicated that all myeloma cell lines expressed the mRNA of IL-15Rα (778 bp) in 2 alternatively spliced isoforms. Lane 1: PBMC from a healthy donor as positive control; lane 2: erythrocytes from a healthy donor as negative control; lane 3: dH2O as technical negative control; lane 4: RPMI 8226; lane 5: OPM-2; lane 6: MC-Car; lane 7: LP-1; lane 8: IM-9; lane 9: ARH-77; and lane 10: the molecular weight marker pGEM (Promega). (B) Flow cytometric analysis of all constituents of the IL-15R and the IL-2R in RPMI 8226 cells. Cells were stained with antibodies specific for the relevant subunits of the receptors or the respective isotype-matched control mAb. Fluorescence intensities (FI) were determined by flow cytometry. Each histogram represents 3 independent measurements.
Regulation of IL-15R expression by IL-15
It has been reported that stimulation by IL-15 leads to a rapid down-regulation of its own high-affinity binding site IL-15Rα, which can be observed as early as 4 hours after incubation and can last no less than 72 hours.29 At the same time, IL-15 and IL-2 up-regulate the expression of IL-2Rα in human T and B cells. We determined the expression levels for both IL-15Rα and IL-2Rα after an incubation period of 4 hours. As can be seen in Table 2, stimulation by IL-15 did not down-regulate IL-15Rα expression in cells lines, but rather led to a slight increase of the expression in all cell lines. Even continuous stimulation of myeloma cell lines with IL-15 for up to 72 hours did not change IL-15Rα expression (data not shown). None of the myeloma cell lines expressed the IL-2Rα subunit constitutively (Table 2). Representative results of the RPMI 8226 cell line are depicted in Figure 1B. Expression levels did not appear to increase after IL-15 treatment (Table 2).
Myeloma cells express IL-15 mRNA and protein
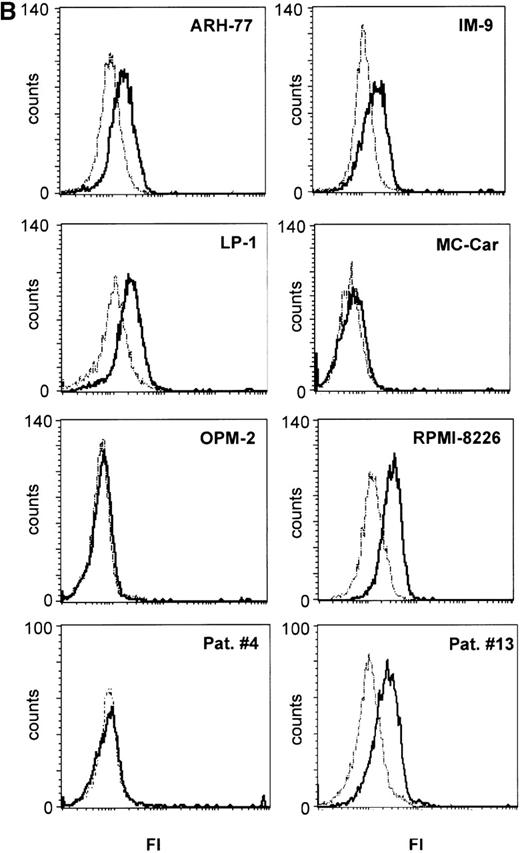
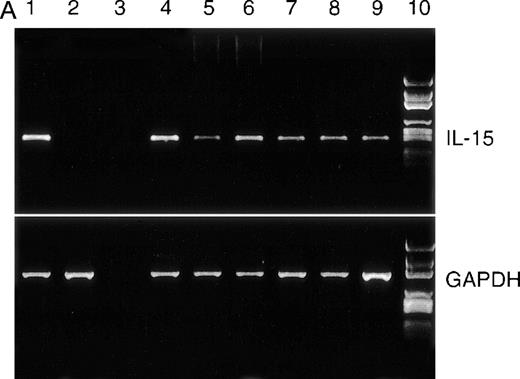
IL-15 mRNA has been found in various tissues and cell lines but not in T cells or B cells under physiological conditions, although neoplastic T cells may express the cytokine.23 30 We found that all myeloma cells tested in the present study expressed IL-15 mRNA (Figure 2A). In addition, we tested whether intracellular IL-15 protein is present in the myeloma cell lines by flow cytometry. The ARH-77, IM-9, LP-1, and RPMI 8226 cell lines had a distinct signal specific for IL-15 protein, whereas the MC-Car and OPM-2 cell lines had no detectable IL-15 protein (Figure 2B). To evaluate the significance of IL-15 protein expression in myeloma cell lines, we analyzed bone marrow aspirates of patients and detected IL-15 protein in the plasma cell fraction of 8 out of 14 patients (Table 1). Representative examples are given in Figure 2B. The concentration of IL-15 in culture supernatants of the myeloma cell lines and in sera of 30 successive patients was determined using an ELISA specific for IL-15 (lower detection limit, 10 pg/mL). None of these samples contained detectable amounts of IL-15 (data not shown).
RT-PCR analysis of IL-15 and control GAPDH, with expression in myeloma cell lines.
(A) RT-PCR analysis of expression of IL-15 (upper) and control GAPDH (lower) in myeloma cell lines. All myeloma cell lines expressed the mRNA of IL-15 (357 bp). Lane 1: PBMC from a healthy donor as positive control; lane 2: erythrocytes from a healthy donor as negative control; lane 3: dH2O as technical negative control; lane 4: RPMI 8226; lane 5: OPM-2; lane 6: MC-Car; lane 7: LP-1; lane 8: IM-9; lane 9: ARH-77; and lane 10: the molecular weight marker pGEM (Promega). (B) Expression of intracellular IL-15 protein in myeloma cell lines and in the plasma cell fraction of myeloma patients. Cells were stained with a specific anti–IL-15 mAb (solid line) or the respective isotype-matched control mAb (dashed line), and FI were determined by flow cytometry. Representative histograms of the cell lines for 1 of 3 independent measurements are presented. Staining profiles representative for IL-15 protein-negative (Pat. #4) and for IL-15 protein-positive primary myeloma cells (Pat. #13) are shown.
Blocking of autocrine IL-15 or IL-6 and rescuing with the alternate cytokine
Intracellular IL-15 protein was found in 4 of 6 myeloma cell lines and in 8 of 14 primary cell populations in the absence of detectable IL-15 in the culture supernatants of cell lines or in the sera of patients. This suggests that small amounts of IL-15 secreted by these myeloma cells could be trapped by the surface IL-15R and could exert a signal via an autocrine or juxtacrine loop. To test this hypothesis, we analyzed the effects of neutralization of endogenous IL-15 on cell survival by saturating concentrations of blocking mAbs; the effects were compared to those of blocking autocrine IL-6. ARH-77, LP-1, MC-Car, and RPMI 8226 cells were cultured in low serum culture medium (0.5% FCS) to reduce the levels of exogenous growth-promoting and survival factors. These suboptimal culture conditions did not increase the apoptotic cell fraction in the myeloma cell lines within the 3-day time frame analyzed (.07 < P < .66 for the respective cell lines, Figures 3A, B).
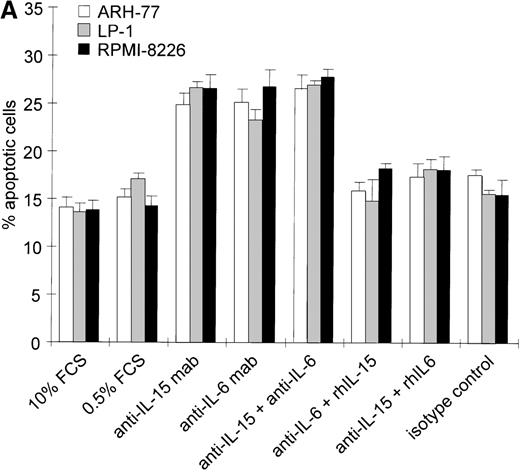
We then added either neutralizing anti–IL-15 mAb (5 μg/mL), anti–IL-6 mAb (5 μg/mL), or a combination of both and cultivated the cells for 72 hours. According to the manufacturer's protocol, the concentration of the anti–IL-15 mAb applied is able to neutralize 5 ng/mL IL-15, which is 500 times the lower detection limit of the IL-15 analyzed by ELISA. The concentration of the anti–IL-6 mAb used is about 30 times the one described to inhibit 50% of the biological activity of 2500 pg/mL IL-6. The range of IL-6 detected in the supernatants of the cell lines investigated was 0-26 pg/mL.31 To exclude nonspecific effects of the neutralizing antibodies, all cell lines were treated with a nonreactive isotype control mAb under identical experimental conditions in each experiment (Figure 3A, B).
Effects of blocking IL-15 or IL-6 in myeloma cell lines.
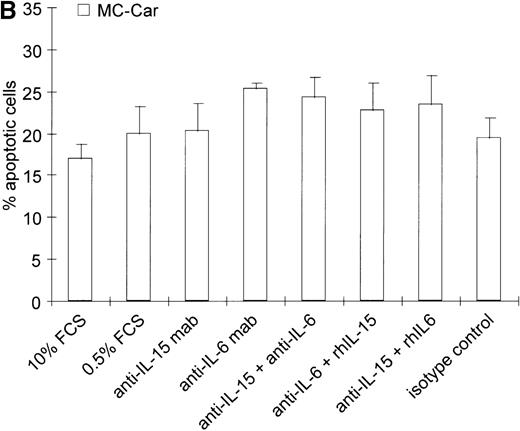
(A) Increase in apoptosis by blocking IL-15 or IL-6 in myeloma cell lines producing IL-15. ARH-77, LP-1, and RPMI 8226 cells were cultured in RPMI-1640 supplemented with 10% FCS or 0.5% FCS. Neutralizing agents anti–IL-15 (5 μg/mL) or anti–IL-6 (5 μg/mL) mAbs were added alone or in combination with recombinant IL-15 (10 ng/mL) or IL-6 (100 ng/mL), respectively. Bars indicate the mean percentages of apoptotic cells ± SEM (standard error of mean), which was determined after a 3-day cultivation in 4 independent experiments. (B) Effects of blocking IL-15 in the MC-Car cell line without detectable intracellular IL-15 protein. MC-Car cells were treated as described for part A. Bars indicate the mean percentages of apoptotic cells ± SEM of 4 independent experiments. Statistical analysis revealed no significant effects of blocking either autocrine IL-15 (P = 0.7) or IL-6 (P =0.3).
Blocking endogenous IL-15 led to an increase in the apoptotic fraction in cell lines with detectable intracellular IL-15 (ARH-77,P = 0.01; LP-1, P = 0.001; RPMI 8226,P = 0.008) (Figure 3A). The effect of neutralizing IL-15 was comparable to that of blocking autocrine IL-6 in ARH-77, LP-1, and RPMI 8226 cell lines (ARH-77, P = 0.02; LP-1, P = 0.03; and RPMI 8226, P = 0.005). Autocrine IL-6 production has previously been reported in the RPMI 8226 cell line, and antisense experiments confirmed its functional role.32 However, subclones may exist without detectable IL-6 production.33The combination of anti–IL-15 and anti–IL-6 mAbs yielded no synergistic or additive effect on these cell lines (ARH-77,P = 0.29; LP-1, P = 0.39; and RPMI 8226,P = 0.4). Recombinant IL-15 (10 ng/mL) was able to rescue cells from apoptosis induced by IL-6 depletion (ARH-77,P = 0.003; LP-1, P = 0.04; and RPMI 8226,P = 0.01). In turn, exogenous IL-6 abrogated the reduction of cell survival resulting from anti–IL-15 mAb incubation (ARH77,P = 0.03; LP-1, P = 0.004; and RPMI 8226 cells,P = 0.04) (Figure 3A). In the MC-Car cell line without detectable IL-15, blocking experiments with the cytokine-specific antibody and rescue experiments with the alternative cytokine showed no significant effects on cell survival (Figure 3B).
IL-15 represents an anti-apoptotic factor for native neoplastic plasma cells
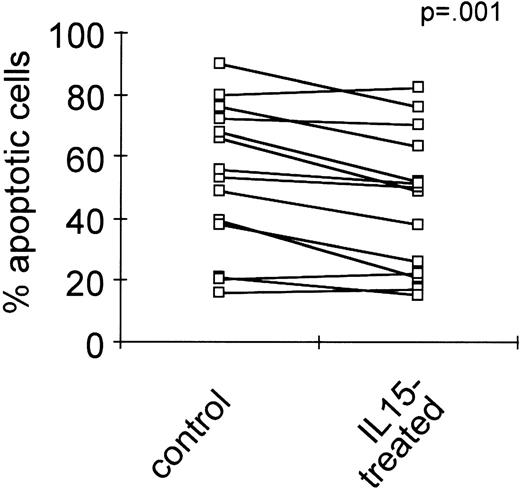
Next we tried to determine whether stimulation by IL-15 also functions as a survival signal in native neoplastic plasma cells. The mononuclear fractions of bone marrow samples of multiple myeloma patients (n = 14) were cultured in the absence or presence of IL-15 (10 ng/mL) for 24 hours, and the percentages of apoptotic cells in the CD38high/CD45low subpopulations were determined by the annexinV/FITC/PI assay. Culturing with IL-15 led to a significant reduction in the percentage of apoptotic cells in the plasma cell fraction (Figure 4, P = 0.001).
Decrease of spontaneous apoptosis in primary myeloma cells by IL-15 treatment.
The mononuclear fractions of bone marrow samples of 14 myeloma patients were cultured without or with IL-15 (10 ng/mL) for 24 hours. The percentages of apoptotic cells in the CD38high/CD45low subpopulations were determined by the annexinV/FITC/PI assay. The significance of IL-15 treatment was analyzed using the paired Student t test.
IL-15 and Fas-induced apoptosis in myeloma cell lines
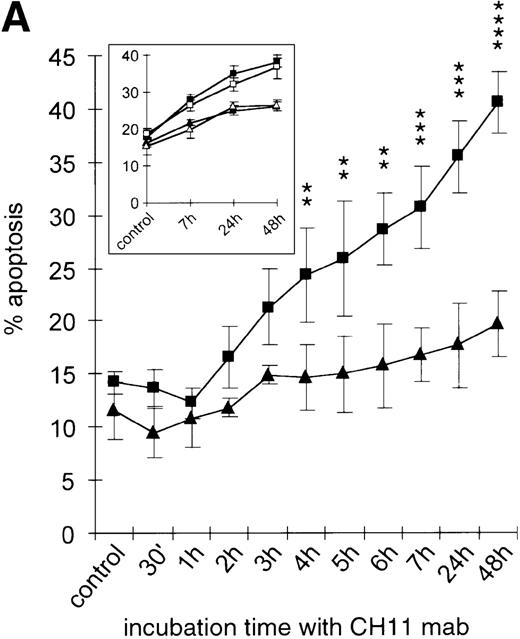
There is accumulating evidence in various cell types that IL-15 is a potent inhibitor of distinct apoptosis pathways including cell death induced by Fas.17,30 34 In order to test whether IL-15 also protects neoplastic plasma cells from Fas-induced apoptosis, the myeloma cell lines were incubated in cell culture medium. Sixteen hours prior to induction of apoptosis with the agonistic anti-Fas mAb CH11 (50 ng/mL), the cell lines were either treated with IL-15 (10 ng/mL) or left untreated. The kinetics of phosphatidylserine exposure and loss of plasma membrane integrity were monitored from 30 minutes to 48 hours after apoptosis induction. Furthermore, in order to have a second readout system and to confirm the sensitivity of the annexinV/FITC/PI test, the breakdown of mitochondrial transmembrane potential ΔΨ, which is also a consistent feature of Fas-induced apoptosis in myeloma cells (I.T., unpublished observation, 1999), was detected by flow cytometry using the potential-sensitive dye JC-1. As shown for the RPMI 8226 cell line in Figure 5A, apoptosis started 2 hours after the CH11 mAb addition, and the apoptotic cell fraction increased in a time-dependent manner.
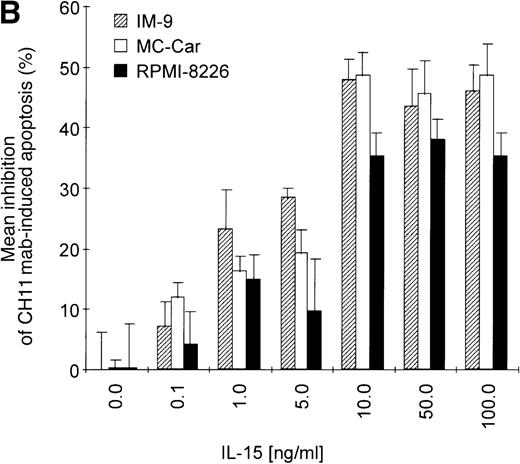
Kinetics of apoptosis induction by CH11 mAb and effects of IL-15 pretreatment.
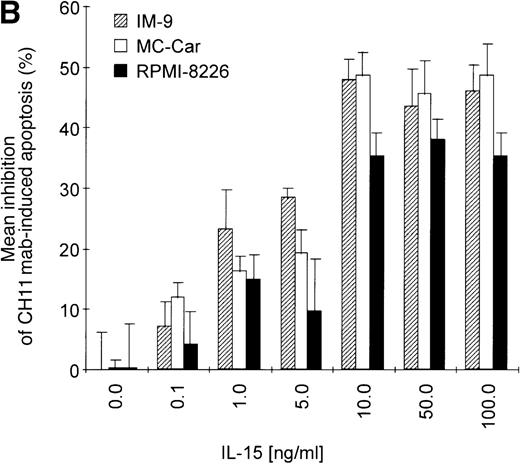
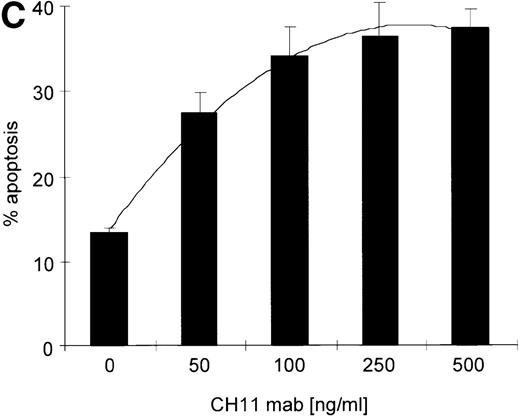
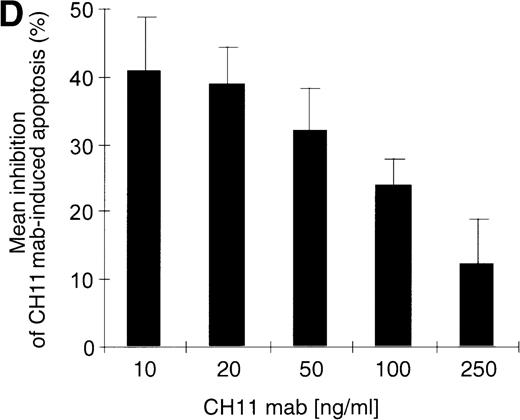
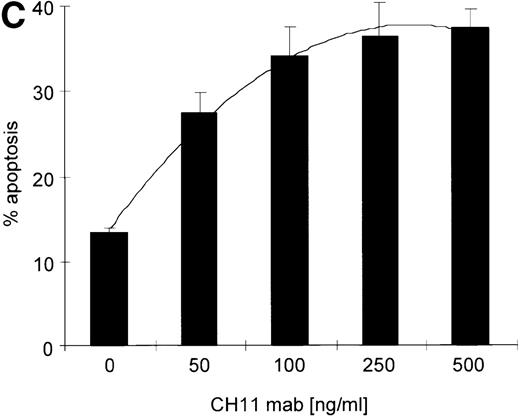
(A) RPMI 8226 cells were either treated with IL-15 (10 ng/mL) or left untreated for 16 hours prior to addition of the agonistic anti-Fas mAb CH11 (50 ng/mL). The percentages of early and late apoptotic cells were determined 30 minutes to 48 hours after CH11 mAb addition. Results from 4 independent experiments ± SEM are given. Specificity control of IL-15 signaling via IL-2Rβ. Cells were pretreated with an anti–IL-2Rβ mAb (2.5 μg/mL; □) or an isotype-matched control mAb (Δ) 30 minutes prior to stimulation with IL-15 and CH11 mAb. The extent of apoptosis induction at 7, 24, and 48 hours was compared to that of cells treated with either CH11 mAb alone (▪) or the combination of IL-15 and CH11 mAbs (▴). Mean values ± SEM of 3 independent experiments are given. (B) Dose-dependence of IL-15 prestimulation to inhibit Fas-induced cell death. IM-9, MC-Car, and RPMI 8226 cells were stimulated with increasing concentrations of IL-15 (0-100 ng/mL) 16 hours prior to addition of CH11 mAb (50 ng/mL). The percentages of apoptotic cells were determined 7 hours after Fas-triggering by CH11 mAb (50 ng/mL). Results from 3 independent experiments ± SEM are given. (C) Dose-dependence of CH11 mAb-induced apoptosis in RPMI 8226 cells. Cells were treated for 24 hours with increasing concentrations of CH11 mAb, and the percentages of apoptotic cells were determined. Statistical analysis revealed a significant increase in the apoptotic cell fraction following CH11 mAb treatment compared with untreated cells (control versus 50 ng/mL:P = .02; control versus 100 ng/mL: P = .002; control versus 250 ng/mL: P = .001; control versus 500 ng/mL:P = .0007). No significant difference was observed when comparing the effects of 50 ng/mL with those at higher concentrations of CH11 mA: 50 ng/mL versus 100 ng/mL: P = .2; 50 ng/mL versus 250 ng/mL: P = .1; and 50 ng/mL versus 500 ng/mL:P = .07. (D) Interdependence of the IL-15 and Fas-pathways in RPMI 8226 cells. RPMI 8226 cells were pretreated with IL-15 (10 ng/mL) 16 hours prior to the addition of increasing concentrations of CH11 mAb (10-250 ng/mL). The percentages of apoptotic cells were determined 24 hours after CH11 mAb addition. Results of 3 independent experiments ± SEM are given, and P values were as follows: 10 ng ± IL-15: P = .0009; 20 ng ± IL-15:P = .0009; 50 ng ± IL-15: P = .001; 100 ng ± IL-15: P = .003; and 250 ng ± IL-15:P = .08. Apoptotic cells were detected by the annexinV/FITC/PI assay, and the sum of the percentages of early and late apoptotic cells was calculated as the percentage of the apoptotic cell fraction. Statistical analyses were done using a Fisher's PLSD test, and statistically significant different results are marked. *P < .05; **P < .01; ***P < .005; and **** P < .001.
Prestimulation with IL-15 significantly reduced the sensitivity of RPMI 8226 cells toward Fas-triggering (Figure 5A), and similar results were obtained with all other myeloma cell lines. The respective percentages of apoptotic cells at the time points 0 and 24 hours are depicted in Table 3. Identical results were observed using the mitochondrial transmembrane potential as a readout system (data not shown). Since the expression levels of the signal-transducing subunit IL-2Rβ were low and the specificity of IL-15 signaling via its receptor needed to be confirmed, we performed experiments with the antagonistic antihuman IL-2Rβ mAb (2.5 μg/mL).21 When added 30 minutes prior to the cytokine addition, the IL-2Rβ mAb abolished the effect of IL-15 prestimulation on CH11-induced apoptosis of RPMI 8226 cells (Figure 5A insert). The signals triggered by IL-15 were transduced rapidly because even simultaneous addition of IL-15 and CH11 mAbs proved to be as effective in protecting myeloma cells from Fas-induced apoptosis (data not shown) as a preincubation period of 16 hours. Furthermore, the effect of IL-15 was dose-dependent in the cell lines RPMI 8226, IM-9, and MC-Car (Figure 5B). Maximal inhibition was observed at a concentration of 10 ng/mL IL-15. All subsequent experiments were performed using this concentration.
Testing the dose-dependence of CH11 mAb-induced apoptosis in the RPMI 8226 cell line, a plateau in cell death induction was observed at 50 ng/mL, with only a slight and statistically insignificant increase in apoptotic cell death at higher concentrations up to 500 ng/mL (Figure5C). The interdependence of the IL-15 and Fas-pathways in RPMI 8226 cells was demonstrated by: (1) the above-mentioned decrease in the responsiveness to CH11 mAb by increasing concentrations of the cytokine (Figure 5B) and (2) the increase in the pro-apoptotic Fas-stimulus to the maximal effective dose in RPMI 8226 cells, which lessened the protective effect of IL-15 pretreatment (Figure 5C, D).
IL-15 does not modify expression patterns
Since IL-15 had a significant effect on the regulation of spontaneous as well as Fas-induced apoptosis in myeloma cells, we investigated IL-15 as a cause of alterations in the expression pattern of Fas or its physiological ligand. mRNA and protein analyses by RT-PCR and flow cytometry, respectively, revealed that stimulation of myeloma cells with IL-15 (10 ng/mL) for 4-24 hours did not decrease the expression of Fas or FasL (data not shown). Using native plasma cells, which express Fas at low levels, no significant effect of IL-15 treatment on Fas expression could be observed (data not shown). To determine whether IL-15 acts as a survival factor for myeloma cells via regulation of Bcl-2 or Bax, we analyzed the expression of both antigens at the mRNA as well as protein levels after incubation with IL-15 (10 ng/mL) for 4-24 hours. We found no significant changes in Bcl-2 or Bax expression levels in any of the cell lines (data not shown).
Effect of blocking IL-15 on induced apoptosis by Fas, dexamethasone, or cytotoxic treatment
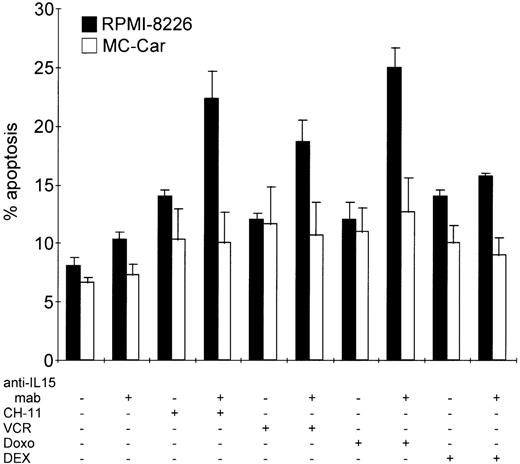
We found that autocrine IL-15 preserves myeloma cells from spontaneous cell death. This raised several questions: Does autocrine IL-15 also contribute to the reported low sensitivity to apoptosis induced by anti-Fas antibodies in a fraction of myeloma cell lines and native malignant plasma cells?10 35-37 Or does it contribute to the development of resistance toward treatment with dexamethasone or cytotoxic drugs such as doxorubicin or vincristine? As measured by the degree of apoptosis induced, our long-term in vitro propagated cell lines were relatively insensitive to CH11 mAb concentrations of 10 ng/mL; vincristine (VCR), 2 μg/mL; doxorubicin (Doxo), 2 μg/mL; or dexamethasone (DEX), 1 μmol/L. (See Figure6.)
Blocking autocrine IL-15 increases cell death of myeloma cells induced by Fas-triggering, vincristine, or doxorubicin treatment but not that induced by dexamethasone.
RPMI 8226 and MC-Car cells were cultured in the absence or presence of anti–IL-15 mAb (5 μg/mL) for 48 hours and treated with CH11 mAb (10 ng/mL), vincristine (VCR, 2 μg/mL), doxorubicin (Doxo, 2 μg/mL), or dexamethasone (DEX, 1 μmol/L) for another 16 hours. The bars indicate the mean percentages of apoptotic cells ± SEM determined in 3 independent experiments.
In the IL-15–producing cell line RPMI 8226, prior to incubation with anti-Fas mAb, vincristine, or doxorubicin for 24 hours, we blocked autocrine IL-15 for 48 hours. This led to a significant increase in the proportion of apoptotic cells (CH11 mAb,P = .0002; vincristine, P = .0015; and doxorubicin,P = .0001), but it did not influence the sensitivity of myeloma cells toward incubation with dexamethasone (P > .3) (Figure 6). In the MC-Car cell line with no detectable intracellular IL-15 protein, treatment with neutralizing anti–IL-15 mAb did not increase the sensitivity of these cells to Fas-triggering (P = .9); to treatment with cytotoxic drugs (vincristine,P = .75; doxorubicin, P = .6); or to dexamethasone (P = .75) (Figure 6).
Discussion
The present study reports the expression of all functional IL-15R components including the specific α-chain in 6 of 6 myeloma cell lines and in the neoplastic plasma cell fraction from all 14 myeloma patients investigated. In normal B cells, a rapid down-regulation of IL-15Rα by IL-15 was reported.29 The down-regulation has been found to attenuate the responsiveness of B cells to this cytokine, while the concomitant up-regulation of IL-2Rα sensitizes them to IL-2 ligation.29 Thus, IL-15 may be important for initial T- and B-cell responses, but subsequently it might favor their responses to IL-2. In contrast, treatment of myeloma cell lines with IL-15 for up to 72 hours did not decrease the expression levels of IL-15Rα (Table 2and data not shown). Furthermore, we detected neither constitutive IL-2Rα expression in myeloma cell lines nor up-regulation following IL-15 stimulation (Table 2, Figure 1B). This altered regulation of IL-15Rα seems to be a prerequisite in order for the cytokine to provide a continuous signal to myeloma cells independent of IL-2.
The expression of all IL-15R constituents in all myeloma cell samples investigated raises the question of a potential autocrine IL-15 loop in this tumor. In fact, some neoplastic cell types that produce IL-15 mRNA, namely lung carcinoma,38 adult T-cell leukemia,23 cutaneous T-cell lymphoma,30 and melanoma cells,39 have recently been identified. We observed constitutive expression of IL-15 mRNA in 6 of 6 myeloma cell lines (Figure 2A) and the intracellular presence of IL-15 protein in 4 of 6 myeloma cell lines (Figure 2B). IL-15 mRNA production in the absence of measurable IL-15 protein is frequently found in several cell systems.18,38,40 It is thought to be caused by a low efficiency of mRNA translation40,41 and the low intracellular levels of the protein, which require sophisticated techniques like confocal laser scanning microscopy for detection.39 This might explain why, in the plasma cell fraction of 6 of 14 patients, intracellular IL-15 protein was never found. However, the finding that 2 cell lines produced the transcript but lacked detectable protein of the cytokine might also be caused by a tight control of the translation process under an as-yet undefined stimulus. Alternatively, the production of detectable amounts of IL-15 protein may differ in various phases of the disease. The fact that all myeloma cell lines as well as the primary neoplastic cells of all patients investigated expressed the IL-15Rα/IL-2Rβγ chains but only 8 of 14 detectable amounts of its physiological ligand may also point to the coexistence of both autocrine and paracrine stimulation of myeloma cells. IL-15 mRNA and protein have been detected in various cell types found in the microenvironment of plasma cells, such as primary human bone marrow stroma cells,42endothelial cells,43 and fibroblasts, but not in normal B cells.14 44 The potential impact of autocrine IL-15 production, its regulation during the transformation process, the course of disease, and the relative contribution of autocrine or paracrine stimulation loops in the bone marrow of myeloma patients will need to be addressed in future studies.
Investigating the biological consequences of either autocrine or paracrine IL-15R stimulation in myeloma cell lines, we focused on apoptosis control, which has previously been demonstrated to be under the influence of the cytokine in several cell types.17,30 34 As demonstrated by the blocking experiments shown in Figure 3A, autocrine IL-15 protected these cells from spontaneous apoptosis. Using exogenous cytokine as a surrogate for paracrine IL-15, we observed a decrease in the percentage of primary myeloma cells undergoing spontaneous apoptosis (Figure 4). These data point to a role of IL-15 in the propagation of a neoplastic plasma cell clone and raise the question concerning the extent of its biological activity and its role as a survival factor in the context of other cytokines.
It has been demonstrated that both autocrine45 and paracrine IL-646 represent important anti-apoptotic factors for myeloma cells by protecting them from spontaneous apoptosis or death by serum starvation.11 We found that the degree of cell survival reduction resulting from neutralizing endogenous IL-15 loops is comparable with the reduction resulting from neutralizing autocrine IL-6 loops (Figure 3A). The extent of protection observed for both cytokines (range for all cell lines tested: IL-6, 25%-48%; IL-15, 38%-48%) is in agreement with the 40% mean reduction in apoptosis following paracrine IL-6 stimulation in the IL-6–dependent ANBL6 cell line.46 Although the cytokines did not prove additive or synergistic in protecting against spontaneous apoptosis, each of them was able to compensate for the neutralization of the other respective cytokine loop (Figure 3A). Several cytokines may contribute to the longevity of neoplastic plasma cells, but to our knowledge none of them has been shown to substitute for IL-6, although the data on GM-CSF remains controversial.47 48
Our data show that IL-15 not only protects against spontaneous apoptosis but also against a broader range of death-inducing signals including Fas-triggering. The expression of functional Fas in myeloma cell lines as well as in native plasma cells from myeloma patients has been reported.10,36,37 The responsiveness of myeloma cells to Fas-induced apoptosis proved to be variable and was suggested to be regulated by a soluble factor10; subsequently, IL-6 was the identified factor.13 49 In the present study, exogenous IL-15 persistently decreased the percentage of cells succumbing to Fas-induced apoptosis in a dose-dependent fashion in all 6 myeloma cell lines tested (Figures 5A and B, Table 3). However, it has to be mentioned that increasing the concentration of CH11 mAb to the maximal effective dose in RPMI 8226 cells (Figure 5C) reduced the protective effect of the maximal inhibitory concentration of IL-15 (Figure 5D). This might indicate that the balance between the degree of recruitable IL-15 and the extent of Fas-stimulation influences the fate of the neoplastic clone and that the cytokine might be operative over a limited range of concentration of molecules available for cross-linking Fas.
There are two unknowns for myeloma cells in their natural bone marrow microenvironment: the median number of FasL molecules meeting their receptors in a given period of time and the degree of juxtacrine IL-15 stimulation. Despite these facts, inhibition of endogenous IL-15 increased the sensitivity of RPMI 8226 cells to CH11 mAb (Figure 6). In addition, exogenous IL-15 lowered the sensitivity of myeloma cells to Fas-triggering over a broad range of CH11 mAb concentrations. The pro-apoptotic efficacy of CH11 mAb, even at the maximally lytic concentration, was reduced by IL-15, although this effect was not statistically significant (Figure 5D). These data suggest that IL-15 might provide a survival advantage for the neoplastic clone during the immune attack of FasL+Fas-sensitive cytotoxic T cells. As we demonstrated in a recent publication,25 when exposed to FasL+ effector cells, the myeloma cells were completely resistant to Fas-induced apoptosis, whereas they proved to be potent effectors and killed T-ALL cells using their own FasL.25These data imply a highly effective intrinsic control mechanism governing sensitivity as well as direction of FasL/Fas signaling in myeloma cells. Our demonstration of functional IL-15R expression on myeloma cells and of its anti-apoptotic capacity indicates that beside IL-6,13 49 IL-15 might also be a signal leading to the protection of these cells from the attack of FasL+ effector cells in tumor surveillance.
The exact cellular mechanisms of action of IL-15 are still to be elucidated because the cytokine did not influence the expression levels of either Fas or FasL (data not shown). In this study, previous investigations of the myeloma cell lines tested have demonstrated that the expression levels of both Fas and Bax, but no other Bcl-2 family member, were positively correlated with the sensitivity to CH11 mAb.36 Although in NK cells, IL-15 augmented survival during serum-free cultivation by maintaining the endogenous Bcl-2 protein levels,15 the results of our present study exclude the possibility of IL-15 exerting its anti-apoptotic effects on myeloma cells by modulating the expression of Bcl-2 or Bax. Similarly, anti-apoptotic activity of IL-6 was not mediated via regulation of Bcl-2 or Bax,11,13 but recent results suggest that Bcl-XL might be a target for IL-6.50 Whether this holds true also for IL-15 will have to be tested in future studies.
To further analyze the role of autocrine IL-15 in the regulation of apoptosis in myeloma cells, we also investigated cell death following treatment with chemotherapeutic drugs. While autocrine IL-15 protected RPMI 8226 cells from cell death induced by Fas-triggering, vincristine, or doxorubicin treatment (Figure 6), it had no protective effect on dexamethasone-induced cell death (Figure 6). Our data on the effects of IL-15 and IL-6, either alone or as a rescue factor when 1 of the cytokines is depleted, in conjunction with data previously reported on IL-6,11,13,49 suggest redundancy for these cytokines in protecting myeloma cells from spontaneous and Fas-induced apoptosis. However, their anti-apoptotic activities may differ when a broader spectrum of death inducers is considered. In fact, in previous data, IL-6 protected from corticosteroid-induced apoptosis12 but not from doxorubicin-induced apoptosis,11 while in our study IL-15 behaved in the opposite way. This might have implications on the therapeutic exploitation of cytokine targeting by mAbs, superantagonists, or antisense strategies. A cocktail of inhibitors might be required for antagonizing myeloma cell survival in its microenvironment, while deprivation of a single cytokine might be sufficient for sensitization toward cytotoxic therapies.
Supported by a grant from the Österreichische Krebshilfe-Krebsgesellschaft Tirol.
Reprints:Richard Greil, Laboratory of Molecular Cytology, Department of Internal Medicine, University of Innsbruck, Anichstrasse 35, A-6020 Innsbruck, Austria; e-mail: richard.greil@uibk.ac.at.
The publication costs of this article were defrayed in part by page charge payment. Therefore, and solely to indicate this fact, this article is hereby marked “advertisement” in accordance with 18 U.S.C. section 1734.


