Epstein-Barr virus (EBV) acute infectious mononucleosis (AIM) is characterized by transient immunosuppression in vivo and increased T-cell apoptosis after ex vivo culture of AIM peripheral blood mononuclear cells. We undertook experiments to test whether EBV or purified virion envelope glycoprotein gp350 could contribute to Fas-mediated T-cell apoptosis. Our in vitro results indicate that EBV increased Fas expression in CD4+ T cells and Fas ligand (FasL) expression in B cells and macrophages. Purified gp350 was also shown to significantly increase CD95 expression in CD4+ T cells. When T-cell CD95 was cross-linked, EBV-stimulated T cells underwent apoptosis. The induction of T-cell CD95 by EBV followed by CD95 cross-linking with anti-CD95 monoclonal antibody resulted in a loss in the number of T cells responding to the T-cell mitogens, anti-CD3 antibody, and interleukin-2. These results indicate that, in addition to serving as a principal ligand for the attachment of virus to target cells, gp350 may also act as an immunomodulatory molecule that promotes T-cell apoptosis.
ACUTE INFECTIOUS mononucleosis (AIM) is a self-limiting lymphoproliferative disease caused by the Epstein-Barr virus (EBV).1 AIM is characterized by a 2-fold or greater expansion in the number and percentage of CD8+ T lymphocytes and a 3-fold decrease in the percentage of CD4+T lymphocytes, a marked impairment of normal T-cell responses, ie, anergy, as well as a high number of peripheral blood T cells predisposed to undergo apoptosis when cultured ex vivo.2-10
Recently, the Fas antigen, now designated as CD95, has been shown to be an important mediator of T-cell apoptosis.11,12 After cross-linking of surface CD95 by its natural ligand, Fas ligand (FasL), or by an anti-Fas monoclonal antibody (MoAb), cells will undergo apoptosis.13,14 In addition to EBV, CD95 expression has been shown to be elevated in T cells after infection by a number of viruses, including those that lead to transient or progressive immunosuppression.9 15-22
EBV displays a unique tropism for B cells that express the C3d receptor, CD21, due to C3d homologous amino acid sequences in the virion envelope glycoproteins, gp350 and gp220 (gp350).23The EBV receptor, CD21, is found principally on B cells, but it is also expressed, albeit at lower levels, in epithelial cells and T cells.24, 25 In addition to CD21, T cells may also express an additional 70-kD EBV binding protein.26
Because gp350 is capable of binding to and activating B lymphocytes in vitro27 through a receptor that may also be expressed on T cells and because AIM T cells are susceptible to apoptosis, we undertook experiments to determine whether the EB virion, or purified EBV glycoprotein gp350, could bind to T cells and induce CD95 expression. We also investigated whether CD95 expression predisposed T cells to undergo apoptosis. The results from such experiments may suggest a mechanism to explain why T cells from AIM patients undergo apoptosis.
MATERIALS AND METHODS
Lymphocyte donors.
Peripheral blood mononuclear cells (PBMCs) were obtained from patients diagnosed at Sainte-Justine Hospital (Montreal, Quebec, Canada) with EBV AIM, as determined by the presence of fever, pharyngitis, lymphadenopathy, lymphocytosis with atypical lymphocytes, and heterophile antibodies (determined by monospot testing; Monosticon Dri-Dot; Organon Teknika, Durham, NC),28 and from healthy volunteer blood donors (kindly supplied by the Ottawa Red Cross [Ottawa, Ontario, Canada] and the Children’s Hospital of Eastern Ontario [Ottawa, Ontario, Canada]). PBMCs were isolated from heparinized whole blood by Ficoll-hypaque density gradient centrifugation.
Cells and culture.
PBMCs, peripheral blood T and B cells, the EBV-producing cell lines B95-8 (CRL 1621; American Type Culture Collection [ATCC], Manassas, VA) and Akata29 (gift from Dr K. Takada, Nihon University School of Medicine, Tokyo, Japan) or the EBV-negative B-cell line Louckes (gift from Dr E. Kieff, Harvard Medical School, Boston, MA) were all maintained in Iscove’s modified Dulbecco’s medium, supplemented with 10% heat-inactivated fetal calf serum (FCS), 2 mmol/L glutamine, 50 U/mL penicillin, and 50 μg/mL streptomycin (GIBCO BRL, Burlington, Ontario, Canada).
T- and B-cell purification.
Peripheral blood T cells were obtained from healthy blood donors after separation on Ficoll-hypaque density gradients and rosetting with 2-aminoethylisothiouronium–treated sheep red blood cells.30 31 B cells were obtained after Ficoll-hypaque density gradient centrifugation and CD19-dynabead affinity-purification (Dynal, Success Lake, NY). T-cell preparations were found to be 93% ± 2.3% (mean ± standard error of the mean [SEM]) CD3+ (T cells), 1.5% ± 1.5% CD19+ (B cells), and 1.5% ± 0.25% CD14+(monocytes/macrophages). B-cell preparations were found to be 98% ± 2.4% CD21+, 2.3% ± 2.6% CD3+, and 0.94% ± 0.032% CD14+ as determined by immunostaining with phycoerythrin (PE)-coupled antihuman CD3 mouse MoAb (clone Leu-4; Becton Dickinson, San Jose, CA), PE-coupled antihuman CD19 mouse MoAb (clone Leu 12; Becton Dickinson), PE-coupled antihuman CD21 mouse MoAb (clone HB-5; Becton Dickinson), and PE-coupled antihuman CD14 mouse MoAb (clone Leu Mϕp9; Becton Dickinson) and flow cytometric analysis.
EBV and gp350 preparation.
EBV was isolated as filtered concentrated cell supernatant from B95-8 cell cultures in which virus was induced by starving cells for 14 days32 or as purified virus obtained from Akata cells after stimulation with rabbit antihuman IgG and 2 cycles of dextran T-10 gradient centrifugation.29 33 Virus purity was confirmed by electron microscopy. Mock-EBV samples were obtained using an identical procedure with the EBV-negative B-cell line, Louckes, or from unstimulated Akata cell culture supernatant also banded by dextran gradient centrifugation.
The gp350 complex was generated by initially diluting purified anti-gp350 MoAb 2L10 (gift from Dr Gary Pearson, Georgetown University, Washington, DC) or 72A1 (HIB 167; ATCC and Hoffman et al34) or an isotype-matched negative control antibody (antirespiratory syncytial virus nuclear protein MoAb IgG 858-3; Chemicon International, Los Angeles, CA) to 1 mg/mL in 100 μL of 0.1 mol/L sodium bicarbonate (pH 8.2), followed by incubation in a sterile flat-bottom 96-well enzyme-linked immunosorbent assay (ELISA) plate (Nunc, Canadian Life Technologies, Burlington, Ontario, Canada). After 18 hours, antibody was removed, plates were washed with phosphate-buffered saline (PBS), and wells were blocked with culture medium. A total of 100 μL of culture medium containing 2 μg of purified gp35035 was added per well, and plates were incubated at 4°C for an additional 3 hours. Unbound gp350 was then removed by PBS washes. The purity of gp350 was checked by gel electrophoresis and silver staining.36 The anti-gp350 MoAb, 2L10, has previously been shown not to block EBV or gp350 binding to the EBV receptor, whereas 72A1 has been shown to block EBV or gp350 binding to the CD21 molecule.35
Induction of T-cell CD95 expression and apoptosis.
T cells or PBMCs, which were initially incubated at 4°C for 2 hours with 1/10 vol of concentrated virus stock preparation, 1/10 vol of purified virus, or 1/10 vol of mock-virus preparation, were washed 3 times with cold medium and seeded at 5 × 10⁵ cells/mL in 2 mL complete medium in a 24-well flat-bottom plate. Parallel cultures of cells, which were cultured in the presence of phytohemagglutinin (PHA; 1:200 vol/vol) served as control for apoptosis and CD95 expression. Cells were cultured for 24-hour intervals, followed by collection and staining with either fluorescein isothiocyanate (FITC)- or PE-conjugated MoAb, FITC-conjugated Annexin V (R&D Systems, Minneapolis, MN), or propidium iodide.
In experiments that involved the blocking of EBV binding to T cells for subsequent inhibition of CD95 expression, concentrated virus was first incubated for 1 hour on ice with purified anti-gp350 MoAb 72A1 (1 μg/mL) or an irrelevant monoclonal (antirespiratory syncytial virus nuclear protein monoclonal 858-3; 1 μg/mL) before its addition to purified T cells. The cell:virus mixture was then incubated for 2 hours on ice to allow for virus binding, followed by several washes with cold medium, and cultured for 24 hours.
In several experiments, T cells that had been stimulated with EBV or with mock-virus preparations were also cultured in the presence or absence of 5 μg/mL antihuman CD95 IgM MoAb (clone CH-11 antibody; MBL International, Watertown, MA) for 12 or 24 hours before cell staining for CD95, apoptosis analysis, or continued stimulation with antihuman CD3 mouse monoclonal, OKT-3, and 50 U/mL interleukin-2 (IL-2; Cetus, Emeryville, CA).37
Flow cytometric analysis.
Cells were stained with FITC-conjugated antihuman CD95 mouse MoAb (UB-2; MBL International) and PE-coupled antihuman CD4 mouse MoAb (clone SK3; Becton Dickinson), PE-coupled antihuman CD8 mouse MoAb (clone SK1; Becton Dickinson), or PE-coupled antihuman CD56 mouse MoAb (clone MY31; Becton Dickinson). In some experiments, cells were also incubated with the above-mentioned PE-conjugated monoclonals or with PE-coupled antihuman CD20 mouse MoAb (clone 2H7; Pharmingen Canada, Mississauga, Ontario, Canada), PE-conjugated antihuman CD14 mouse MoAb (clone mφp9; Becton Dickinson), and rabbit antihuman FasL peptide polyclonal antibody (Santa Cruz Biotech, Santa Cruz, CA). Cell-bound antihuman FasL was detected with FITC-coupled goat antirabbit Ig antibody (GIBCO BRL). Cells were analyzed for FITC and PE dual immunofluorescence by flow cytometry. Appropriate FITC and PE control antibodies (Becton Dickinson) were also included to monitor nonspecific antibody binding.
Measurement of apoptosis by flow cytometry.
The proportion of cells undergoing apoptosis was determined by Annexin V (R&D Systems) or propidium iodide staining.38 The distinct cell cycle region of apoptosis (Ao region) seen after propidium iodide staining has been shown previously to be that found below the Go/G1 diploid peak.
Statistical analyses.
Statistical comparison of AIM and matched control populations used the Mann-Whitney U test. Z values greater than 1.96 were considered significant. All other statistical analyses used in this study used the Student’s t-test.
RESULTS
Expression of CD95 on lymphocytes from AIM patients.
Patients with AIM have been shown to exhibit high numbers of apoptotic T cells after their culture in vitro.8 To determine whether lymphocytes from AIM patients also exhibit elevated levels of the CD95 antigen, PBMCs obtained from AIM patients or matched healthy blood donors were stained with FITC-labeled anti-CD95 MoAb and processed for flow cytometry. We also determined the level of CD95 expression within the CD4+ and CD8+ lymphocyte populations. As shown in Fig 1A through F, PBMCs obtained from an AIM patient contained a greater number of CD95+lymphocytes compared with those from a matched control blood donor (75% v 6%). CD95 expression in the CD4+ and CD8+ populations was 12% and 51% for this particular AIM patient, versus 4% and 0.8% for a matched control donor, respectively. Results from additional healthy blood donors and AIM patients indicated that PBMCs from AIM patients contained 73.5% ± 6.4% (mean ± standard deviation [SD]) CD95+lymphocytes, versus 26.1% ± 13.6% for healthy donor PBMCs (z = 3.15; Fig 1G). Analysis of CD95 expression in AIM CD4+ and CD8+ populations showed that they also expressed a greater number of CD95+ cells versus the control CD4+and CD8+ cell populations. The CD4+ cells from AIM patients were 12.6% ± 1.4% CD95+, versus 6.4% ± 3.8% CD95+ in the CD4+ control population (z = 1.66; Fig 1G). The CD8+ cells from AIM patients were 51.8% ± 6.3% CD95+ versus 3.8% ± 4.1% CD95+ for the CD8+ control population (z = 3.09; Fig 1G). Although we did not address the nature of the non–T-cell population in AIM PBMCs that expressed CD95, the additional 9.1% CD95+ cells (73.5% CD95+cells in PBMCs v 64.4% CD95+ cells in the CD4+ and CD8+ lymphocyte population) may be EBV or cytokine-stimulated B cells and phagocytic cells.39 40
Levels of CD95 expression on PBMCs and CD4+and CD8+ peripheral blood T cells from AIM patients. PBMCs from a representative healthy blood donor (A through C) or from an AIM patient (D through F) were stained with FITC- and PE-conjugated control IgG (A and D), FITC-conjugated anti-CD95 and PE-conjugated anti-CD4 (B and E), or FITC-conjugated anti-CD95 and PE-conjugated anti-CD8 (C and F). Results from gated cells (upper right inserts in [A] and [D]) were plotted on a logarithmic scale. CD95 expression in gated peripheral blood lymphocytes from 25 healthy blood donors (□) or 7 AIM patients (▪) (G). Cells were analyzed by 2-color immunofluorescence after staining with FITC-conjugated CD95 (x-axis) and PE-conjugated anti-CD4 or anti-CD8 MoAbs (y-axis). Results are expressed as the mean percentage positive ± SD. Statistically significant values analyzed by the Mann-Whitney U test are designated by an asterisk.
Levels of CD95 expression on PBMCs and CD4+and CD8+ peripheral blood T cells from AIM patients. PBMCs from a representative healthy blood donor (A through C) or from an AIM patient (D through F) were stained with FITC- and PE-conjugated control IgG (A and D), FITC-conjugated anti-CD95 and PE-conjugated anti-CD4 (B and E), or FITC-conjugated anti-CD95 and PE-conjugated anti-CD8 (C and F). Results from gated cells (upper right inserts in [A] and [D]) were plotted on a logarithmic scale. CD95 expression in gated peripheral blood lymphocytes from 25 healthy blood donors (□) or 7 AIM patients (▪) (G). Cells were analyzed by 2-color immunofluorescence after staining with FITC-conjugated CD95 (x-axis) and PE-conjugated anti-CD4 or anti-CD8 MoAbs (y-axis). Results are expressed as the mean percentage positive ± SD. Statistically significant values analyzed by the Mann-Whitney U test are designated by an asterisk.
Induction of CD95 expression after exposure to EBV or EBV gp350.
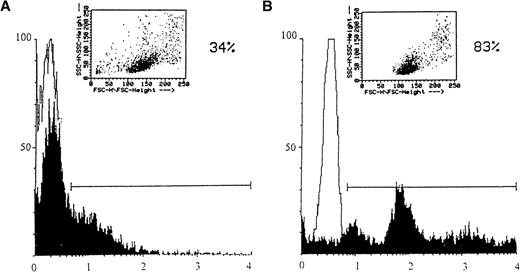
Because AIM patients have a significant number of EBV-positive B cells, which in turn have the potential to undergo virus replication and gp350 expression in the lymph node,41-45 we investigated whether the EB virion was capable of inducing CD95 expression in peripheral blood T cells. Initially, we determined the percentage of T cells that bound to EBV, because T cells or T-cell lines have previously been shown to express the EBV receptor.26,46 As shown in Fig 2A, up to 34% of the peripheral blood T cells were found to bind EBV, as determined by gp350 immunofluorescence. Peripheral blood B cells from the same donor showed an expected higher positive percentage (83%) for gp350 immunofluorescence (Fig 2B). These results are in agreement with those of Levy et al46 and Hedrick et al,26 who found that primary peripheral blood T cells or T-cell lines expressed an EBV receptor that bound EBV in up to 23% and 50% of the cells, respectively.
Binding of EBV to T and B cells (A and B, respectively). Affinity-purified T or B cells derived from a healthy donor’s peripheral blood (shown in upper right inserts) were incubated at 1 × 10⁶ cells/200 μL on ice for 2 hours with 1/10 vol of concentrated B95-8 virus or mock virus stock preparations. Cells were washed with cold PBS and stained for bound gp350 using anti-gp350 MoAb, 2L10. Samples were developed with FITC-conjugated goat antimouse IgG. Results were plotted on a logarithmic scale. Virus- and mock-infected cells are indicated by solid or open histograms, respectively. The percentage of fluorescent cells greater than that of the mock-infected cells is indicated above the bar. T and B cells were 87% and 92% viable, respectively, after affinity purification, as measured by trypan blue exclusion.
Binding of EBV to T and B cells (A and B, respectively). Affinity-purified T or B cells derived from a healthy donor’s peripheral blood (shown in upper right inserts) were incubated at 1 × 10⁶ cells/200 μL on ice for 2 hours with 1/10 vol of concentrated B95-8 virus or mock virus stock preparations. Cells were washed with cold PBS and stained for bound gp350 using anti-gp350 MoAb, 2L10. Samples were developed with FITC-conjugated goat antimouse IgG. Results were plotted on a logarithmic scale. Virus- and mock-infected cells are indicated by solid or open histograms, respectively. The percentage of fluorescent cells greater than that of the mock-infected cells is indicated above the bar. T and B cells were 87% and 92% viable, respectively, after affinity purification, as measured by trypan blue exclusion.
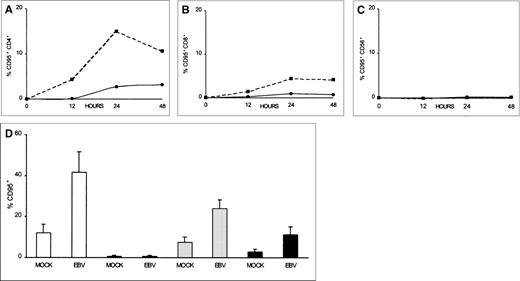
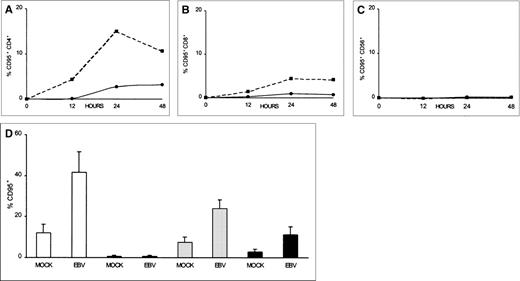
To investigate whether CD95 is expressed on T cells after exposure to EBV, as well as to study the kinetics of CD95 expression, we measured CD95 immunofluorescence on T cells over a 48-hour period. As shown in Fig 3A and B, increased CD95 expression was detected as early as 12 hours postinfection in both the CD4+ and CD8+ T-cell populations. CD95 was seen to peak at 24 hours, displaying 15% and 4% positive-cell immunofluorescence on CD4+ and CD8+ cells, respectively. CD95 continued to be expressed on the T cells during the remainder of the 48-hour period, albeit at reduced levels (Fig 3A and B). This was compared with mock-virus–treated CD4+ and CD8+ T cells that displayed no more than 2% and 0.7% CD95+ immunofluorescence, respectively, during the 48-hour period (Fig 3A and B). The lower percentage of CD95-expressing cells seen during the latter part of the 48-hour period in T cells that were exposed to EBV may be due to a loss of surface-bound virus through cellular internalization and proteolytic processing. Further evidence that EBV specifically induced CD95 expression in T cells can be seen in Fig 3C. CD56+ NK cells that were exposed to EBV or mock-virus treatment did not express significant levels of CD95 over the entire 72-hour period (<1%; Fig 3C).
Time course of CD95 expression for CD4+, CD8+, and CD56+ lymphocytes after EBV infection. PBMCs were incubated on ice for 2 hours with 1/10 vol of concentrated B95-8 virus (▪) or mock virus (•) preparations, washed with PBS, and cultured at 5 × 10⁵ cells/mL in 2 mL of culture medium. Aliquots were taken at hourly intervals and stained by 2-color immunofluorescence using FITC-conjugated CD95 and PE-conjugated anti-CD4 (A), anti-CD8 (B), or anti-CD56 (C) MoAbs. (D) PBMCs from 4 different blood donors were stained at 24 hours for CD95 (□), for CD95 and CD56 (▤), for CD95 and CD4 (▩), or for CD95 and CD8 (▪). Results are expressed as the mean percentage positive ± SEM. CD95-fluorescence activity found in untreated cells (medium only) was subtracted from both mock- and virus-treated samples before plotting for each time point.
Time course of CD95 expression for CD4+, CD8+, and CD56+ lymphocytes after EBV infection. PBMCs were incubated on ice for 2 hours with 1/10 vol of concentrated B95-8 virus (▪) or mock virus (•) preparations, washed with PBS, and cultured at 5 × 10⁵ cells/mL in 2 mL of culture medium. Aliquots were taken at hourly intervals and stained by 2-color immunofluorescence using FITC-conjugated CD95 and PE-conjugated anti-CD4 (A), anti-CD8 (B), or anti-CD56 (C) MoAbs. (D) PBMCs from 4 different blood donors were stained at 24 hours for CD95 (□), for CD95 and CD56 (▤), for CD95 and CD4 (▩), or for CD95 and CD8 (▪). Results are expressed as the mean percentage positive ± SEM. CD95-fluorescence activity found in untreated cells (medium only) was subtracted from both mock- and virus-treated samples before plotting for each time point.
Results from in vitro testing of 4 additional blood donor T-cell preparations for their CD95 expression after EBV stimulation indicated that EBV induced 30% more T lymphocytes to express CD95 as compared with mock treatment (P = .03; Fig 3D). Similarly, 16% (P = .01) and 8% (P = .08) more CD4+ and CD8+ cells, respectively, expressed CD95 after EBV treatment, as compared with mock treatment (Fig 3D). CD56+cells expressed 0.7% and 0.5% CD95 after either EBV or mock stimulation, respectively (Fig 3D). The induction of CD95 expression in our donor T-cell populations did not appear to be due simply to the presence of EBV-reactive memory T cells, because 1 of the blood donors (PR) was EBV-seronegative and displayed 12% and 8% increases, respectively, in the number of CD4+ and CD8+ T cells expressing CD95.
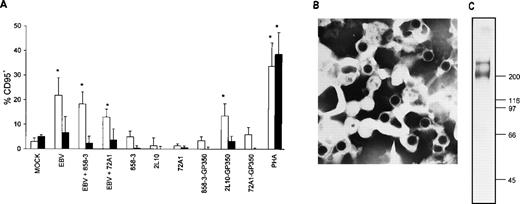
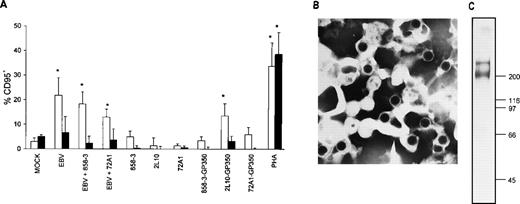
To determine whether the major virion envelope glycoprotein, gp350, alone was responsible for inducing CD95 in T cells, as opposed to stimulation in conjunction with another virion surface protein, T cells were incubated with EBV, with EBV plus the gp350 neutralizing antibody (72A1),34 or with gp350 coated onto microplate wells. As seen in Fig 4, gp350 was capable of inducing CD95 expression in CD4+ T cells to a level comparable with that of EBV. CD4+ and CD8+ T cells were 14% and 3% CD95+, respectively, after 2L10-gp350 exposure, versus 1% and less than 1% CD95+, respectively, in CD4+ and CD8+ T cells exposed to 2L10 antibody alone (P = .024 for 2L10-gp350 exposurev 2L10 antibody exposure in CD4+ T cells). CD4+ and CD8+ T cells were 22% and 7% CD95+, respectively, after EBV exposure, versus 3% and 5% CD95+, respectively, in CD4+ and CD8+ T cells exposed to mock-treatment (P = .03 for EBV-treatment v mock-treatment in CD4+ T cells). PHA induced CD95 levels in CD4+ and CD8+ T cells to 34% and 39%, respectively, compared with mock treatment (P = .02 and P = .03 in CD4+ and CD8+, PHA-treated T cells v mock-treated CD4+ and CD8+ T cells, respectively). MoAbs 2L10, 72A1, and 858-3 coated onto the wells failed to induce significant levels of CD95 in T cells (no more than 5% and 0.6% for CD4+ and CD8+ T cells, respectively, as compared with medium). Interestingly, T cells treated with 72A1 Ig plate-bound gp350 did not increase their level of CD95 expression to that of 2L10, suggesting that the T-cell binding epitope for gp350 may be at the same site as that for the B-cell EBV binding epitope that is found in proximity to the gp350 amino-terminus.35
Induction of CD95 in T cells by EBV and purified gp350. (A) Affinity-purified T cells were incubated at 1 × 10⁶ T cells/200 μL for 2 hours on ice with 1/10 vol of mock virus, 1/10 vol of purified Akata virus, or 1/10 vol of purified Akata virus that was previously incubated on ice for 1 hour with either 1 μg/mL 72A1 or 858-3 antibody. Cells were washed 2 times with cold PBS and cultured for 24 hours. Cells were stained with FITC-conjugated CD95 MoAb and PE-conjugated antihuman CD4 MoAb (□) or antihuman CD8 MoAb (▪). Purified T cells (2 × 10⁵/200 μL) were cultured for 18 hours with either plate-bound anti-gp350/220 MoAbs 72A1, 2L10, control MoAb 858-3, antibody-gp350 complexes, or PHA. Cells were stained with FITC-conjugated anti-CD95 MoAb and PE-conjugated antihuman CD4 MoAb or antihuman CD8 MoAb. CD95 expression in medium-treated CD4+ and CD8+ T cells for the 3 separate donors was subtracted during analysis and the mean CD95 percentage positive cells ± SD was plotted. Statistically significant values after analysis by the Student’s t-test are designated by an asterisk. (B) Purified Akata virus used in the EBV stimulation experiments is shown (original magnification × 86,500). (C) The purified gp350 used in the formation of the antibody-gp350 complexes was resolved in a 6.5% gel by sodium dodecyl sulfate-polyacrylamide gel electrophoresis (SDS-PAGE) and silver stained.
Induction of CD95 in T cells by EBV and purified gp350. (A) Affinity-purified T cells were incubated at 1 × 10⁶ T cells/200 μL for 2 hours on ice with 1/10 vol of mock virus, 1/10 vol of purified Akata virus, or 1/10 vol of purified Akata virus that was previously incubated on ice for 1 hour with either 1 μg/mL 72A1 or 858-3 antibody. Cells were washed 2 times with cold PBS and cultured for 24 hours. Cells were stained with FITC-conjugated CD95 MoAb and PE-conjugated antihuman CD4 MoAb (□) or antihuman CD8 MoAb (▪). Purified T cells (2 × 10⁵/200 μL) were cultured for 18 hours with either plate-bound anti-gp350/220 MoAbs 72A1, 2L10, control MoAb 858-3, antibody-gp350 complexes, or PHA. Cells were stained with FITC-conjugated anti-CD95 MoAb and PE-conjugated antihuman CD4 MoAb or antihuman CD8 MoAb. CD95 expression in medium-treated CD4+ and CD8+ T cells for the 3 separate donors was subtracted during analysis and the mean CD95 percentage positive cells ± SD was plotted. Statistically significant values after analysis by the Student’s t-test are designated by an asterisk. (B) Purified Akata virus used in the EBV stimulation experiments is shown (original magnification × 86,500). (C) The purified gp350 used in the formation of the antibody-gp350 complexes was resolved in a 6.5% gel by sodium dodecyl sulfate-polyacrylamide gel electrophoresis (SDS-PAGE) and silver stained.
Induction of T-cell CD95-mediated apoptosis after EBV exposure.
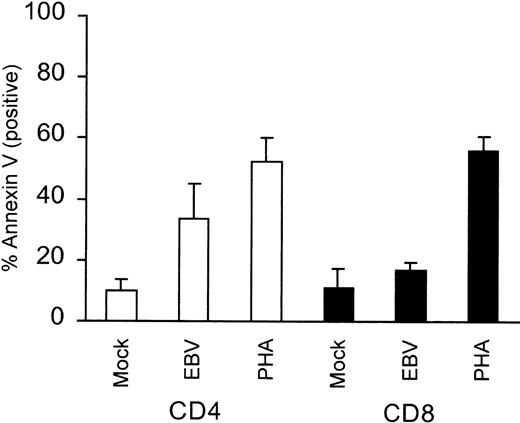
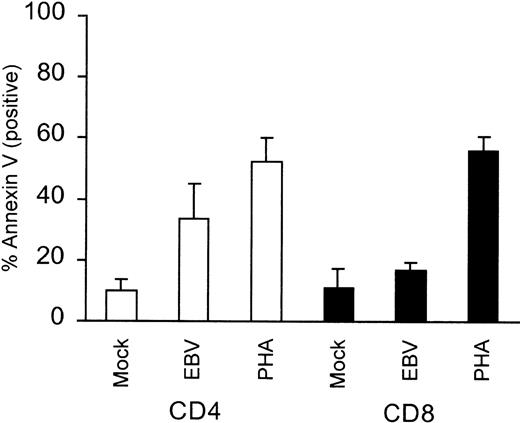
Because T cells from AIM patients have been shown to undergo apoptosis when cultured in vitro, we sought to determine whether in vitro EBV-exposed T cells underwent apoptosis. Exposure of PBMCs to purified virus or PHA and subsequent staining for CD4 or CD8 and Annexin V showed that 24% of the CD4+ cells underwent EBV-specific apoptosis compared with mock treatment (P = .03). CD8+ cells only underwent 6% EBV-specific apoptosis (Fig 5). The lack of significant CD8+ cell apoptosis after EBV stimulation was not due to an inability of these cells to undergo apoptosis, because PHA treatment resulted in significant levels of CD8+ cell apoptosis (56%; P = .0007; Fig 5). Interestingly, and in contrast, purified T cells exposed to EBV did not undergo spontaneous apoptosis, but were capable of undergoing apoptosis if subsequently treated with the anti-CD95 mouse monoclonal, CH-11 (Fig6). Comparison of mock-infected versus EBV-infected T cells showed that apoptotic cells increased by only 4% in the EBV-infected population, but increased by 7% and 37% in the anti-CD95 treated, mock- and EBV-infected population, respectively (Fig 6). Because our T cells did not undergo significant apoptosis unless treated with anti-CD95 MoAb, these results suggested that EBV stimulation alone failed to induce significant levels of FasL in T cells.
Level of CD4+ and CD8+ cell apoptosis in PBMCs after EBV stimulation. PBMCs were stimulated with purified Akata virus or mock virus and were then seeded at 5 × 10⁵ cells/mL and cultured for 24 hours. Cells were subsequently stained with FITC-coupled Annexin V and PE-labeled anti-CD4 or PE-labeled anti-CD8. The mean percentage values of Annexin V-positive CD4+ or CD8+ cells ± SEM obtained from 4 separate donors are plotted.
Level of CD4+ and CD8+ cell apoptosis in PBMCs after EBV stimulation. PBMCs were stimulated with purified Akata virus or mock virus and were then seeded at 5 × 10⁵ cells/mL and cultured for 24 hours. Cells were subsequently stained with FITC-coupled Annexin V and PE-labeled anti-CD4 or PE-labeled anti-CD8. The mean percentage values of Annexin V-positive CD4+ or CD8+ cells ± SEM obtained from 4 separate donors are plotted.
Induction of apoptosis in T cells by EBV. T cells were mock-infected (A and B) or EBV-infected (C and D) in the absence (A and C) or presence (B and D) of anti-CD95 IgM. The percentage of apoptotic cells (Ao) is indicated.
Induction of apoptosis in T cells by EBV. T cells were mock-infected (A and B) or EBV-infected (C and D) in the absence (A and C) or presence (B and D) of anti-CD95 IgM. The percentage of apoptotic cells (Ao) is indicated.
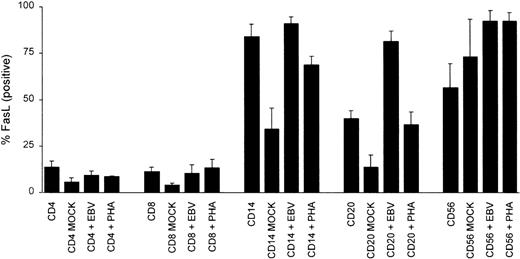
Further testing of FasL levels in PBMC CD14+ monocytes, CD56+ NK cells, CD20+ B cells, or CD4+ and CD8+ T cells from EBV-stimulated PBMCs indicated that EBV markedly increased the number of B cells expressing FasL as compared with both the untreated B-cell population or with those that were mock infected (2- and 6-fold increase in the percentage of FasL-positive B cells; P = .0001 and P = .005, respectively; Fig 7). CD14+monocytes also appeared to increase their FasL after EBV infection compared with mock-infected cells (2.6-fold, P = .009); however, when they were compared with the untreated population, they did not show a significant statistical difference (P = .44; Fig7). CD56+ NK cells increased FasL expression upon in vitro culture, regardless of the stimulant, making it unclear whether EBV plays a specific role in increasing NK FasL (Fig 7). CD4+and CD8+ T cells stimulated with EBV or PHA did not show a statistically significant increase in their FasL expression when compared with either the untreated CD4+ and CD8+ population or mock-infected cells (Fig 7).
Induction of FasL in PBMCs after EBV or PHA stimulation. PBMCs from healthy blood donors were incubated at 1 × 10⁶cells/200 μL for 2 hours on ice with 1/10 vol of mock virus, purified Akata virus, or a final culture dilution of 1:500 (vol/vol) PHA. Cells were washed 2 times with cold PBS and cultured for 24 hours at 5 × 10⁵ cells/mL. Cells were incubated with PE-conjugated CD4, CD8, CD20, CD16, or CD14 and rabbit anti-FasL, followed by incubation with FITC-conjugated goat antirabbit IgG. Cells were analyzed by FACS analysis and the results are expressed as the mean percentage positive cells ± SEM for 5 separate blood donors.
Induction of FasL in PBMCs after EBV or PHA stimulation. PBMCs from healthy blood donors were incubated at 1 × 10⁶cells/200 μL for 2 hours on ice with 1/10 vol of mock virus, purified Akata virus, or a final culture dilution of 1:500 (vol/vol) PHA. Cells were washed 2 times with cold PBS and cultured for 24 hours at 5 × 10⁵ cells/mL. Cells were incubated with PE-conjugated CD4, CD8, CD20, CD16, or CD14 and rabbit anti-FasL, followed by incubation with FITC-conjugated goat antirabbit IgG. Cells were analyzed by FACS analysis and the results are expressed as the mean percentage positive cells ± SEM for 5 separate blood donors.
When tested for the ability of EBV-treated, CD95-cross-linked T cells to respond to anti-CD3 and IL-2, as measured by [3H]-thymidine incorporation, EBV-stimulated, CD95-cross-linked T cells were greatly impaired. As shown in Table 1, T cells exposed to EBV and anti-CD95 mouse MoAb lost more than 83% (average mock IL-2 vaverage EBV IL-2, P = .03), 68% (average mock anti-CD3v average EBV anti-CD3, P = .3), and 77% (average mock anti-CD3 + IL-2 v average EBV anti-CD3 + IL-2, P = .04) of their proliferative response to IL-2, anti-CD3, and anti-CD3 plus IL-2, respectively.
To rule out the possibility that the loss of T-cell proliferation after EBV stimulation and anti-CD95 antibody treatment was due to apoptosis and a consequent decrease in T-cell number, PBMCs were first stimulated for 24 hours with EBV. Thereafter, T cells or PBMCs were challenged with the T-cell mitogens, anti-CD3, and IL-2. As shown in Table 2, T cells stimulated with mitogen in the presence of B cells and other PBMC subpopulations were suppressed by 42% (P = .15), whereas T cells challenged in the absence of other lymphocyte populations were not suppressed (Table 2). These results, along with those seen in Figs 5 and 7, would suggest that B cells or macrophages expressing FasL promote T-cell apoptosis, thus lowering the number of available T cells responsive to mitogen. However, in the absence of FasL, T cells stimulated by EBV did not undergo apoptosis (Fig 6) and maintained their responsiveness to mitogen (Table 2).
DISCUSSION
Various mechanisms have been proposed for the transient immunosuppression or anergy that accompanies primary EBV infection. These include the generation of suppressor T cells47 and the expression of virally encoded immunosuppressive cytokines.48,49 The finding that the T-cell apoptosis seen in acquired immunodeficiency syndrome (AIDS) patients might be mimicked in vitro by exposure of T cells to HIV gp120 for subsequent activation-induced cell death and anergy37 led us to test whether a similar mechanism might occur during EBV infection, thus providing an explanation for AIM-induced T-cell apoptosis and anergy. Our results using EBV particles or the major viral envelope glycoprotein gp350 demonstrated that induction by EBV of CD95 in T cells for their subsequent death after CD95-induced apoptosis can lead to a loss in the number of T cells responsive to mitogen. It is unlikely that EBV latent antigens expressed in immortalized B cells significantly contributed to our in vitro observations of increased CD95 expression in T cells, because the increased CD95 expression was seen at 12 hours postinfection, a time when B cells are not yet immortalized (Fig 3).50 Furthermore, we documented that CD4+ T cells demonstrated an increase in CD95 expression after exposure to purified gp350 (Fig 4).
CD95, along with the tumor necrosis factor (TNF) receptors, are currently grouped together as the cell death receptors, which can initiate apoptosis.12 Recent evidence indicates that their intracellular signaling pathways share both common and distinct sets of proteins and signals.51 Our results strongly suggest that CD95 is a principal mediator in EBV-induced T-cell apoptosis in vitro, because T cells did not undergo apoptosis unless treated with an anti-CD95 antibody. Our results also indicate that T cells stimulated with EBV did not express significant levels of FasL (Fig 7) and did not exhibit significant apoptosis (<4% as compared with mock infected; Fig 6A and C). However, we did see a significant increase in the number of B cells and macrophages expressing FasL after EBV stimulation (Fig7). These results are comparable to those seen for HIV gp120, in which HIV or gp120 stimulation resulted in increased CD95 expression in purified T cells, but led to only low levels of apoptosis unless subsequently exposed to anti-CD95 IgM or activated monocytes.52,53 This relative absence of spontaneous apoptosis in HIV gp120-primed T cells was thought to be due to a lack of significant T-cell FasL expression.53
Our in vitro experiments indicated that the CD4+ T-cell population expressed higher levels of CD95 when exposed to virus or gp350 (Figs 3 and 4). We also observed a greater percentage of CD4+ cells undergoing apoptosis as compared with CD8+ cells in 24-hour EBV-stimulated PBMCs (24% v6% as compared with mock treatment), but an equal number of CD4+ and CD8+ cells undergoing apoptosis in 24-hour PHA-stimulated PBMCs (43% v 45%; Fig 5), implying that EBV-stimulated CD4+ cells may be more susceptible to FasL killing. This is in contrast to our in vivo observation that peripheral blood CD8+ T cells expressed higher levels of CD95 (Fig 1). One possible explanation for this difference is that CD8+ T cells from AIM patients, in addition to expressing higher levels of CD95, may also express different ratios of Bcl-2 gene products as compared with CD4+ T cells, thus making the CD8+ T cells resistant to apoptosis. Several previously reported in vitro models have demonstrated that CD4+ and CD8+ T cells, both of which expressed significant levels of CD95 upon stimulation, showed different ratios of Bax and Bcl-XL expression and differential apoptosis sensitivity.54,55 If CD95+CD8+lymphocytes in AIM PBMCs express higher ratios of Bcl-2:Bax versus Bcl-XL:Bax due to EBV antigen recognition, then they may be more resistant to FasL and hence reach higher levels in peripheral blood.10 55
An alternative explanation for our observed increase in CD95 expression in peripheral blood CD8+ cells from AIM patients may be that these lymphocytes are EBV antigen-activated CD8+ cells in transition. Several laboratories have found that the increase in CD8+ cells seen during AIM is due to an increase in the number of TCR-β clonotypes that recognize either the EBV lytic antigens BZLF1 and BRLF1 or the latent antigen EBNA3.56-58It is believed that these clonal populations may serve as temporary cytotoxic T cells for the control of primary EBV infection.56 Later, during the convalescent phase of IM, these cytotoxic T cells disappear. Our observed increase in the number of CD95+ CD8+ cells in AIM blood samples may represent CD8+ T cells in transition. During early AIM, these EBV-stimulated T cells would be CD95+ but FasL resistant due to increased levels of Bcl-2 and Bcl-XL. Later, during the convalescent phase of AIM, these CD95+ T cells would increasingly become FasL-sensitive and apoptotic, due to insufficient EBV stimulation. Thus, expression of CD95 in AIM CD8+ cells would serve as a check against their continued cytotoxic actions by promoting FasL-mediated anergy and apoptosis. Ultimately, the loss of these CD8+ cells by FasL would aid in the reestablishment of immune cell homeostasis.59Confirmation of our postulates concerning CD95 expression in AIM T cells must await further analysis of both the changes in functionality of CD95+ T cells and their expression of various antiapoptotic genes over the course of AIM infection.
In conclusion, our results demonstrate that in vitro EBV can increase the expression of CD95 in CD4+ T cells as well as FasL expression in B cells and macrophages. Together, CD95 and FasL can lead to increased CD4+ T-cell apoptosis. We also found that gp350 can promote CD4+ T-cell apoptosis by inducing CD95 expression. Thus, gp350, in addition to serving as a ligand for virus attachment and entry into B cells, may also function as an important immunomodulator by inducing T-cell apoptosis. Such a role for gp350 may be advantageous in promoting the establishment of EBV in B cells by eliminating acute EBV-reactive T cells.
ACKNOWLEDGMENT
The authors thank Dr Elliott Kieff for his helpful criticisms and suggestions, Dr Gerald Ahronheim for furnishing the AIM patient blood samples, and all of the volunteer blood donors who furnished blood samples for this study.
Supported by the Canadian Foundation for AIDS Research (J.E.T.) and the J. A. DeSéve Foundation (C.A.).
The publication costs of this article were defrayed in part by page charge payment. This article must therefore be hereby marked “advertisement” in accordance with 18 U.S.C. section 1734 solely to indicate this fact.
REFERENCES
Author notes
Address reprint requests to Jerome E. Tanner, PhD, Molecular Genetics Research Laboratory, Room R306, Children’s Hospital of Eastern Ontario Research Center, 401 Smyth Rd, Ottawa, Ontario, Canada K1H 8L1.

![Fig. 1. Levels of CD95 expression on PBMCs and CD4+and CD8+ peripheral blood T cells from AIM patients. PBMCs from a representative healthy blood donor (A through C) or from an AIM patient (D through F) were stained with FITC- and PE-conjugated control IgG (A and D), FITC-conjugated anti-CD95 and PE-conjugated anti-CD4 (B and E), or FITC-conjugated anti-CD95 and PE-conjugated anti-CD8 (C and F). Results from gated cells (upper right inserts in [A] and [D]) were plotted on a logarithmic scale. CD95 expression in gated peripheral blood lymphocytes from 25 healthy blood donors (□) or 7 AIM patients (▪) (G). Cells were analyzed by 2-color immunofluorescence after staining with FITC-conjugated CD95 (x-axis) and PE-conjugated anti-CD4 or anti-CD8 MoAbs (y-axis). Results are expressed as the mean percentage positive ± SD. Statistically significant values analyzed by the Mann-Whitney U test are designated by an asterisk.](https://ash.silverchair-cdn.com/ash/content_public/journal/blood/94/10/10.1182_blood.v94.10.3439.422k23_3439_3447/6/m_blod42223001x.jpeg?Expires=1767731052&Signature=VN1OKluIgn2n~GVQxKkRcJjmwVH~8yNtmZqobnIaNcid4qqy7RxyceFcS5-HY13Rt4wv8FMuuzzsBBeocEp0DgDxdkWlQMOqltBCRp-oNPea2IdZ5mjpsTLku43Jnmoe4uviBgJQTRlZ5nZSPkas394zG7tb2lpGlX2nJHkPGcmbbVlhONpX522xd~-upSrlWibb0NYPGigQeOMNhtMrR6tK1x89nxW8eT8JZ-UkBccWmKMbt6KgChCR3INez~hMEG~7voMVgrs6Y2cnsVc0JNle8XhygX8casWq8pd-A7dUeTNDL2nnn3fjv5UATJr6BOcX4FJqGL1qSv8AzMfRWA__&Key-Pair-Id=APKAIE5G5CRDK6RD3PGA)


![Fig. 1. Levels of CD95 expression on PBMCs and CD4+and CD8+ peripheral blood T cells from AIM patients. PBMCs from a representative healthy blood donor (A through C) or from an AIM patient (D through F) were stained with FITC- and PE-conjugated control IgG (A and D), FITC-conjugated anti-CD95 and PE-conjugated anti-CD4 (B and E), or FITC-conjugated anti-CD95 and PE-conjugated anti-CD8 (C and F). Results from gated cells (upper right inserts in [A] and [D]) were plotted on a logarithmic scale. CD95 expression in gated peripheral blood lymphocytes from 25 healthy blood donors (□) or 7 AIM patients (▪) (G). Cells were analyzed by 2-color immunofluorescence after staining with FITC-conjugated CD95 (x-axis) and PE-conjugated anti-CD4 or anti-CD8 MoAbs (y-axis). Results are expressed as the mean percentage positive ± SD. Statistically significant values analyzed by the Mann-Whitney U test are designated by an asterisk.](https://ash.silverchair-cdn.com/ash/content_public/journal/blood/94/10/10.1182_blood.v94.10.3439.422k23_3439_3447/6/m_blod42223001x.jpeg?Expires=1767731053&Signature=Y0Ts5pwbOeuc~KqcUgXTZHuACa202LaPAkipC8yd8iPh0LryFBbuFbpdhV~bNvvqDkeLJTDyQG6wByqc8y5Hvbqvhdg4C5aVzKqCyf3-YAULO8We0nMmIc8WdZtfw2KE~t7U3e2jKh0fcdQsANL6Xqh5ssZZaR500VHv2Lg4tZNxNXVwhPjjU76SR3c46QpUYV5FXeArkDtyqH~Mni9STaOAqlAZB8JHSSU09LisXDli71tGjyvblCLUt7~kMAzoQykwQzYc~ieZU6BZ9WstjsSWHTgHHDPzOJzkDs-zUrKeUYa6hO1-kxcei5sA6mZbU--oksJCy~MQR4Ia5zhp1g__&Key-Pair-Id=APKAIE5G5CRDK6RD3PGA)

